Reynoldston Airbnb Market Analysis 2025: Short Term Rental Data & Vacation Rental Statistics in Wales, United Kingdom
Is Airbnb profitable in Reynoldston in 2025? Explore comprehensive Airbnb analytics for Reynoldston, Wales, United Kingdom to uncover income potential. This 2025 STR market report for Reynoldston, based on AirROI data from April 2024 to March 2025, reveals key trends in the niche market of 26 active listings.
Whether you're considering an Airbnb investment in Reynoldston, optimizing your existing vacation rental, or exploring rental arbitrage opportunities, understanding the Reynoldston Airbnb data is crucial. Leveraging the low regulation environment is key to maximizing your short term rental income potential. Let's dive into the specifics.
Key Reynoldston Airbnb Performance Metrics Overview
Monthly Airbnb Revenue Variations & Income Potential in Reynoldston (2025)
Understanding the monthly revenue variations for Airbnb listings in Reynoldston is key to maximizing your short term rental income potential. Seasonality significantly impacts earnings. Our analysis, based on data from the past 12 months, shows that the peak revenue month for STRs in Reynoldston is typically August, while November often presents the lowest earnings, highlighting opportunities for strategic pricing adjustments during shoulder and low seasons. Explore the typical Airbnb income in Reynoldston across different performance tiers:
- Best-in-class properties (Top 10%) achieve $5,372+ monthly, often utilizing dynamic pricing and superior guest experiences.
- Strong performing properties (Top 25%) earn $3,912 or more, indicating effective management and desirable locations/amenities.
- Typical properties (Median) generate around $1,944 per month, representing the average market performance.
- Entry-level properties (Bottom 25%) see earnings around $1,008, often with potential for optimization.
Average Monthly Airbnb Earnings Trend in Reynoldston
Reynoldston Airbnb Occupancy Rate Trends (2025)
Maximize your bookings by understanding the Reynoldston STR occupancy trends. Seasonal demand shifts significantly influence how often properties are booked. Typically, Augustsees the highest demand (peak season occupancy), while February experiences the lowest (low season). Effective strategies, like adjusting minimum stays or offering promotions, can boost occupancy during slower periods. Here's how different property tiers perform in Reynoldston:
- Best-in-class properties (Top 10%) achieve 82%+ occupancy, indicating high desirability and potentially optimized availability.
- Strong performing properties (Top 25%) maintain 65% or higher occupancy, suggesting good market fit and guest satisfaction.
- Typical properties (Median) have an occupancy rate around 43%.
- Entry-level properties (Bottom 25%) average 23% occupancy, potentially facing higher vacancy.
Average Monthly Occupancy Rate Trend in Reynoldston
Average Daily Rate (ADR) Airbnb Trends in Reynoldston (2025)
Effective short term rental pricing strategy in Reynoldston involves understanding monthly ADR fluctuations. The Average Daily Rate (ADR) for Airbnb in Reynoldston typically peaks in July and dips lowest during January. Leveraging Airbnb dynamic pricing tools or strategies based on this seasonality can significantly boost revenue. Here's a look at the typical nightly rates achieved:
- Best-in-class properties (Top 10%) command rates of $519+ per night, often due to premium features or locations.
- Strong performing properties (Top 25%) achieve nightly rates of $219 or more.
- Typical properties (Median) charge around $171 per night.
- Entry-level properties (Bottom 25%) earn around $116 per night.
Average Daily Rate (ADR) Trend by Month in Reynoldston
Get Live Reynoldston Market Intelligence 👇

Explore Real-time Analytics
Airbnb Seasonality Analysis & Trends in Reynoldston (2025)
Peak Season (August, July, June)
- Revenue averages $4,037 per month
- Occupancy rates average 56.4%
- Daily rates average $285
Shoulder Season
- Revenue averages $2,839 per month
- Occupancy maintains around 43.2%
- Daily rates hold near $236
Low Season (April, September, November)
- Revenue drops to average $2,277 per month
- Occupancy decreases to average 40.8%
- Daily rates adjust to average $260
Seasonality Insights for Reynoldston
- The Airbnb seasonality in Reynoldston shows highly seasonal trends requiring careful strategy. While the sections above show seasonal averages, it's also insightful to look at the extremes:
- During the high season, the absolute peak month showcases Reynoldston's highest earning potential, with monthly revenues capable of climbing to $4,361, occupancy reaching a high of 61.0%, and ADRs peaking at $290.
- Conversely, the slowest single month of the year, typically falling within the low season, marks the market's lowest point. In this month, revenue might dip to $1,978, occupancy could drop to 32.6%, and ADRs may adjust down to $209.
- Understanding both the seasonal averages and these monthly peaks and troughs in revenue, occupancy, and ADR is crucial for maximizing your Airbnb profit potential in Reynoldston.
Seasonal Strategies for Maximizing Profit
- Peak Season: Maximize revenue through premium pricing and potentially longer minimum stays. Ensure high availability.
- Low Season: Offer competitive pricing, special promotions (e.g., extended stay discounts), and flexible cancellation policies. Target off-season travelers like remote workers or budget-conscious guests.
- Shoulder Seasons: Implement dynamic pricing that balances peak and low rates. Target weekend travelers or specific events. Offer slightly more flexible terms than peak season.
- Regularly analyze your own performance against these Reynoldston seasonality benchmarks and adjust your pricing and availability strategy accordingly.
Best Areas for Airbnb Investment in Reynoldston (2025)
Exploring the top neighborhoods for short-term rentals in Reynoldston? This section highlights key areas, outlining why they are attractive for hosts and guests, along with notable local attractions. Consider these locations based on your target guest profile and investment strategy.
| Neighborhood / Area | Why Host Here? (Target Guests & Appeal) | Key Attractions & Landmarks |
|---|---|---|
| Gower Peninsula | A designated Area of Outstanding Natural Beauty, it's known for its stunning coastline, hiking trails, and wildlife. Perfect for travelers seeking outdoor adventures and breathtaking views. | Rhossili Bay, Three Cliffs Bay, Gower Heritage Centre, Caswell Bay, Gower Walks |
| Swansea | A vibrant coastal city with a rich maritime history, Swansea attracts both leisure and business travelers, with its beaches, parks, and cultural sites. | Swansea Marina, The Swansea Museum, Castle Square, Object Theatre, Clyne Gardens |
| Mumbles | A charming seaside village with scenic views, local boutiques, and eateries. It provides a relaxed atmosphere with beach access, making it a favorite among tourists. | Mumbles Pier, Oystermouth Castle, Gower Coast Path, Langland Bay, Mumbles Lighthouse |
| Brecon Beacons National Park | Known for its beautiful mountains and stunning landscapes. Popular for hiking, cycling, and outdoor activities, perfect for nature enthusiasts. | Pen y Fan, Brecon Beacons Visitor Centre, Waterfall Country, Llangorse Lake, Table Mountain |
| Port Eynon | Famous for its sandy beach and family-friendly atmosphere, Port Eynon is a top choice for summer holidays. Ideal for families and beach lovers. | Port Eynon Beach, Gower Heritage Centre, Eynon Point, Salt House, Thistleboon Bay |
| Pwlldu Bay | A hidden gem on the Gower Peninsula, offering stunning views and a tranquil environment, perfect for those looking to escape the crowds. | Pwlldu Bay Beach, Pwlldu Head, Local hiking trails, Scenic viewpoints, Wildlife observation |
| Llangennith | Renowned for its surf-friendly beach and natural beauty, Llangennith attracts surfers and nature lovers alike, providing a vibrant beach atmosphere. | Llangennith Beach, Surf schools, Wildlife spots, Local pubs, Hiking trails |
| Oxwich Bay | Known for its beautiful beach and nature reserve, Oxwich Bay is ideal for those seeking tranquil beach days and scenic walks, appealing to both couples and families. | Oxwich Beach, Oxwich Castle, Gower National Park, Local restaurants, Wildlife trails |
Understanding Airbnb License Requirements & STR Laws in Reynoldston (2025)
While Reynoldston, Wales, United Kingdom currently shows low STR regulations, specific Airbnb license requirements might still exist or change. Always verify the latest short term rental regulations and Airbnb license requirements directly with local government authorities for Reynoldston to ensure full compliance before hosting.
(Source: AirROI data, 2025, finding no licensed listings among those analyzed)
Top Performing Airbnb Properties in Reynoldston (2025)
Benchmark your potential! Explore examples of top-performing Airbnb properties in Reynoldstonbased on Trailing Twelve Month (TTM) revenue. Analyze their characteristics, revenue, occupancy rate, and ADR to understand what drives success in this market.

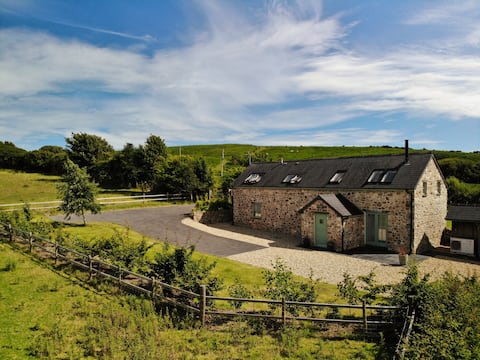
The Forge
Entire Place • 6 bedrooms
Hidden Gem - Cosy, Modern Cottage w/Log fire
Entire Place • 2 bedrooms
Secret Cosy Cottage in heart of Gower Peninsula
Entire Place • 3 bedrooms
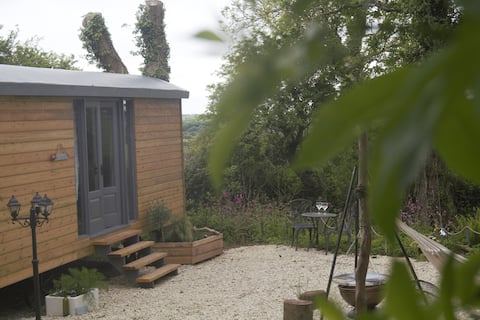
Romantic Shepherds Hut Based in the heart of Gower
Entire Place • 1 bedroom

Cozy Cottage Hot Tub Logburner Beach or Pub 5 min
Entire Place • 1 bedroom

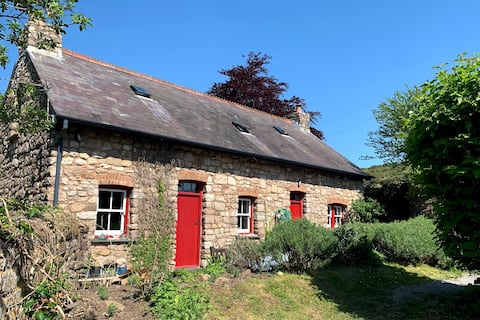
Holm Oak Cottage - 3 Bedroom Cottage - Reynoldston
Entire Place • 3 bedrooms
Note: Performance varies based on location, size, amenities, seasonality, and management quality. Data reflects the past 12 months.
Top Performing Airbnb Hosts in Reynoldston (2025)
Learn from the best! This table showcases top-performing Airbnb hosts in Reynoldston based on the number of properties managed and estimated total revenue over the past year. Analyze their scale and performance metrics.
| Host Name | Properties | Grossing Revenue | Stay Reviews | Avg Rating |
|---|---|---|---|---|
| Karly | 2 | $168,410 | 5 | 2.17/5.0 |
| Jane | 1 | $58,046 | 166 | 4.95/5.0 |
| Nadia | 2 | $55,950 | 38 | 2.29/5.0 |
| Helen | 1 | $53,106 | 129 | 4.84/5.0 |
| Claire | 3 | $48,609 | 264 | 4.80/5.0 |
| Jules | 1 | $39,947 | 368 | 4.91/5.0 |
| Joseph | 1 | $36,686 | 12 | 4.42/5.0 |
| Katharine | 1 | $35,368 | 96 | 4.70/5.0 |
| Home From Home | 1 | $32,911 | 8 | 3.38/5.0 |
| Cottages | 1 | $27,477 | 4 | 4.75/5.0 |
Analyzing the strategies of top hosts, such as their property selection, pricing, and guest communication, can offer valuable lessons for optimizing your own Airbnb operations in Reynoldston.
Dive Deeper: Advanced Reynoldston STR Market Data (2025)
Ready to unlock more insights? AirROI provides access to advanced metrics and comprehensive Airbnb data for Reynoldston. Explore detailed analytics beyond this report to refine your investment strategy, optimize pricing, and maximize your vacation rental profits.
Explore Advanced MetricsReynoldston Short-Term Rental Market Composition (2025): Property & Room Types
Room Type Distribution
Property Type Distribution
Market Composition Insights for Reynoldston
- The Reynoldston Airbnb market composition is heavily skewed towards Entire Home/Apt listings, which make up 61.5% of the 26 active rentals. This indicates strong guest preference for privacy and space.
- However, a notable 38.5% share for Private Rooms suggests opportunities for budget-conscious travelers or hosts renting out spare rooms.
- Looking at the property type distribution in Reynoldston, House properties are the most common (61.5%), reflecting the local real estate landscape.
- Houses represent a significant 61.5% portion, catering likely to families or larger groups.
- The presence of 11.5% Hotel/Boutique listings indicates integration with traditional hospitality.
- Smaller segments like apartment/condo, outdoor/unique (combined 7.6%) offer potential for unique stay experiences.
Reynoldston Airbnb Room Capacity Analysis (2025): Bedroom Distribution
Distribution of Listings by Number of Bedrooms
Room Capacity Insights for Reynoldston
- The dominant room capacity in Reynoldston is 1 bedroom listings, making up 34.6% of the market. This suggests a strong demand for properties suitable for couples or solo travelers.
- Together, 1 bedroom and 3 bedrooms properties represent 53.8% of the active Airbnb listings in Reynoldston, indicating a high concentration in these sizes.
- A significant 23.0% of listings offer 3+ bedrooms, catering to larger groups and families seeking more space in Reynoldston.
Reynoldston Vacation Rental Guest Capacity Trends (2025)
Distribution of Listings by Guest Capacity
Guest Capacity Insights for Reynoldston
- The most common guest capacity trend in Reynoldston vacation rentals is listings accommodating 2 guests (30.8%). This suggests the primary traveler segment is likely couples or solo travelers.
- Properties designed for 2 guests and 6 guests dominate the Reynoldston STR market, accounting for 53.9% of listings.
- 26.9% of properties accommodate 6+ guests, serving the market segment for larger families or group travel in Reynoldston.
- On average, properties in Reynoldston are equipped to host 2.9 guests.
Reynoldston Airbnb Booking Patterns (2025): Available vs. Booked Days
Available Days Distribution
Booked Days Distribution
Booking Pattern Insights for Reynoldston
- The most common availability pattern in Reynoldston falls within the 181-270 days range, representing 42.3% of listings. This suggests many properties have significant open periods on their calendars.
- Approximately 76.9% of listings show high availability (181+ days open annually), indicating potential for increased bookings or specific owner usage patterns.
- For booked days, the 91-180 days range is most frequent in Reynoldston (46.2%), reflecting common guest stay durations or potential owner blocking patterns.
- A notable 23.1% of properties secure long booking periods (181+ days booked per year), highlighting successful long-term rental strategies or significant owner usage.
Reynoldston Airbnb Minimum Stay Requirements Analysis
Distribution of Listings by Minimum Night Requirement
1 Night
11 listings
45.8% of total
2 Nights
5 listings
20.8% of total
3 Nights
5 listings
20.8% of total
4-6 Nights
1 listings
4.2% of total
30+ Nights
2 listings
8.3% of total
Key Insights
- The most prevalent minimum stay requirement in Reynoldston is 1 Night, adopted by 45.8% of listings. This highlights the market's preference for shorter, flexible bookings.
- A strong majority (66.6%) of the Reynoldston Airbnb data shows acceptance of very short stays (1-2 nights), indicating a dynamic, high-turnover market.
Recommendations
- Align with the market by considering a 1 Night minimum stay, as 45.8% of Reynoldston hosts use this setting.
- Explore offering discounts for stays of 30+ nights to attract the 8.3% of the market seeking extended stays.
- Adjust minimum nights based on seasonality – potentially shorter during low season and longer during peak demand periods in Reynoldston.
Reynoldston Airbnb Cancellation Policy Trends Analysis (2025)
Super Strict 60 Days
2 listings
8.7% of total
Flexible
6 listings
26.1% of total
Moderate
3 listings
13% of total
Firm
4 listings
17.4% of total
Strict
8 listings
34.8% of total
Cancellation Policy Insights for Reynoldston
- The prevailing Airbnb cancellation policy trend in Reynoldston is Strict, used by 34.8% of listings.
- A majority (52.2%) of hosts in Reynoldston utilize Firm or Strict policies, indicating a market where hosts prioritize booking security.
Recommendations for Hosts
- Consider adopting a Strict policy to align with the 34.8% market standard in Reynoldston.
- With 34.8% using Strict terms, this is a viable option in Reynoldston, particularly for high-value properties or during peak demand periods.
- Regularly review your cancellation policy against competitors and market demand shifts in Reynoldston.
Reynoldston STR Booking Lead Time Analysis (2025)
Average Booking Lead Time by Month
Booking Lead Time Insights for Reynoldston
- The overall average booking lead time for vacation rentals in Reynoldston is 81 days.
- Guests book furthest in advance for stays during June (average 125 days), likely coinciding with peak travel demand or local events.
- The shortest booking windows occur for stays in November (average 54 days), indicating more last-minute travel plans during this time.
- Seasonally, Summer (105 days avg.) sees the longest lead times, while Fall (72 days avg.) has the shortest, reflecting typical travel planning cycles.
Recommendations for Hosts
- Use the overall average lead time (81 days) as a baseline for your pricing and availability strategy in Reynoldston.
- For June stays, consider implementing length-of-stay discounts or slightly higher rates for bookings made less than 125 days out to capitalize on advance planning.
- Target marketing efforts for the Summer season well in advance (at least 105 days) to capture early planners.
- Monitor your own booking lead times against these Reynoldston averages to identify opportunities for dynamic pricing adjustments.
Popular & Essential Airbnb Amenities in Reynoldston (2025)
Amenity Prevalence
Amenity Insights for Reynoldston
- Essential amenities in Reynoldston that guests expect include: Heating, Smoke alarm, Wifi. Lacking these (any) could significantly impact bookings.
- Popular amenities like TV, Essentials, Hair dryer are common but not universal. Offering these can provide a competitive edge.
Recommendations for Hosts
- Ensure your listing includes all essential amenities for Reynoldston: Heating, Smoke alarm, Wifi.
- Consider adding popular differentiators like TV or Essentials to increase appeal.
- Highlight unique or less common amenities you offer (e.g., hot tub, dedicated workspace, EV charger) in your listing description and photos.
- Regularly check competitor amenities in Reynoldston to stay competitive.
Reynoldston Airbnb Guest Demographics & Profile Analysis (2025)
Guest Profile Summary for Reynoldston
- The typical guest profile for Airbnb in Reynoldston consists of primarily domestic travelers (94%), often arriving from nearby England, typically belonging to the Post-2000s (Gen Z/Alpha) group (50%), primarily speaking English or French.
- Domestic travelers account for 93.9% of guests.
- Key international markets include United Kingdom (93.9%) and Germany (1.5%).
- Top languages spoken are English (68.2%) followed by French (9.1%).
- A significant demographic segment is the Post-2000s (Gen Z/Alpha) group, representing 50% of guests.
Recommendations for Hosts
- Target domestic marketing efforts towards travelers from England and London.
- Tailor amenities and listing descriptions to appeal to the dominant Post-2000s (Gen Z/Alpha) demographic (e.g., highlight fast WiFi, smart home features, local guides).
- Highlight unique local experiences or amenities relevant to the primary guest profile.
- Consider seasonal promotions aligned with peak travel times for key origin markets.
Nearby Short-Term Rental Market Comparison
How does the Reynoldston Airbnb market stack up against its neighbors? Compare key performance metrics like average monthly revenue, ADR, and occupancy rates in surrounding areas to understand the broader regional STR landscape.
| Market | Active Properties | Monthly Revenue | Daily Rate | Avg. Occupancy |
|---|---|---|---|---|
| Llanrhidian | 15 | $4,842 | $386.18 | 53% |
| Crai | 20 | $4,799 | $371.85 | 46% |
| Trenance | 19 | $4,795 | $428.63 | 43% |
| Angle | 13 | $4,602 | $384.81 | 42% |
| Abbeycwmhir | 10 | $4,502 | $259.19 | 49% |
| Ludchurch | 15 | $4,354 | $291.87 | 43% |
| Chirbury | 14 | $4,233 | $702.20 | 41% |
| Cwmann | 17 | $4,162 | $228.82 | 54% |
| Borth-y-Gêst | 18 | $4,139 | $240.51 | 55% |
| Redberth | 29 | $4,103 | $223.37 | 59% |