Mynytho Airbnb Market Analysis 2025: Short Term Rental Data & Vacation Rental Statistics in Wales, United Kingdom
Is Airbnb profitable in Mynytho in 2025? Explore comprehensive Airbnb analytics for Mynytho, Wales, United Kingdom to uncover income potential. This 2025 STR market report for Mynytho, based on AirROI data from April 2024 to March 2025, reveals key trends in the niche market of 21 active listings.
Whether you're considering an Airbnb investment in Mynytho, optimizing your existing vacation rental, or exploring rental arbitrage opportunities, understanding the Mynytho Airbnb data is crucial. Leveraging the low regulation environment is key to maximizing your short term rental income potential. Let's dive into the specifics.
Key Mynytho Airbnb Performance Metrics Overview
Monthly Airbnb Revenue Variations & Income Potential in Mynytho (2025)
Understanding the monthly revenue variations for Airbnb listings in Mynytho is key to maximizing your short term rental income potential. Seasonality significantly impacts earnings. Our analysis, based on data from the past 12 months, shows that the peak revenue month for STRs in Mynytho is typically August, while January often presents the lowest earnings, highlighting opportunities for strategic pricing adjustments during shoulder and low seasons. Explore the typical Airbnb income in Mynytho across different performance tiers:
- Best-in-class properties (Top 10%) achieve $6,734+ monthly, often utilizing dynamic pricing and superior guest experiences.
- Strong performing properties (Top 25%) earn $4,697 or more, indicating effective management and desirable locations/amenities.
- Typical properties (Median) generate around $3,106 per month, representing the average market performance.
- Entry-level properties (Bottom 25%) see earnings around $1,722, often with potential for optimization.
Average Monthly Airbnb Earnings Trend in Mynytho
Mynytho Airbnb Occupancy Rate Trends (2025)
Maximize your bookings by understanding the Mynytho STR occupancy trends. Seasonal demand shifts significantly influence how often properties are booked. Typically, Augustsees the highest demand (peak season occupancy), while January experiences the lowest (low season). Effective strategies, like adjusting minimum stays or offering promotions, can boost occupancy during slower periods. Here's how different property tiers perform in Mynytho:
- Best-in-class properties (Top 10%) achieve 68%+ occupancy, indicating high desirability and potentially optimized availability.
- Strong performing properties (Top 25%) maintain 55% or higher occupancy, suggesting good market fit and guest satisfaction.
- Typical properties (Median) have an occupancy rate around 37%.
- Entry-level properties (Bottom 25%) average 24% occupancy, potentially facing higher vacancy.
Average Monthly Occupancy Rate Trend in Mynytho
Average Daily Rate (ADR) Airbnb Trends in Mynytho (2025)
Effective short term rental pricing strategy in Mynytho involves understanding monthly ADR fluctuations. The Average Daily Rate (ADR) for Airbnb in Mynytho typically peaks in October and dips lowest during March. Leveraging Airbnb dynamic pricing tools or strategies based on this seasonality can significantly boost revenue. Here's a look at the typical nightly rates achieved:
- Best-in-class properties (Top 10%) command rates of $699+ per night, often due to premium features or locations.
- Strong performing properties (Top 25%) achieve nightly rates of $399 or more.
- Typical properties (Median) charge around $258 per night.
- Entry-level properties (Bottom 25%) earn around $166 per night.
Average Daily Rate (ADR) Trend by Month in Mynytho
Get Live Mynytho Market Intelligence 👇

Explore Real-time Analytics
Airbnb Seasonality Analysis & Trends in Mynytho (2025)
Peak Season (August, July, May)
- Revenue averages $5,374 per month
- Occupancy rates average 60.5%
- Daily rates average $389
Shoulder Season
- Revenue averages $3,515 per month
- Occupancy maintains around 38.3%
- Daily rates hold near $360
Low Season (January, March, December)
- Revenue drops to average $2,180 per month
- Occupancy decreases to average 23.3%
- Daily rates adjust to average $295
Seasonality Insights for Mynytho
- The Airbnb seasonality in Mynytho shows highly seasonal trends requiring careful strategy. While the sections above show seasonal averages, it's also insightful to look at the extremes:
- During the high season, the absolute peak month showcases Mynytho's highest earning potential, with monthly revenues capable of climbing to $5,889, occupancy reaching a high of 71.6%, and ADRs peaking at $396.
- Conversely, the slowest single month of the year, typically falling within the low season, marks the market's lowest point. In this month, revenue might dip to $1,360, occupancy could drop to 14.0%, and ADRs may adjust down to $290.
- Understanding both the seasonal averages and these monthly peaks and troughs in revenue, occupancy, and ADR is crucial for maximizing your Airbnb profit potential in Mynytho.
Seasonal Strategies for Maximizing Profit
- Peak Season: Maximize revenue through premium pricing and potentially longer minimum stays. Ensure high availability.
- Low Season: Offer competitive pricing, special promotions (e.g., extended stay discounts), and flexible cancellation policies. Target off-season travelers like remote workers or budget-conscious guests.
- Shoulder Seasons: Implement dynamic pricing that balances peak and low rates. Target weekend travelers or specific events. Offer slightly more flexible terms than peak season.
- Regularly analyze your own performance against these Mynytho seasonality benchmarks and adjust your pricing and availability strategy accordingly.
Best Areas for Airbnb Investment in Mynytho (2025)
Exploring the top neighborhoods for short-term rentals in Mynytho? This section highlights key areas, outlining why they are attractive for hosts and guests, along with notable local attractions. Consider these locations based on your target guest profile and investment strategy.
| Neighborhood / Area | Why Host Here? (Target Guests & Appeal) | Key Attractions & Landmarks |
|---|---|---|
| Mynytho Beach | Beautiful sandy beach area ideal for family vacations and water sports. Attracts tourists looking for a relaxing getaway with stunning views and beach activities. | Mynytho Beach, Water sports facilities, Seaside cafes, Walking trails |
| Abersoch | Lively coastal village known for its vibrant atmosphere, watersports, and nightlife. Popular with younger crowds and families seeking adventure and social activities. | Abersoch Beach, Surfing schools, Golf course, Local shops, Pubs and restaurants |
| Pwllheli | Traditional market town with a picturesque harbor and great access to the Llŷn Peninsula. Appeals to tourists who enjoy local culture and scenic walks. | Pwllheli Marina, Market square, Local markets, Beaches nearby |
| Porthdinllaen | Charming village known for its historic pub and beautiful beach setting. Ideal for vacationers looking for a quaint, relaxing atmosphere. | Porthdinllaen Beach, Ty Coch Inn, Coastal walks, Historical sites |
| Nefyn | Scenic coastal area famous for its beautiful beaches and golf courses. A perfect spot for outdoor enthusiasts and those looking to escape the city. | Nefyn Beach, Nefyn Golf Club, Walking trails, Local eateries |
| Trefor | Quaint village located near rugged coastline and renowned for its scenic views. Popular for those looking for tranquility and nature. | Trefor Harbour, Coastal paths, Local fishing spots |
| Criccieth | Historic seaside town with a beautiful castle and shingle beach. Great for visitors interested in history and exploring the surrounding natural beauty. | Criccieth Castle, Criccieth Beach, Local shops, Restaurants, Walking trails |
| Llanbedrog | Quiet village known for its colorful beach huts and stunning coastal scenery. Appeals to families and visitors looking for a peaceful retreat. | Llanbedrog Beach, Art galleries, Nature reserves, Walking trails |
Understanding Airbnb License Requirements & STR Laws in Mynytho (2025)
While Mynytho, Wales, United Kingdom currently shows low STR regulations, specific Airbnb license requirements might still exist or change. Always verify the latest short term rental regulations and Airbnb license requirements directly with local government authorities for Mynytho to ensure full compliance before hosting.
(Source: AirROI data, 2025, finding no licensed listings among those analyzed)
Top Performing Airbnb Properties in Mynytho (2025)
Benchmark your potential! Explore examples of top-performing Airbnb properties in Mynythobased on Trailing Twelve Month (TTM) revenue. Analyze their characteristics, revenue, occupancy rate, and ADR to understand what drives success in this market.

6 bedded home with stunning sea views and pool
Entire Place • 6 bedrooms

Capel Nant: A Renovated 19th Century Chapel
Entire Place • 4 bedrooms
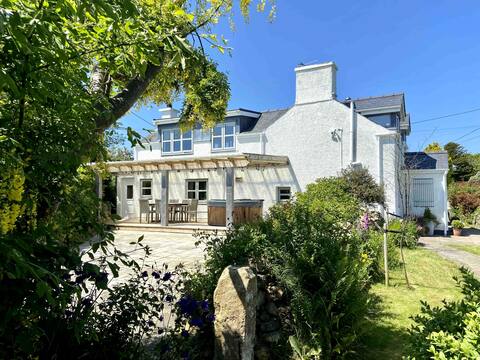
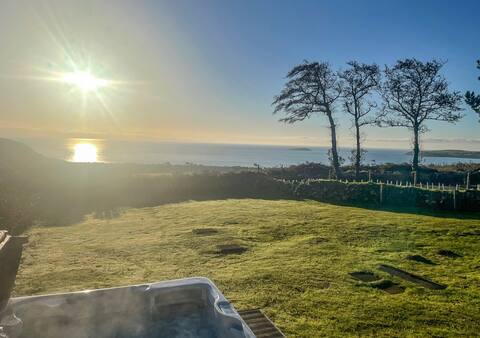
Delightful 3 bed cottage with hot tub & sea views.
Entire Place • 3 bedrooms
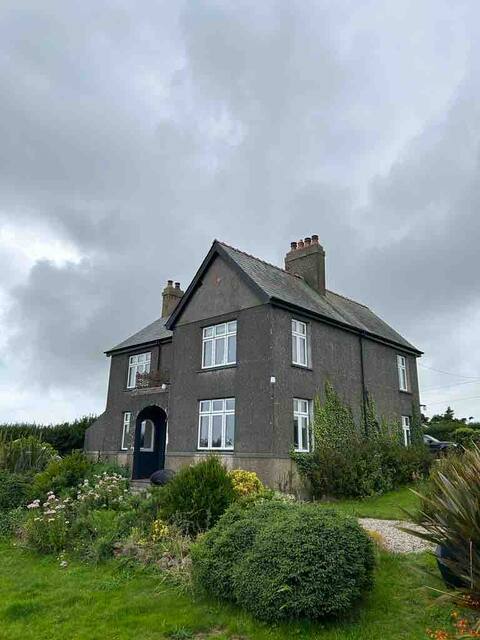
House in Mynytho
Entire Place • 4 bedrooms
Bryn Melyn
Entire Place • 3 bedrooms

Mur Cwymp - Holiday Apartment - Stunning location
Entire Place • 1 bedroom
Note: Performance varies based on location, size, amenities, seasonality, and management quality. Data reflects the past 12 months.
Top Performing Airbnb Hosts in Mynytho (2025)
Learn from the best! This table showcases top-performing Airbnb hosts in Mynytho based on the number of properties managed and estimated total revenue over the past year. Analyze their scale and performance metrics.
| Host Name | Properties | Grossing Revenue | Stay Reviews | Avg Rating |
|---|---|---|---|---|
| Janine | 1 | $126,406 | 75 | 4.92/5.0 |
| Wales Cottage Holidays | 5 | $79,681 | 24 | 3.51/5.0 |
| Sue | 2 | $72,803 | 664 | 4.97/5.0 |
| Sue | 1 | $59,482 | 40 | 5.00/5.0 |
| Chris | 1 | $58,511 | 80 | 5.00/5.0 |
| Ann Marie | 1 | $44,975 | 26 | 4.92/5.0 |
| Natalie | 1 | $35,067 | 10 | 5.00/5.0 |
| Host #230989070 | 1 | $34,488 | 6 | 4.83/5.0 |
| Host #180528406 | 1 | $28,515 | 59 | 4.73/5.0 |
| Martin | 1 | $25,524 | 47 | 4.81/5.0 |
Analyzing the strategies of top hosts, such as their property selection, pricing, and guest communication, can offer valuable lessons for optimizing your own Airbnb operations in Mynytho.
Dive Deeper: Advanced Mynytho STR Market Data (2025)
Ready to unlock more insights? AirROI provides access to advanced metrics and comprehensive Airbnb data for Mynytho. Explore detailed analytics beyond this report to refine your investment strategy, optimize pricing, and maximize your vacation rental profits.
Explore Advanced MetricsMynytho Short-Term Rental Market Composition (2025): Property & Room Types
Room Type Distribution
Property Type Distribution
Market Composition Insights for Mynytho
- The Mynytho Airbnb market composition is heavily skewed towards Entire Home/Apt listings, which make up 100% of the 21 active rentals. This indicates strong guest preference for privacy and space.
- Looking at the property type distribution in Mynytho, House properties are the most common (76.2%), reflecting the local real estate landscape.
- Houses represent a significant 76.2% portion, catering likely to families or larger groups.
Mynytho Airbnb Room Capacity Analysis (2025): Bedroom Distribution
Distribution of Listings by Number of Bedrooms
Room Capacity Insights for Mynytho
- The dominant room capacity in Mynytho is 3 bedrooms listings, making up 47.6% of the market. This suggests a strong demand for properties suitable for families or small groups.
- Together, 3 bedrooms and 4 bedrooms properties represent 71.4% of the active Airbnb listings in Mynytho, indicating a high concentration in these sizes.
- A significant 80.9% of listings offer 3+ bedrooms, catering to larger groups and families seeking more space in Mynytho.
Mynytho Vacation Rental Guest Capacity Trends (2025)
Distribution of Listings by Guest Capacity
Guest Capacity Insights for Mynytho
- The most common guest capacity trend in Mynytho vacation rentals is listings accommodating 8+ guests (38.1%). This suggests the primary traveler segment is likely larger groups.
- Properties designed for 8+ guests and 6 guests dominate the Mynytho STR market, accounting for 66.7% of listings.
- 71.5% of properties accommodate 6+ guests, serving the market segment for larger families or group travel in Mynytho.
- On average, properties in Mynytho are equipped to host 6.0 guests.
Mynytho Airbnb Booking Patterns (2025): Available vs. Booked Days
Available Days Distribution
Booked Days Distribution
Booking Pattern Insights for Mynytho
- The most common availability pattern in Mynytho falls within the 271-366 days range, representing 47.6% of listings. This suggests many properties have significant open periods on their calendars.
- Approximately 76.2% of listings show high availability (181+ days open annually), indicating potential for increased bookings or specific owner usage patterns.
- For booked days, the 91-180 days range is most frequent in Mynytho (28.6%), reflecting common guest stay durations or potential owner blocking patterns.
- A notable 23.8% of properties secure long booking periods (181+ days booked per year), highlighting successful long-term rental strategies or significant owner usage.
Mynytho Airbnb Minimum Stay Requirements Analysis
Distribution of Listings by Minimum Night Requirement
1 Night
2 listings
11.1% of total
2 Nights
5 listings
27.8% of total
3 Nights
5 listings
27.8% of total
4-6 Nights
2 listings
11.1% of total
30+ Nights
4 listings
22.2% of total
Key Insights
- The most prevalent minimum stay requirement in Mynytho is 2 Nights, adopted by 27.8% of listings. This highlights the market's preference for shorter, flexible bookings.
- A significant segment (22.2%) caters to monthly stays (30+ nights) in Mynytho, pointing to opportunities in the extended-stay market.
Recommendations
- Align with the market by considering a 2 Nights minimum stay, as 27.8% of Mynytho hosts use this setting.
- If feasible, allowing 1-night stays, especially midweek or during low season, could capture last-minute bookings, as only 11.1% currently do.
- Explore offering discounts for stays of 30+ nights to attract the 22.2% of the market seeking extended stays.
- Adjust minimum nights based on seasonality – potentially shorter during low season and longer during peak demand periods in Mynytho.
Mynytho Airbnb Cancellation Policy Trends Analysis (2025)
Super Strict 60 Days
4 listings
25% of total
Flexible
1 listings
6.3% of total
Moderate
2 listings
12.5% of total
Firm
8 listings
50% of total
Strict
1 listings
6.3% of total
Cancellation Policy Insights for Mynytho
- The prevailing Airbnb cancellation policy trend in Mynytho is Firm, used by 50% of listings.
- A majority (56.3%) of hosts in Mynytho utilize Firm or Strict policies, indicating a market where hosts prioritize booking security.
- Strict cancellation policies are quite rare (6.3%), potentially making listings with this policy less competitive unless justified by high demand or property type.
Recommendations for Hosts
- Consider adopting a Firm policy to align with the 50% market standard in Mynytho.
- Using a Strict policy might deter some guests, as only 6.3% of listings use it. Evaluate if potential revenue protection outweighs possible lower booking rates.
- Regularly review your cancellation policy against competitors and market demand shifts in Mynytho.
Mynytho STR Booking Lead Time Analysis (2025)
Average Booking Lead Time by Month
Booking Lead Time Insights for Mynytho
- The overall average booking lead time for vacation rentals in Mynytho is 74 days.
- Guests book furthest in advance for stays during June (average 142 days), likely coinciding with peak travel demand or local events.
- The shortest booking windows occur for stays in March (average 46 days), indicating more last-minute travel plans during this time.
- Seasonally, Summer (112 days avg.) sees the longest lead times, while Winter (67 days avg.) has the shortest, reflecting typical travel planning cycles.
Recommendations for Hosts
- Use the overall average lead time (74 days) as a baseline for your pricing and availability strategy in Mynytho.
- For June stays, consider implementing length-of-stay discounts or slightly higher rates for bookings made less than 142 days out to capitalize on advance planning.
- Target marketing efforts for the Summer season well in advance (at least 112 days) to capture early planners.
- Monitor your own booking lead times against these Mynytho averages to identify opportunities for dynamic pricing adjustments.
Popular & Essential Airbnb Amenities in Mynytho (2025)
Amenity Prevalence
Amenity Insights for Mynytho
- Essential amenities in Mynytho that guests expect include: Heating, Refrigerator, Smoke alarm, TV, Microwave, Kitchen, Oven, Bed linens, Wifi, Cooking basics. Lacking these (any) could significantly impact bookings.
Recommendations for Hosts
- Ensure your listing includes all essential amenities for Mynytho: Heating, Refrigerator, Smoke alarm, TV, Microwave, Kitchen, Oven, Bed linens, Wifi, Cooking basics.
- Prioritize adding missing essentials: Kitchen, Oven, Bed linens, Wifi, Cooking basics.
- Highlight unique or less common amenities you offer (e.g., hot tub, dedicated workspace, EV charger) in your listing description and photos.
- Regularly check competitor amenities in Mynytho to stay competitive.
Mynytho Airbnb Guest Demographics & Profile Analysis (2025)
Guest Profile Summary for Mynytho
- The typical guest profile for Airbnb in Mynytho consists of primarily domestic travelers (98%), often arriving from nearby England, typically belonging to the Post-2000s (Gen Z/Alpha) group (50%), primarily speaking English or French.
- Domestic travelers account for 98.1% of guests.
- Key international markets include United Kingdom (98.1%) and Switzerland (1.3%).
- Top languages spoken are English (66.2%) followed by French (6.2%).
- A significant demographic segment is the Post-2000s (Gen Z/Alpha) group, representing 50% of guests.
Recommendations for Hosts
- Target domestic marketing efforts towards travelers from England and Manchester.
- Tailor amenities and listing descriptions to appeal to the dominant Post-2000s (Gen Z/Alpha) demographic (e.g., highlight fast WiFi, smart home features, local guides).
- Highlight unique local experiences or amenities relevant to the primary guest profile.
- Consider seasonal promotions aligned with peak travel times for key origin markets.
Nearby Short-Term Rental Market Comparison
How does the Mynytho Airbnb market stack up against its neighbors? Compare key performance metrics like average monthly revenue, ADR, and occupancy rates in surrounding areas to understand the broader regional STR landscape.
| Market | Active Properties | Monthly Revenue | Daily Rate | Avg. Occupancy |
|---|---|---|---|---|
| Llanrhidian | 15 | $4,842 | $386.18 | 53% |
| Crai | 20 | $4,799 | $371.85 | 46% |
| Angle | 13 | $4,602 | $384.81 | 42% |
| Abbeycwmhir | 10 | $4,502 | $259.19 | 49% |
| Eglwys-bach | 16 | $4,413 | $315.23 | 52% |
| Ludchurch | 15 | $4,354 | $291.87 | 43% |
| Chirbury | 14 | $4,233 | $702.20 | 41% |
| Cwmann | 17 | $4,162 | $228.82 | 54% |
| Borth-y-Gêst | 18 | $4,139 | $240.51 | 55% |
| Redberth | 29 | $4,103 | $223.37 | 59% |