Moelfryn Airbnb Market Analysis 2025: Short Term Rental Data & Vacation Rental Statistics in Wales, United Kingdom
Is Airbnb profitable in Moelfryn in 2025? Explore comprehensive Airbnb analytics for Moelfryn, Wales, United Kingdom to uncover income potential. This 2025 STR market report for Moelfryn, based on AirROI data from April 2024 to March 2025, reveals key trends in the niche market of 19 active listings.
Whether you're considering an Airbnb investment in Moelfryn, optimizing your existing vacation rental, or exploring rental arbitrage opportunities, understanding the Moelfryn Airbnb data is crucial. Leveraging the low regulation environment is key to maximizing your short term rental income potential. Let's dive into the specifics.
Key Moelfryn Airbnb Performance Metrics Overview
Monthly Airbnb Revenue Variations & Income Potential in Moelfryn (2025)
Understanding the monthly revenue variations for Airbnb listings in Moelfryn is key to maximizing your short term rental income potential. Seasonality significantly impacts earnings. Our analysis, based on data from the past 12 months, shows that the peak revenue month for STRs in Moelfryn is typically August, while February often presents the lowest earnings, highlighting opportunities for strategic pricing adjustments during shoulder and low seasons. Explore the typical Airbnb income in Moelfryn across different performance tiers:
- Best-in-class properties (Top 10%) achieve $3,804+ monthly, often utilizing dynamic pricing and superior guest experiences.
- Strong performing properties (Top 25%) earn $2,721 or more, indicating effective management and desirable locations/amenities.
- Typical properties (Median) generate around $1,698 per month, representing the average market performance.
- Entry-level properties (Bottom 25%) see earnings around $991, often with potential for optimization.
Average Monthly Airbnb Earnings Trend in Moelfryn
Moelfryn Airbnb Occupancy Rate Trends (2025)
Maximize your bookings by understanding the Moelfryn STR occupancy trends. Seasonal demand shifts significantly influence how often properties are booked. Typically, Augustsees the highest demand (peak season occupancy), while November experiences the lowest (low season). Effective strategies, like adjusting minimum stays or offering promotions, can boost occupancy during slower periods. Here's how different property tiers perform in Moelfryn:
- Best-in-class properties (Top 10%) achieve 74%+ occupancy, indicating high desirability and potentially optimized availability.
- Strong performing properties (Top 25%) maintain 55% or higher occupancy, suggesting good market fit and guest satisfaction.
- Typical properties (Median) have an occupancy rate around 36%.
- Entry-level properties (Bottom 25%) average 18% occupancy, potentially facing higher vacancy.
Average Monthly Occupancy Rate Trend in Moelfryn
Average Daily Rate (ADR) Airbnb Trends in Moelfryn (2025)
Effective short term rental pricing strategy in Moelfryn involves understanding monthly ADR fluctuations. The Average Daily Rate (ADR) for Airbnb in Moelfryn typically peaks in August and dips lowest during January. Leveraging Airbnb dynamic pricing tools or strategies based on this seasonality can significantly boost revenue. Here's a look at the typical nightly rates achieved:
- Best-in-class properties (Top 10%) command rates of $373+ per night, often due to premium features or locations.
- Strong performing properties (Top 25%) achieve nightly rates of $224 or more.
- Typical properties (Median) charge around $138 per night.
- Entry-level properties (Bottom 25%) earn around $110 per night.
Average Daily Rate (ADR) Trend by Month in Moelfryn
Get Live Moelfryn Market Intelligence 👇

Explore Real-time Analytics
Airbnb Seasonality Analysis & Trends in Moelfryn (2025)
Peak Season (August, September, July)
- Revenue averages $3,019 per month
- Occupancy rates average 56.4%
- Daily rates average $212
Shoulder Season
- Revenue averages $1,993 per month
- Occupancy maintains around 36.1%
- Daily rates hold near $182
Low Season (February, April, November)
- Revenue drops to average $1,409 per month
- Occupancy decreases to average 29.8%
- Daily rates adjust to average $172
Seasonality Insights for Moelfryn
- The Airbnb seasonality in Moelfryn shows highly seasonal trends requiring careful strategy. While the sections above show seasonal averages, it's also insightful to look at the extremes:
- During the high season, the absolute peak month showcases Moelfryn's highest earning potential, with monthly revenues capable of climbing to $3,589, occupancy reaching a high of 61.7%, and ADRs peaking at $218.
- Conversely, the slowest single month of the year, typically falling within the low season, marks the market's lowest point. In this month, revenue might dip to $1,283, occupancy could drop to 26.7%, and ADRs may adjust down to $152.
- Understanding both the seasonal averages and these monthly peaks and troughs in revenue, occupancy, and ADR is crucial for maximizing your Airbnb profit potential in Moelfryn.
Seasonal Strategies for Maximizing Profit
- Peak Season: Maximize revenue through premium pricing and potentially longer minimum stays. Ensure high availability.
- Low Season: Offer competitive pricing, special promotions (e.g., extended stay discounts), and flexible cancellation policies. Target off-season travelers like remote workers or budget-conscious guests.
- Shoulder Seasons: Implement dynamic pricing that balances peak and low rates. Target weekend travelers or specific events. Offer slightly more flexible terms than peak season.
- Regularly analyze your own performance against these Moelfryn seasonality benchmarks and adjust your pricing and availability strategy accordingly.
Best Areas for Airbnb Investment in Moelfryn (2025)
Exploring the top neighborhoods for short-term rentals in Moelfryn? This section highlights key areas, outlining why they are attractive for hosts and guests, along with notable local attractions. Consider these locations based on your target guest profile and investment strategy.
| Neighborhood / Area | Why Host Here? (Target Guests & Appeal) | Key Attractions & Landmarks |
|---|---|---|
| Snowdonia National Park | A stunning location known for its natural beauty, hiking trails and adventure activities. It's a popular destination for tourists seeking outdoor experiences and connects visitors to scenic landscapes, including mountains and lakes. | Mount Snowdon, Llyn Padarn, Ogwen Valley, Capel Curig, Zip World |
| Conwy | Famous for its historic castle and charming old town. This coastal town attracts history buffs and families, offering a mix of cultural heritage and seaside relaxation. | Conwy Castle, The Smallest House in Great Britain, Plas Mawr, Conwy estuary, Llandudno North Shore Beach |
| Llandudno | Known as the 'Queen of the Welsh Resorts', this Victorian seaside town offers traditional holiday experiences, beautiful beaches, and a vibrant pier, appealing to families and couples alike. | Llandudno Pier, Great Orme, North Shore Beach, Venue Cymru, Happy Valley Gardens |
| Betws-y-Coed | A picturesque village in the heart of Snowdonia, ideal for those looking for serene nature escapes. It draws in tourists with its charming shops, cafes, and proximity to outdoor activities. | Swallow Falls, Conwy Valley Railway Museum, Fairy Glen, Gwydir Castle, Walking trails |
| Bangor | A university city that also serves as a gateway to North Wales. It attracts students and tourists alike, with a vibrant cultural scene and stunning coastal views. | Bangor Pier, Penrhyn Castle, Bangor University, Menai Bridge, Dreams to Reality |
| Aberdaron | A small village located on the Llyn Peninsula, offering tranquility and beautiful coastal scenery. Ideal for visitors seeking isolation and natural beauty. | Aberdaron Beach, St. Maelrhys Church, Llyn Peninsula Coastal Path, Ynys Rhiw, Porth Meudwy |
| Caernarfon | Home to the imposing Caernarfon Castle, this town is rich in history and culture. It attracts a mix of tourists interested in history and stunning waterfront views. | Caernarfon Castle, The Welsh Highland Railway, Menai Strait, Segontium Roman Fort, GypsyWood Park |
| Llanberis | A charming village known for its proximity to Snowdon and its various outdoor activities. It is popular among hikers and nature lovers who want to immerse themselves in the breathtaking landscape. | Snowdon Mountain Railway, National Slate Museum, Llyn Padarn, Dolbadarn Castle, Walking paths to Snowdon |
Understanding Airbnb License Requirements & STR Laws in Moelfryn (2025)
While Moelfryn, Wales, United Kingdom currently shows low STR regulations, specific Airbnb license requirements might still exist or change. Always verify the latest short term rental regulations and Airbnb license requirements directly with local government authorities for Moelfryn to ensure full compliance before hosting.
(Source: AirROI data, 2025, finding no licensed listings among those analyzed)
Top Performing Airbnb Properties in Moelfryn (2025)
Benchmark your potential! Explore examples of top-performing Airbnb properties in Moelfrynbased on Trailing Twelve Month (TTM) revenue. Analyze their characteristics, revenue, occupancy rate, and ADR to understand what drives success in this market.
stabl
Entire Place • 3 bedrooms

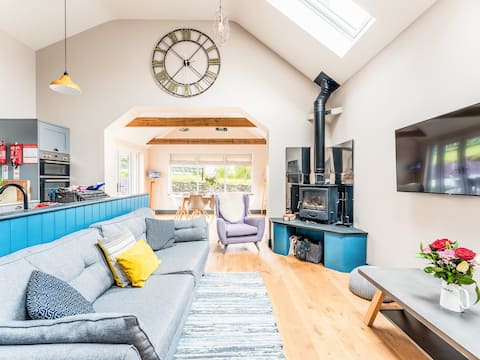
Dog friendly cottage in rural location near coast
Entire Place • 3 bedrooms
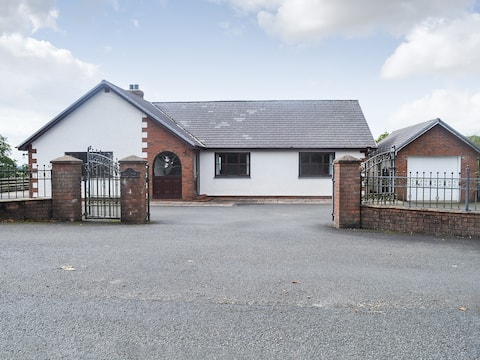
Awel Wen
Entire Place • 4 bedrooms
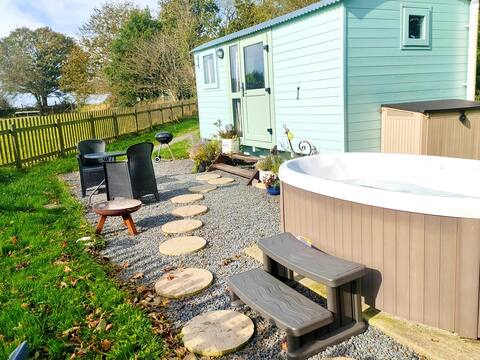
Cwt yr Hafod, private, hot tub, great views.
Entire Place • 1 bedroom
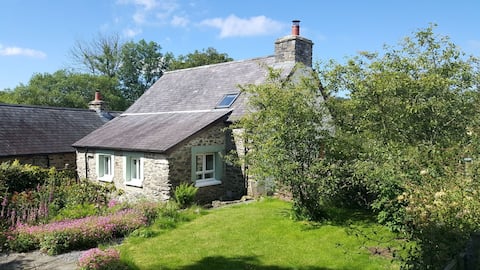
Romantic cottage for two in rural wildlife haven
Entire Place • 1 bedroom
Pentwyn Glamping Pod No.2
Entire Place • 1 bedroom
Note: Performance varies based on location, size, amenities, seasonality, and management quality. Data reflects the past 12 months.
Top Performing Airbnb Hosts in Moelfryn (2025)
Learn from the best! This table showcases top-performing Airbnb hosts in Moelfryn based on the number of properties managed and estimated total revenue over the past year. Analyze their scale and performance metrics.
| Host Name | Properties | Grossing Revenue | Stay Reviews | Avg Rating |
|---|---|---|---|---|
| Cottages | 3 | $123,116 | 31 | 5.00/5.0 |
| Philippa & David | 2 | $67,369 | 148 | 4.98/5.0 |
| Michelle | 3 | $47,231 | 181 | 4.94/5.0 |
| Teresa | 1 | $26,473 | 237 | 4.94/5.0 |
| Joy | 2 | $23,637 | 48 | 5.00/5.0 |
| Shell | 1 | $21,838 | 114 | 4.94/5.0 |
| Adam | 1 | $14,449 | 7 | 4.86/5.0 |
| Lindsey | 1 | $14,292 | 35 | 4.91/5.0 |
| Jo | 1 | $13,294 | 68 | 4.85/5.0 |
| Host #123565706 | 1 | $10,018 | 0 | 0.00/5.0 |
Analyzing the strategies of top hosts, such as their property selection, pricing, and guest communication, can offer valuable lessons for optimizing your own Airbnb operations in Moelfryn.
Dive Deeper: Advanced Moelfryn STR Market Data (2025)
Ready to unlock more insights? AirROI provides access to advanced metrics and comprehensive Airbnb data for Moelfryn. Explore detailed analytics beyond this report to refine your investment strategy, optimize pricing, and maximize your vacation rental profits.
Explore Advanced MetricsMoelfryn Short-Term Rental Market Composition (2025): Property & Room Types
Room Type Distribution
Property Type Distribution
Market Composition Insights for Moelfryn
- The Moelfryn Airbnb market composition is heavily skewed towards Entire Home/Apt listings, which make up 100% of the 19 active rentals. This indicates strong guest preference for privacy and space.
- Looking at the property type distribution in Moelfryn, House properties are the most common (47.4%), reflecting the local real estate landscape.
- Houses represent a significant 47.4% portion, catering likely to families or larger groups.
Moelfryn Airbnb Room Capacity Analysis (2025): Bedroom Distribution
Distribution of Listings by Number of Bedrooms
Room Capacity Insights for Moelfryn
- The dominant room capacity in Moelfryn is 1 bedroom listings, making up 52.6% of the market. This suggests a strong demand for properties suitable for couples or solo travelers.
- Together, 1 bedroom and 2 bedrooms properties represent 84.2% of the active Airbnb listings in Moelfryn, indicating a high concentration in these sizes.
- With over half the market (52.6%) consisting of studios or 1-bedroom units, Moelfryn is particularly well-suited for individuals or couples.
Moelfryn Vacation Rental Guest Capacity Trends (2025)
Distribution of Listings by Guest Capacity
Guest Capacity Insights for Moelfryn
- The most common guest capacity trend in Moelfryn vacation rentals is listings accommodating 4 guests (47.4%). This suggests the primary traveler segment is likely small families or groups.
- Properties designed for 4 guests and 2 guests dominate the Moelfryn STR market, accounting for 79.0% of listings.
- 15.8% of properties accommodate 6+ guests, serving the market segment for larger families or group travel in Moelfryn.
- On average, properties in Moelfryn are equipped to host 3.7 guests.
Moelfryn Airbnb Booking Patterns (2025): Available vs. Booked Days
Available Days Distribution
Booked Days Distribution
Booking Pattern Insights for Moelfryn
- The most common availability pattern in Moelfryn falls within the 181-270 days range, representing 36.8% of listings. This suggests many properties have significant open periods on their calendars.
- Approximately 73.6% of listings show high availability (181+ days open annually), indicating potential for increased bookings or specific owner usage patterns.
- For booked days, the 91-180 days range is most frequent in Moelfryn (36.8%), reflecting common guest stay durations or potential owner blocking patterns.
- A notable 26.4% of properties secure long booking periods (181+ days booked per year), highlighting successful long-term rental strategies or significant owner usage.
Moelfryn Airbnb Minimum Stay Requirements Analysis
Distribution of Listings by Minimum Night Requirement
1 Night
2 listings
10.5% of total
2 Nights
10 listings
52.6% of total
3 Nights
3 listings
15.8% of total
4-6 Nights
1 listings
5.3% of total
30+ Nights
3 listings
15.8% of total
Key Insights
- The most prevalent minimum stay requirement in Moelfryn is 2 Nights, adopted by 52.6% of listings. This highlights the market's preference for shorter, flexible bookings.
- A strong majority (63.1%) of the Moelfryn Airbnb data shows acceptance of very short stays (1-2 nights), indicating a dynamic, high-turnover market.
- A significant segment (15.8%) caters to monthly stays (30+ nights) in Moelfryn, pointing to opportunities in the extended-stay market.
Recommendations
- Align with the market by considering a 2 Nights minimum stay, as 52.6% of Moelfryn hosts use this setting.
- If feasible, allowing 1-night stays, especially midweek or during low season, could capture last-minute bookings, as only 10.5% currently do.
- A 2-night minimum appears standard (52.6%). Consider this for weekends or peak periods.
- Explore offering discounts for stays of 30+ nights to attract the 15.8% of the market seeking extended stays.
- Adjust minimum nights based on seasonality – potentially shorter during low season and longer during peak demand periods in Moelfryn.
Moelfryn Airbnb Cancellation Policy Trends Analysis (2025)
Super Strict 60 Days
3 listings
16.7% of total
Super Strict 30 Days
1 listings
5.6% of total
Flexible
2 listings
11.1% of total
Moderate
6 listings
33.3% of total
Firm
4 listings
22.2% of total
Strict
2 listings
11.1% of total
Cancellation Policy Insights for Moelfryn
- The prevailing Airbnb cancellation policy trend in Moelfryn is Moderate, used by 33.3% of listings.
- There's a relatively balanced mix between guest-friendly (44.4%) and stricter (33.3%) policies, offering choices for different guest needs.
Recommendations for Hosts
- Consider adopting a Moderate policy to align with the 33.3% market standard in Moelfryn.
- Using a Strict policy might deter some guests, as only 11.1% of listings use it. Evaluate if potential revenue protection outweighs possible lower booking rates.
- Regularly review your cancellation policy against competitors and market demand shifts in Moelfryn.
Moelfryn STR Booking Lead Time Analysis (2025)
Average Booking Lead Time by Month
Booking Lead Time Insights for Moelfryn
- The overall average booking lead time for vacation rentals in Moelfryn is 63 days.
- Guests book furthest in advance for stays during August (average 100 days), likely coinciding with peak travel demand or local events.
- The shortest booking windows occur for stays in February (average 31 days), indicating more last-minute travel plans during this time.
- Seasonally, Summer (81 days avg.) sees the longest lead times, while Winter (60 days avg.) has the shortest, reflecting typical travel planning cycles.
Recommendations for Hosts
- Use the overall average lead time (63 days) as a baseline for your pricing and availability strategy in Moelfryn.
- For August stays, consider implementing length-of-stay discounts or slightly higher rates for bookings made less than 100 days out to capitalize on advance planning.
- Target marketing efforts for the Summer season well in advance (at least 81 days) to capture early planners.
- Monitor your own booking lead times against these Moelfryn averages to identify opportunities for dynamic pricing adjustments.
Popular & Essential Airbnb Amenities in Moelfryn (2025)
Amenity Prevalence
Amenity Insights for Moelfryn
- Essential amenities in Moelfryn that guests expect include: Free parking on premises, TV. Lacking these (any) could significantly impact bookings.
- Popular amenities like Heating, Smoke alarm, Kitchen are common but not universal. Offering these can provide a competitive edge.
- Warning: Wifi is not universally provided but is considered essential globally. Ensure reliable Wifi is offered.
Recommendations for Hosts
- Ensure your listing includes all essential amenities for Moelfryn: Free parking on premises, TV.
- Consider adding popular differentiators like Heating or Smoke alarm to increase appeal.
- Highlight unique or less common amenities you offer (e.g., hot tub, dedicated workspace, EV charger) in your listing description and photos.
- Regularly check competitor amenities in Moelfryn to stay competitive.
Moelfryn Airbnb Guest Demographics & Profile Analysis (2025)
Guest Profile Summary for Moelfryn
- The typical guest profile for Airbnb in Moelfryn consists of primarily domestic travelers (95%), often arriving from nearby England, typically belonging to the Post-2000s (Gen Z/Alpha) group (50%), primarily speaking English or Polish.
- Domestic travelers account for 95.4% of guests.
- Key international markets include United Kingdom (95.4%) and Australia (2.6%).
- Top languages spoken are English (72.1%) followed by Polish (7%).
- A significant demographic segment is the Post-2000s (Gen Z/Alpha) group, representing 50% of guests.
Recommendations for Hosts
- Target domestic marketing efforts towards travelers from England and Wales.
- Tailor amenities and listing descriptions to appeal to the dominant Post-2000s (Gen Z/Alpha) demographic (e.g., highlight fast WiFi, smart home features, local guides).
- Highlight unique local experiences or amenities relevant to the primary guest profile.
- Consider seasonal promotions aligned with peak travel times for key origin markets.
Nearby Short-Term Rental Market Comparison
How does the Moelfryn Airbnb market stack up against its neighbors? Compare key performance metrics like average monthly revenue, ADR, and occupancy rates in surrounding areas to understand the broader regional STR landscape.
| Market | Active Properties | Monthly Revenue | Daily Rate | Avg. Occupancy |
|---|---|---|---|---|
| Llanrhidian | 15 | $4,842 | $386.18 | 53% |
| Crai | 20 | $4,799 | $371.85 | 46% |
| Angle | 13 | $4,602 | $384.81 | 42% |
| Abbeycwmhir | 10 | $4,502 | $259.18 | 49% |
| Eglwys-bach | 16 | $4,413 | $315.23 | 52% |
| Ludchurch | 15 | $4,354 | $291.87 | 43% |
| Chirbury | 14 | $4,233 | $702.20 | 41% |
| Cwmann | 17 | $4,162 | $228.82 | 54% |
| Borth-y-Gêst | 18 | $4,139 | $240.51 | 55% |
| Redberth | 29 | $4,103 | $223.37 | 59% |