Moelfre Airbnb Market Analysis 2025: Short Term Rental Data & Vacation Rental Statistics in Wales, United Kingdom
Is Airbnb profitable in Moelfre in 2025? Explore comprehensive Airbnb analytics for Moelfre, Wales, United Kingdom to uncover income potential. This 2025 STR market report for Moelfre, based on AirROI data from April 2024 to March 2025, reveals key trends in the niche market of 31 active listings.
Whether you're considering an Airbnb investment in Moelfre, optimizing your existing vacation rental, or exploring rental arbitrage opportunities, understanding the Moelfre Airbnb data is crucial. Leveraging the low regulation environment is key to maximizing your short term rental income potential. Let's dive into the specifics.
Key Moelfre Airbnb Performance Metrics Overview
Monthly Airbnb Revenue Variations & Income Potential in Moelfre (2025)
Understanding the monthly revenue variations for Airbnb listings in Moelfre is key to maximizing your short term rental income potential. Seasonality significantly impacts earnings. Our analysis, based on data from the past 12 months, shows that the peak revenue month for STRs in Moelfre is typically August, while January often presents the lowest earnings, highlighting opportunities for strategic pricing adjustments during shoulder and low seasons. Explore the typical Airbnb income in Moelfre across different performance tiers:
- Best-in-class properties (Top 10%) achieve $6,236+ monthly, often utilizing dynamic pricing and superior guest experiences.
- Strong performing properties (Top 25%) earn $4,067 or more, indicating effective management and desirable locations/amenities.
- Typical properties (Median) generate around $2,846 per month, representing the average market performance.
- Entry-level properties (Bottom 25%) see earnings around $1,472, often with potential for optimization.
Average Monthly Airbnb Earnings Trend in Moelfre
Moelfre Airbnb Occupancy Rate Trends (2025)
Maximize your bookings by understanding the Moelfre STR occupancy trends. Seasonal demand shifts significantly influence how often properties are booked. Typically, Augustsees the highest demand (peak season occupancy), while January experiences the lowest (low season). Effective strategies, like adjusting minimum stays or offering promotions, can boost occupancy during slower periods. Here's how different property tiers perform in Moelfre:
- Best-in-class properties (Top 10%) achieve 83%+ occupancy, indicating high desirability and potentially optimized availability.
- Strong performing properties (Top 25%) maintain 67% or higher occupancy, suggesting good market fit and guest satisfaction.
- Typical properties (Median) have an occupancy rate around 44%.
- Entry-level properties (Bottom 25%) average 23% occupancy, potentially facing higher vacancy.
Average Monthly Occupancy Rate Trend in Moelfre
Average Daily Rate (ADR) Airbnb Trends in Moelfre (2025)
Effective short term rental pricing strategy in Moelfre involves understanding monthly ADR fluctuations. The Average Daily Rate (ADR) for Airbnb in Moelfre typically peaks in August and dips lowest during March. Leveraging Airbnb dynamic pricing tools or strategies based on this seasonality can significantly boost revenue. Here's a look at the typical nightly rates achieved:
- Best-in-class properties (Top 10%) command rates of $407+ per night, often due to premium features or locations.
- Strong performing properties (Top 25%) achieve nightly rates of $244 or more.
- Typical properties (Median) charge around $179 per night.
- Entry-level properties (Bottom 25%) earn around $134 per night.
Average Daily Rate (ADR) Trend by Month in Moelfre
Get Live Moelfre Market Intelligence 👇

Explore Real-time Analytics
Airbnb Seasonality Analysis & Trends in Moelfre (2025)
Peak Season (August, July, June)
- Revenue averages $4,783 per month
- Occupancy rates average 61.0%
- Daily rates average $253
Shoulder Season
- Revenue averages $3,157 per month
- Occupancy maintains around 45.6%
- Daily rates hold near $244
Low Season (January, February, March)
- Revenue drops to average $1,899 per month
- Occupancy decreases to average 33.0%
- Daily rates adjust to average $237
Seasonality Insights for Moelfre
- The Airbnb seasonality in Moelfre shows highly seasonal trends requiring careful strategy. While the sections above show seasonal averages, it's also insightful to look at the extremes:
- During the high season, the absolute peak month showcases Moelfre's highest earning potential, with monthly revenues capable of climbing to $5,856, occupancy reaching a high of 76.8%, and ADRs peaking at $258.
- Conversely, the slowest single month of the year, typically falling within the low season, marks the market's lowest point. In this month, revenue might dip to $1,645, occupancy could drop to 29.9%, and ADRs may adjust down to $235.
- Understanding both the seasonal averages and these monthly peaks and troughs in revenue, occupancy, and ADR is crucial for maximizing your Airbnb profit potential in Moelfre.
Seasonal Strategies for Maximizing Profit
- Peak Season: Maximize revenue through premium pricing and potentially longer minimum stays. Ensure high availability.
- Low Season: Offer competitive pricing, special promotions (e.g., extended stay discounts), and flexible cancellation policies. Target off-season travelers like remote workers or budget-conscious guests.
- Shoulder Seasons: Implement dynamic pricing that balances peak and low rates. Target weekend travelers or specific events. Offer slightly more flexible terms than peak season.
- Regularly analyze your own performance against these Moelfre seasonality benchmarks and adjust your pricing and availability strategy accordingly.
Best Areas for Airbnb Investment in Moelfre (2025)
Exploring the top neighborhoods for short-term rentals in Moelfre? This section highlights key areas, outlining why they are attractive for hosts and guests, along with notable local attractions. Consider these locations based on your target guest profile and investment strategy.
| Neighborhood / Area | Why Host Here? (Target Guests & Appeal) | Key Attractions & Landmarks |
|---|---|---|
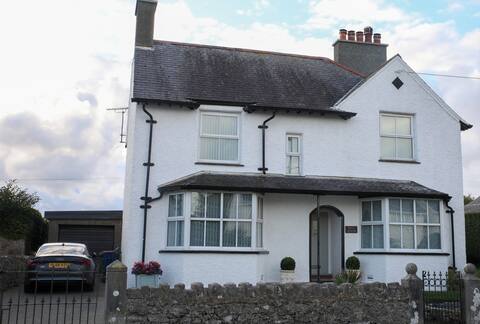
| Moelfre Beach | A picturesque beach area known for its stunning coastal views and opportunities for water activities. Perfect for families and beach lovers looking to relax by the sea. | Moelfre Beach, Lligwy Beach, Trwyn Du Lighthouse, Moelfre Lifeboat Station, The Old Post Office |
| Historical Village Center | The heart of Moelfre with charming local shops and eateries, ideal for tourists wanting to experience local culture and history. | Moelfre Heritage Centre, Local Pubs, Craft Shops, Coastal Walks, St. Gallgo's Church |
| Cemaes Bay | Nearby village known for its beautiful marina and sandy beaches, attracting visitors for sailing and beach outings. | Cemaes Beach, Cemaes Bay Harbour, The Breakwater, Porth Wen Brickworks, Coastal Path Walks |
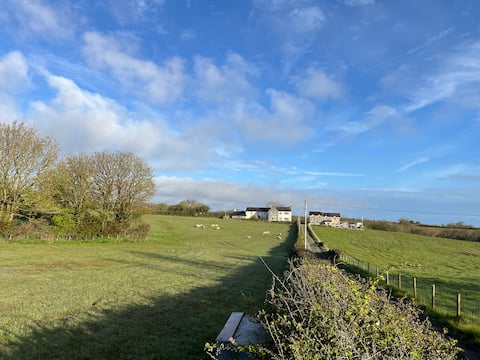
| Anglesey Coastal Path | Famous walking trail that showcases some of the best scenery in Anglesey, great for outdoor enthusiasts and nature lovers. | Anglesey Coastal Path, Plas Newydd, South Stack Lighthouse, RSPB Valley Wetlands, Beaumaris Castle |
| Lligwy | A quiet area with access to beautiful landscapes and beaches. Ideal for those wishing to immerse themselves in nature. | Lligwy Beach, Lligwy Burial Chamber, Coastal Walks, Nature Reserves, Nearby Campsites |
| Red Wharf Bay | Scenic bay area known for its sandy shores and excellent for water sports activities, popular with families and outdoor enthusiasts. | Red Wharf Bay Beach, Watersports, Yachts and Sailing, Local Cafes, Wildlife Watching |
| Dulas Bay | Lesser-known bay with serenity and beauty, perfect for tourists looking to escape the crowds and enjoy nature. | Dulas Bay Beach, Dulas River, Nature Walks, Quiet Villages, Rural Scenery |
| Bull Bay | Charming coastal village with golf courses and excellent fishing spots, appealing to both tourists and locals looking for leisure activities. | Bull Bay Golf Club, Fishing Spots, Sand Dunes, Coastal Views, Wildlife Watching |
Understanding Airbnb License Requirements & STR Laws in Moelfre (2025)
While Moelfre, Wales, United Kingdom currently shows low STR regulations, specific Airbnb license requirements might still exist or change. Always verify the latest short term rental regulations and Airbnb license requirements directly with local government authorities for Moelfre to ensure full compliance before hosting.
(Source: AirROI data, 2025, finding no licensed listings among those analyzed)
Top Performing Airbnb Properties in Moelfre (2025)
Benchmark your potential! Explore examples of top-performing Airbnb properties in Moelfrebased on Trailing Twelve Month (TTM) revenue. Analyze their characteristics, revenue, occupancy rate, and ADR to understand what drives success in this market.
Beautifully renovated four bedroom house
Entire Place • 4 bedrooms
Ty Dderw Anglesey.
Entire Place • 11 bedrooms

Cosy 3 Bedroom Cottage with stunning Sea View
Entire Place • 3 bedrooms
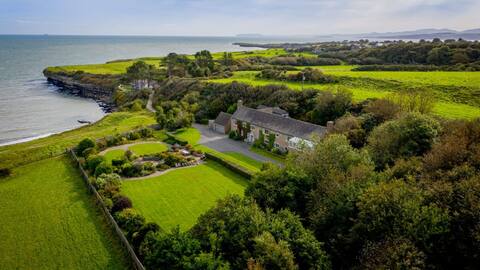
Cae'r Borth-bolthole for 14 with private beach
Entire Place • 7 bedrooms

Heligog@Deanfield Sea view appt sleeps 4 adults
Entire Place • 2 bedrooms
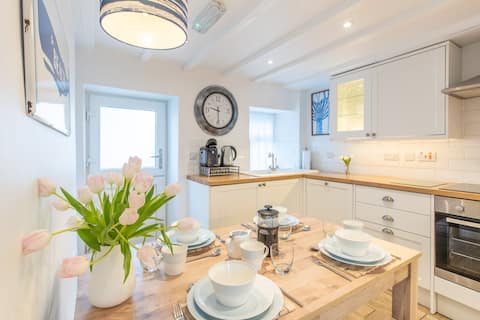
The Cottage @ Arlanfor, Moelfre, Anglesey
Entire Place • 2 bedrooms
Note: Performance varies based on location, size, amenities, seasonality, and management quality. Data reflects the past 12 months.
Top Performing Airbnb Hosts in Moelfre (2025)
Learn from the best! This table showcases top-performing Airbnb hosts in Moelfre based on the number of properties managed and estimated total revenue over the past year. Analyze their scale and performance metrics.
| Host Name | Properties | Grossing Revenue | Stay Reviews | Avg Rating |
|---|---|---|---|---|
| Julia & Mike | 3 | $97,153 | 158 | 4.93/5.0 |
| Sarah | 1 | $97,053 | 43 | 5.00/5.0 |
| Laura | 2 | $88,088 | 118 | 4.91/5.0 |
| Host #109767164 | 1 | $73,111 | 0 | 0.00/5.0 |
| Boltholes And Hideaways | 2 | $68,260 | 13 | 4.94/5.0 |
| John-Pass The Keys | 1 | $50,829 | 74 | 4.73/5.0 |
| Debbie | 1 | $41,427 | 197 | 4.98/5.0 |
| Host #241888732 | 1 | $39,851 | 48 | 4.73/5.0 |
| Sarah | 1 | $39,769 | 21 | 4.95/5.0 |
| Paul | 1 | $36,768 | 8 | 4.25/5.0 |
Analyzing the strategies of top hosts, such as their property selection, pricing, and guest communication, can offer valuable lessons for optimizing your own Airbnb operations in Moelfre.
Dive Deeper: Advanced Moelfre STR Market Data (2025)
Ready to unlock more insights? AirROI provides access to advanced metrics and comprehensive Airbnb data for Moelfre. Explore detailed analytics beyond this report to refine your investment strategy, optimize pricing, and maximize your vacation rental profits.
Explore Advanced MetricsMoelfre Short-Term Rental Market Composition (2025): Property & Room Types
Room Type Distribution
Property Type Distribution
Market Composition Insights for Moelfre
- The Moelfre Airbnb market composition is heavily skewed towards Entire Home/Apt listings, which make up 96.8% of the 31 active rentals. This indicates strong guest preference for privacy and space.
- Looking at the property type distribution in Moelfre, House properties are the most common (71%), reflecting the local real estate landscape.
- Houses represent a significant 71% portion, catering likely to families or larger groups.
Moelfre Airbnb Room Capacity Analysis (2025): Bedroom Distribution
Distribution of Listings by Number of Bedrooms
Room Capacity Insights for Moelfre
- The dominant room capacity in Moelfre is 2 bedrooms listings, making up 41.9% of the market. This suggests a strong demand for properties suitable for couples or solo travelers.
- Together, 2 bedrooms and 3 bedrooms properties represent 67.7% of the active Airbnb listings in Moelfre, indicating a high concentration in these sizes.
- A significant 45.2% of listings offer 3+ bedrooms, catering to larger groups and families seeking more space in Moelfre.
Moelfre Vacation Rental Guest Capacity Trends (2025)
Distribution of Listings by Guest Capacity
Guest Capacity Insights for Moelfre
- The most common guest capacity trend in Moelfre vacation rentals is listings accommodating 4 guests (32.3%). This suggests the primary traveler segment is likely small families or groups.
- Properties designed for 4 guests and 6 guests dominate the Moelfre STR market, accounting for 54.9% of listings.
- 48.5% of properties accommodate 6+ guests, serving the market segment for larger families or group travel in Moelfre.
- On average, properties in Moelfre are equipped to host 5.2 guests.
Moelfre Airbnb Booking Patterns (2025): Available vs. Booked Days
Available Days Distribution
Booked Days Distribution
Booking Pattern Insights for Moelfre
- The most common availability pattern in Moelfre falls within the 271-366 days range, representing 38.7% of listings. This suggests many properties have significant open periods on their calendars.
- Approximately 64.5% of listings show high availability (181+ days open annually), indicating potential for increased bookings or specific owner usage patterns.
- For booked days, the 91-180 days range is most frequent in Moelfre (32.3%), reflecting common guest stay durations or potential owner blocking patterns.
- A notable 35.5% of properties secure long booking periods (181+ days booked per year), highlighting successful long-term rental strategies or significant owner usage.
Moelfre Airbnb Minimum Stay Requirements Analysis
Distribution of Listings by Minimum Night Requirement
1 Night
2 listings
6.9% of total
2 Nights
5 listings
17.2% of total
3 Nights
9 listings
31% of total
4-6 Nights
4 listings
13.8% of total
7-29 Nights
3 listings
10.3% of total
30+ Nights
6 listings
20.7% of total
Key Insights
- The most prevalent minimum stay requirement in Moelfre is 3 Nights, adopted by 31% of listings. This highlights the market's preference for longer commitments.
- A significant segment (20.7%) caters to monthly stays (30+ nights) in Moelfre, pointing to opportunities in the extended-stay market.
Recommendations
- Align with the market by considering a 3 Nights minimum stay, as 31% of Moelfre hosts use this setting.
- If feasible, allowing 1-night stays, especially midweek or during low season, could capture last-minute bookings, as only 6.9% currently do.
- Explore offering discounts for stays of 30+ nights to attract the 20.7% of the market seeking extended stays.
- Adjust minimum nights based on seasonality – potentially shorter during low season and longer during peak demand periods in Moelfre.
Moelfre Airbnb Cancellation Policy Trends Analysis (2025)
Super Strict 60 Days
3 listings
10.7% of total
Flexible
2 listings
7.1% of total
Moderate
4 listings
14.3% of total
Firm
8 listings
28.6% of total
Strict
11 listings
39.3% of total
Cancellation Policy Insights for Moelfre
- The prevailing Airbnb cancellation policy trend in Moelfre is Strict, used by 39.3% of listings.
- A majority (67.9%) of hosts in Moelfre utilize Firm or Strict policies, indicating a market where hosts prioritize booking security.
Recommendations for Hosts
- Consider adopting a Strict policy to align with the 39.3% market standard in Moelfre.
- With 39.3% using Strict terms, this is a viable option in Moelfre, particularly for high-value properties or during peak demand periods.
- Regularly review your cancellation policy against competitors and market demand shifts in Moelfre.
Moelfre STR Booking Lead Time Analysis (2025)
Average Booking Lead Time by Month
Booking Lead Time Insights for Moelfre
- The overall average booking lead time for vacation rentals in Moelfre is 65 days.
- Guests book furthest in advance for stays during August (average 93 days), likely coinciding with peak travel demand or local events.
- The shortest booking windows occur for stays in March (average 54 days), indicating more last-minute travel plans during this time.
- Seasonally, Summer (90 days avg.) sees the longest lead times, while Winter (63 days avg.) has the shortest, reflecting typical travel planning cycles.
Recommendations for Hosts
- Use the overall average lead time (65 days) as a baseline for your pricing and availability strategy in Moelfre.
- For August stays, consider implementing length-of-stay discounts or slightly higher rates for bookings made less than 93 days out to capitalize on advance planning.
- Target marketing efforts for the Summer season well in advance (at least 90 days) to capture early planners.
- Monitor your own booking lead times against these Moelfre averages to identify opportunities for dynamic pricing adjustments.
Popular & Essential Airbnb Amenities in Moelfre (2025)
Amenity Prevalence
Amenity Insights for Moelfre
- Essential amenities in Moelfre that guests expect include: Heating, Smoke alarm, TV, Kitchen, Free parking on premises. Lacking these (any) could significantly impact bookings.
- Popular amenities like Hot water, Refrigerator, Dishes and silverware are common but not universal. Offering these can provide a competitive edge.
- Warning: Wifi is not universally provided but is considered essential globally. Ensure reliable Wifi is offered.
Recommendations for Hosts
- Ensure your listing includes all essential amenities for Moelfre: Heating, Smoke alarm, TV, Kitchen, Free parking on premises.
- Prioritize adding missing essentials: Free parking on premises.
- Consider adding popular differentiators like Hot water or Refrigerator to increase appeal.
- Highlight unique or less common amenities you offer (e.g., hot tub, dedicated workspace, EV charger) in your listing description and photos.
- Regularly check competitor amenities in Moelfre to stay competitive.
Moelfre Airbnb Guest Demographics & Profile Analysis (2025)
Guest Profile Summary for Moelfre
- The typical guest profile for Airbnb in Moelfre consists of primarily domestic travelers (96%), often arriving from nearby England, typically belonging to the Post-2000s (Gen Z/Alpha) group (50%), primarily speaking English or French.
- Domestic travelers account for 96.3% of guests.
- Key international markets include United Kingdom (96.3%) and Germany (1.2%).
- Top languages spoken are English (71.4%) followed by French (9.5%).
- A significant demographic segment is the Post-2000s (Gen Z/Alpha) group, representing 50% of guests.
Recommendations for Hosts
- Target domestic marketing efforts towards travelers from England and Manchester.
- Tailor amenities and listing descriptions to appeal to the dominant Post-2000s (Gen Z/Alpha) demographic (e.g., highlight fast WiFi, smart home features, local guides).
- Highlight unique local experiences or amenities relevant to the primary guest profile.
- Consider seasonal promotions aligned with peak travel times for key origin markets.
Nearby Short-Term Rental Market Comparison
How does the Moelfre Airbnb market stack up against its neighbors? Compare key performance metrics like average monthly revenue, ADR, and occupancy rates in surrounding areas to understand the broader regional STR landscape.
| Market | Active Properties | Monthly Revenue | Daily Rate | Avg. Occupancy |
|---|---|---|---|---|
| Abbeycwmhir | 10 | $4,502 | $259.19 | 49% |
| Eglwys-bach | 16 | $4,413 | $315.23 | 52% |
| Waverton | 16 | $4,358 | $444.20 | 33% |
| Chirbury | 14 | $4,233 | $702.20 | 41% |
| Seascale | 11 | $4,165 | $354.23 | 40% |
| Cwmann | 17 | $4,162 | $228.82 | 54% |
| Borth-y-Gêst | 18 | $4,139 | $240.51 | 55% |
| Valley | 18 | $4,042 | $254.80 | 44% |
| Braichmelyn | 41 | $3,894 | $246.43 | 54% |
| Rhoscolyn | 17 | $3,799 | $370.12 | 43% |