Llangennith Airbnb Market Analysis 2025: Short Term Rental Data & Vacation Rental Statistics in Wales, United Kingdom
Is Airbnb profitable in Llangennith in 2025? Explore comprehensive Airbnb analytics for Llangennith, Wales, United Kingdom to uncover income potential. This 2025 STR market report for Llangennith, based on AirROI data from April 2024 to March 2025, reveals key trends in the niche market of 32 active listings.
Whether you're considering an Airbnb investment in Llangennith, optimizing your existing vacation rental, or exploring rental arbitrage opportunities, understanding the Llangennith Airbnb data is crucial. Leveraging the low regulation environment is key to maximizing your short term rental income potential. Let's dive into the specifics.
Key Llangennith Airbnb Performance Metrics Overview
Monthly Airbnb Revenue Variations & Income Potential in Llangennith (2025)
Understanding the monthly revenue variations for Airbnb listings in Llangennith is key to maximizing your short term rental income potential. Seasonality significantly impacts earnings. Our analysis, based on data from the past 12 months, shows that the peak revenue month for STRs in Llangennith is typically August, while March often presents the lowest earnings, highlighting opportunities for strategic pricing adjustments during shoulder and low seasons. Explore the typical Airbnb income in Llangennith across different performance tiers:
- Best-in-class properties (Top 10%) achieve $7,396+ monthly, often utilizing dynamic pricing and superior guest experiences.
- Strong performing properties (Top 25%) earn $5,424 or more, indicating effective management and desirable locations/amenities.
- Typical properties (Median) generate around $3,591 per month, representing the average market performance.
- Entry-level properties (Bottom 25%) see earnings around $2,179, often with potential for optimization.
Average Monthly Airbnb Earnings Trend in Llangennith
Llangennith Airbnb Occupancy Rate Trends (2025)
Maximize your bookings by understanding the Llangennith STR occupancy trends. Seasonal demand shifts significantly influence how often properties are booked. Typically, Augustsees the highest demand (peak season occupancy), while March experiences the lowest (low season). Effective strategies, like adjusting minimum stays or offering promotions, can boost occupancy during slower periods. Here's how different property tiers perform in Llangennith:
- Best-in-class properties (Top 10%) achieve 86%+ occupancy, indicating high desirability and potentially optimized availability.
- Strong performing properties (Top 25%) maintain 68% or higher occupancy, suggesting good market fit and guest satisfaction.
- Typical properties (Median) have an occupancy rate around 49%.
- Entry-level properties (Bottom 25%) average 31% occupancy, potentially facing higher vacancy.
Average Monthly Occupancy Rate Trend in Llangennith
Average Daily Rate (ADR) Airbnb Trends in Llangennith (2025)
Effective short term rental pricing strategy in Llangennith involves understanding monthly ADR fluctuations. The Average Daily Rate (ADR) for Airbnb in Llangennith typically peaks in July and dips lowest during November. Leveraging Airbnb dynamic pricing tools or strategies based on this seasonality can significantly boost revenue. Here's a look at the typical nightly rates achieved:
- Best-in-class properties (Top 10%) command rates of $366+ per night, often due to premium features or locations.
- Strong performing properties (Top 25%) achieve nightly rates of $296 or more.
- Typical properties (Median) charge around $219 per night.
- Entry-level properties (Bottom 25%) earn around $159 per night.
Average Daily Rate (ADR) Trend by Month in Llangennith
Get Live Llangennith Market Intelligence 👇

Explore Real-time Analytics
Airbnb Seasonality Analysis & Trends in Llangennith (2025)
Peak Season (August, July, May)
- Revenue averages $5,841 per month
- Occupancy rates average 67.1%
- Daily rates average $258
Shoulder Season
- Revenue averages $4,058 per month
- Occupancy maintains around 49.2%
- Daily rates hold near $244
Low Season (January, February, March)
- Revenue drops to average $2,348 per month
- Occupancy decreases to average 34.9%
- Daily rates adjust to average $240
Seasonality Insights for Llangennith
- The Airbnb seasonality in Llangennith shows highly seasonal trends requiring careful strategy. While the sections above show seasonal averages, it's also insightful to look at the extremes:
- During the high season, the absolute peak month showcases Llangennith's highest earning potential, with monthly revenues capable of climbing to $6,584, occupancy reaching a high of 78.8%, and ADRs peaking at $264.
- Conversely, the slowest single month of the year, typically falling within the low season, marks the market's lowest point. In this month, revenue might dip to $1,911, occupancy could drop to 31.0%, and ADRs may adjust down to $233.
- Understanding both the seasonal averages and these monthly peaks and troughs in revenue, occupancy, and ADR is crucial for maximizing your Airbnb profit potential in Llangennith.
Seasonal Strategies for Maximizing Profit
- Peak Season: Maximize revenue through premium pricing and potentially longer minimum stays. Ensure high availability.
- Low Season: Offer competitive pricing, special promotions (e.g., extended stay discounts), and flexible cancellation policies. Target off-season travelers like remote workers or budget-conscious guests.
- Shoulder Seasons: Implement dynamic pricing that balances peak and low rates. Target weekend travelers or specific events. Offer slightly more flexible terms than peak season.
- Regularly analyze your own performance against these Llangennith seasonality benchmarks and adjust your pricing and availability strategy accordingly.
Best Areas for Airbnb Investment in Llangennith (2025)
Exploring the top neighborhoods for short-term rentals in Llangennith? This section highlights key areas, outlining why they are attractive for hosts and guests, along with notable local attractions. Consider these locations based on your target guest profile and investment strategy.
| Neighborhood / Area | Why Host Here? (Target Guests & Appeal) | Key Attractions & Landmarks |
|---|---|---|
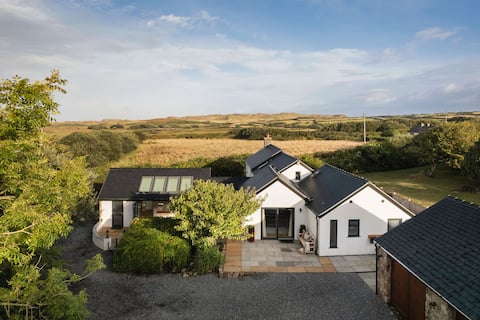
| Llangennith Beach | A stunning location for surfers and beachgoers, Llangennith Beach is known for its golden sands and excellent waves, making it a prime spot for vacationers and outdoor enthusiasts. | Llangennith Beach, Rhossili Bay, Gower Peninsula, Worm's Head, Gower Heritage Centre |
| Rhossili | Rhossili is a picturesque village with one of the most beautiful beaches in the UK. It attracts a large number of visitors for its breathtaking views and hiking opportunities. | Rhossili Bay, Worm's Head, Rhossili Downs, National Trust Visitor Centre, The Old Rectory |
| Gower Peninsula | The Gower Peninsula is an Area of Outstanding Natural Beauty, popular for its rugged cliffs, sandy beaches, and walking trails, making it ideal for nature lovers and explorers. | Three Cliffs Bay, Oxwich Bay, Pobbles Bay, Gower Coast Path, Mumbles |
| Cwmdonkin Park | Located nearby in Swansea, this charming park is ideal for families and those looking to enjoy outdoor activities, which makes it appealing to Airbnb guests. | Cwmdonkin Park, Swansea Bay, Swansea Marina, The Waterfront Museum, Clyne Gardens |
| Mumbles | A vibrant seaside village close to Llangennith, Mumbles is known for its scenic promenade, cafes, and local shops, attracting both tourists and weekend visitors. | Mumbles Pier, Oystermouth Castle, The Mumbles Lighthouse, Mumbles Promenade, Gingerbread House |
| Swansea City Centre | The heart of Swansea offers cultural attractions, shopping, and entertainment, catering to business travelers and tourists looking for urban experiences. | Swansea Market, Swansea Grand Theatre, Dylan Thomas Centre, Swansea Arena, LC Swansea |
| Port Eynon | A popular destination with families, Port Eynon provides a lovely beach, watersports, and a charming village atmosphere, making it ideal for hosting relaxed getaways. | Port Eynon Beach, Swansea Bay Coastline, Fisherman's Wharf, Paviland Cave, Port Eynon Point |
| Oxwich | Known for its stunning beach and rich nature reserves, Oxwich is perfect for visitors looking to unwind in a tranquil setting while enjoying outdoor activities. | Oxwich Beach, Oxwich Castle, Gower National Park, The Gower Coast Path, Gower Activity Centre |
Understanding Airbnb License Requirements & STR Laws in Llangennith (2025)
While Llangennith, Wales, United Kingdom currently shows low STR regulations, specific Airbnb license requirements might still exist or change. Always verify the latest short term rental regulations and Airbnb license requirements directly with local government authorities for Llangennith to ensure full compliance before hosting.
(Source: AirROI data, 2025, finding no licensed listings among those analyzed)
Top Performing Airbnb Properties in Llangennith (2025)
Benchmark your potential! Explore examples of top-performing Airbnb properties in Llangennithbased on Trailing Twelve Month (TTM) revenue. Analyze their characteristics, revenue, occupancy rate, and ADR to understand what drives success in this market.
Lower Mill - 3 Bedroom - 5* Retreat - Llangennith
Entire Place • 3 bedrooms
Stormy Castle - 6 Bedroom Sleeps 14 - Llangennith
Entire Place • 6 bedrooms
Mallard
Entire Place • 2 bedrooms
Dollars Cottage - 4 Bedroom Cottage - Llangennith
Entire Place • 4 bedrooms
Hir Horizon, a converted barn with beautiful views
Entire Place • 3 bedrooms
Teal
Entire Place • 1 bedroom
Note: Performance varies based on location, size, amenities, seasonality, and management quality. Data reflects the past 12 months.
Top Performing Airbnb Hosts in Llangennith (2025)
Learn from the best! This table showcases top-performing Airbnb hosts in Llangennith based on the number of properties managed and estimated total revenue over the past year. Analyze their scale and performance metrics.
| Host Name | Properties | Grossing Revenue | Stay Reviews | Avg Rating |
|---|---|---|---|---|
| Joseph | 6 | $256,987 | 110 | 4.76/5.0 |
| Cottages | 4 | $193,110 | 54 | 3.70/5.0 |
| Helen | 1 | $125,273 | 16 | 5.00/5.0 |
| Pippa | 4 | $110,663 | 264 | 4.90/5.0 |
| Jo | 2 | $77,827 | 171 | 4.81/5.0 |
| Miriam | 1 | $71,221 | 34 | 5.00/5.0 |
| Best Of Wales | 1 | $51,405 | 9 | 4.78/5.0 |
| Derek | 2 | $47,265 | 232 | 4.96/5.0 |
| Rhian | 1 | $45,393 | 59 | 4.88/5.0 |
| Adam | 1 | $44,735 | 81 | 4.85/5.0 |
Analyzing the strategies of top hosts, such as their property selection, pricing, and guest communication, can offer valuable lessons for optimizing your own Airbnb operations in Llangennith.
Dive Deeper: Advanced Llangennith STR Market Data (2025)
Ready to unlock more insights? AirROI provides access to advanced metrics and comprehensive Airbnb data for Llangennith. Explore detailed analytics beyond this report to refine your investment strategy, optimize pricing, and maximize your vacation rental profits.
Explore Advanced MetricsLlangennith Short-Term Rental Market Composition (2025): Property & Room Types
Room Type Distribution
Property Type Distribution
Market Composition Insights for Llangennith
- The Llangennith Airbnb market composition is heavily skewed towards Entire Home/Apt listings, which make up 93.8% of the 32 active rentals. This indicates strong guest preference for privacy and space.
- Looking at the property type distribution in Llangennith, House properties are the most common (65.6%), reflecting the local real estate landscape.
- Houses represent a significant 65.6% portion, catering likely to families or larger groups.
- The presence of 6.3% Hotel/Boutique listings indicates integration with traditional hospitality.
- Smaller segments like unique stays (combined 3.1%) offer potential for unique stay experiences.
Llangennith Airbnb Room Capacity Analysis (2025): Bedroom Distribution
Distribution of Listings by Number of Bedrooms
Room Capacity Insights for Llangennith
- The dominant room capacity in Llangennith is 3 bedrooms listings, making up 31.3% of the market. This suggests a strong demand for properties suitable for families or small groups.
- Together, 3 bedrooms and 1 bedroom properties represent 59.4% of the active Airbnb listings in Llangennith, indicating a high concentration in these sizes.
- A significant 43.9% of listings offer 3+ bedrooms, catering to larger groups and families seeking more space in Llangennith.
Llangennith Vacation Rental Guest Capacity Trends (2025)
Distribution of Listings by Guest Capacity
Guest Capacity Insights for Llangennith
- The most common guest capacity trend in Llangennith vacation rentals is listings accommodating 4 guests (25%). This suggests the primary traveler segment is likely small families or groups.
- Properties designed for 4 guests and 6 guests dominate the Llangennith STR market, accounting for 46.9% of listings.
- 40.7% of properties accommodate 6+ guests, serving the market segment for larger families or group travel in Llangennith.
- On average, properties in Llangennith are equipped to host 4.7 guests.
Llangennith Airbnb Booking Patterns (2025): Available vs. Booked Days
Available Days Distribution
Booked Days Distribution
Booking Pattern Insights for Llangennith
- The most common availability pattern in Llangennith falls within the 181-270 days range, representing 37.5% of listings. This suggests many properties have significant open periods on their calendars.
- Approximately 59.4% of listings show high availability (181+ days open annually), indicating potential for increased bookings or specific owner usage patterns.
- For booked days, the 91-180 days range is most frequent in Llangennith (37.5%), reflecting common guest stay durations or potential owner blocking patterns.
- A notable 40.6% of properties secure long booking periods (181+ days booked per year), highlighting successful long-term rental strategies or significant owner usage.
Llangennith Airbnb Minimum Stay Requirements Analysis
Distribution of Listings by Minimum Night Requirement
1 Night
3 listings
9.7% of total
2 Nights
10 listings
32.3% of total
3 Nights
7 listings
22.6% of total
4-6 Nights
1 listings
3.2% of total
7-29 Nights
1 listings
3.2% of total
30+ Nights
9 listings
29% of total
Key Insights
- The most prevalent minimum stay requirement in Llangennith is 2 Nights, adopted by 32.3% of listings. This highlights the market's preference for shorter, flexible bookings.
- A significant segment (29%) caters to monthly stays (30+ nights) in Llangennith, pointing to opportunities in the extended-stay market.
Recommendations
- Align with the market by considering a 2 Nights minimum stay, as 32.3% of Llangennith hosts use this setting.
- If feasible, allowing 1-night stays, especially midweek or during low season, could capture last-minute bookings, as only 9.7% currently do.
- A 2-night minimum appears standard (32.3%). Consider this for weekends or peak periods.
- Explore offering discounts for stays of 30+ nights to attract the 29% of the market seeking extended stays.
- Adjust minimum nights based on seasonality – potentially shorter during low season and longer during peak demand periods in Llangennith.
Llangennith Airbnb Cancellation Policy Trends Analysis (2025)
Super Strict 60 Days
5 listings
17.2% of total
Super Strict 30 Days
1 listings
3.4% of total
Moderate
4 listings
13.8% of total
Firm
3 listings
10.3% of total
Strict
16 listings
55.2% of total
Cancellation Policy Insights for Llangennith
- The prevailing Airbnb cancellation policy trend in Llangennith is Strict, used by 55.2% of listings.
- A majority (65.5%) of hosts in Llangennith utilize Firm or Strict policies, indicating a market where hosts prioritize booking security.
Recommendations for Hosts
- Consider adopting a Strict policy to align with the 55.2% market standard in Llangennith.
- With 55.2% using Strict terms, this is a viable option in Llangennith, particularly for high-value properties or during peak demand periods.
- Regularly review your cancellation policy against competitors and market demand shifts in Llangennith.
Llangennith STR Booking Lead Time Analysis (2025)
Average Booking Lead Time by Month
Booking Lead Time Insights for Llangennith
- The overall average booking lead time for vacation rentals in Llangennith is 62 days.
- Guests book furthest in advance for stays during July (average 98 days), likely coinciding with peak travel demand or local events.
- The shortest booking windows occur for stays in February (average 38 days), indicating more last-minute travel plans during this time.
- Seasonally, Summer (85 days avg.) sees the longest lead times, while Winter (49 days avg.) has the shortest, reflecting typical travel planning cycles.
Recommendations for Hosts
- Use the overall average lead time (62 days) as a baseline for your pricing and availability strategy in Llangennith.
- For July stays, consider implementing length-of-stay discounts or slightly higher rates for bookings made less than 98 days out to capitalize on advance planning.
- Target marketing efforts for the Summer season well in advance (at least 85 days) to capture early planners.
- Monitor your own booking lead times against these Llangennith averages to identify opportunities for dynamic pricing adjustments.
Popular & Essential Airbnb Amenities in Llangennith (2025)
Amenity Prevalence
Amenity Insights for Llangennith
- Essential amenities in Llangennith that guests expect include: Heating. Lacking these (this) could significantly impact bookings.
- Popular amenities like Kitchen, Smoke alarm, Free parking on premises are common but not universal. Offering these can provide a competitive edge.
- Warning: Wifi is not universally provided but is considered essential globally. Ensure reliable Wifi is offered.
Recommendations for Hosts
- Ensure your listing includes all essential amenities for Llangennith: Heating.
- Consider adding popular differentiators like Kitchen or Smoke alarm to increase appeal.
- Highlight unique or less common amenities you offer (e.g., hot tub, dedicated workspace, EV charger) in your listing description and photos.
- Regularly check competitor amenities in Llangennith to stay competitive.
Llangennith Airbnb Guest Demographics & Profile Analysis (2025)
Guest Profile Summary for Llangennith
- The typical guest profile for Airbnb in Llangennith consists of primarily domestic travelers (93%), often arriving from nearby England, typically belonging to the Post-2000s (Gen Z/Alpha) group (50%), primarily speaking English or French.
- Domestic travelers account for 92.6% of guests.
- Key international markets include United Kingdom (92.6%) and United States (3.2%).
- Top languages spoken are English (65.8%) followed by French (11.1%).
- A significant demographic segment is the Post-2000s (Gen Z/Alpha) group, representing 50% of guests.
Recommendations for Hosts
- Target domestic marketing efforts towards travelers from England and London.
- Tailor amenities and listing descriptions to appeal to the dominant Post-2000s (Gen Z/Alpha) demographic (e.g., highlight fast WiFi, smart home features, local guides).
- Highlight unique local experiences or amenities relevant to the primary guest profile.
- Consider seasonal promotions aligned with peak travel times for key origin markets.
Nearby Short-Term Rental Market Comparison
How does the Llangennith Airbnb market stack up against its neighbors? Compare key performance metrics like average monthly revenue, ADR, and occupancy rates in surrounding areas to understand the broader regional STR landscape.
| Market | Active Properties | Monthly Revenue | Daily Rate | Avg. Occupancy |
|---|---|---|---|---|
| Llanrhidian | 15 | $4,842 | $386.18 | 53% |
| Crai | 20 | $4,799 | $371.85 | 46% |
| Trenance | 19 | $4,795 | $428.63 | 43% |
| Angle | 13 | $4,602 | $384.81 | 42% |
| Abbeycwmhir | 10 | $4,502 | $259.18 | 49% |
| Ludchurch | 15 | $4,354 | $291.87 | 43% |
| Chirbury | 14 | $4,233 | $702.20 | 41% |
| Cwmann | 17 | $4,162 | $228.82 | 54% |
| Borth-y-Gêst | 18 | $4,139 | $240.51 | 55% |
| Redberth | 29 | $4,103 | $223.37 | 59% |