Llandrindod Wells Airbnb Market Analysis 2025: Short Term Rental Data & Vacation Rental Statistics in Wales, United Kingdom
Is Airbnb profitable in Llandrindod Wells in 2025? Explore comprehensive Airbnb analytics for Llandrindod Wells, Wales, United Kingdom to uncover income potential. This 2025 STR market report for Llandrindod Wells, based on AirROI data from April 2024 to March 2025, reveals key trends in the niche market of 20 active listings.
Whether you're considering an Airbnb investment in Llandrindod Wells, optimizing your existing vacation rental, or exploring rental arbitrage opportunities, understanding the Llandrindod Wells Airbnb data is crucial. Leveraging the low regulation environment is key to maximizing your short term rental income potential. Let's dive into the specifics.
Key Llandrindod Wells Airbnb Performance Metrics Overview
Monthly Airbnb Revenue Variations & Income Potential in Llandrindod Wells (2025)
Understanding the monthly revenue variations for Airbnb listings in Llandrindod Wells is key to maximizing your short term rental income potential. Seasonality significantly impacts earnings. Our analysis, based on data from the past 12 months, shows that the peak revenue month for STRs in Llandrindod Wells is typically December, while June often presents the lowest earnings, highlighting opportunities for strategic pricing adjustments during shoulder and low seasons. Explore the typical Airbnb income in Llandrindod Wells across different performance tiers:
- Best-in-class properties (Top 10%) achieve $6,543+ monthly, often utilizing dynamic pricing and superior guest experiences.
- Strong performing properties (Top 25%) earn $2,296 or more, indicating effective management and desirable locations/amenities.
- Typical properties (Median) generate around $1,279 per month, representing the average market performance.
- Entry-level properties (Bottom 25%) see earnings around $605, often with potential for optimization.
Average Monthly Airbnb Earnings Trend in Llandrindod Wells
Llandrindod Wells Airbnb Occupancy Rate Trends (2025)
Maximize your bookings by understanding the Llandrindod Wells STR occupancy trends. Seasonal demand shifts significantly influence how often properties are booked. Typically, Augustsees the highest demand (peak season occupancy), while April experiences the lowest (low season). Effective strategies, like adjusting minimum stays or offering promotions, can boost occupancy during slower periods. Here's how different property tiers perform in Llandrindod Wells:
- Best-in-class properties (Top 10%) achieve 82%+ occupancy, indicating high desirability and potentially optimized availability.
- Strong performing properties (Top 25%) maintain 67% or higher occupancy, suggesting good market fit and guest satisfaction.
- Typical properties (Median) have an occupancy rate around 45%.
- Entry-level properties (Bottom 25%) average 21% occupancy, potentially facing higher vacancy.
Average Monthly Occupancy Rate Trend in Llandrindod Wells
Average Daily Rate (ADR) Airbnb Trends in Llandrindod Wells (2025)
Effective short term rental pricing strategy in Llandrindod Wells involves understanding monthly ADR fluctuations. The Average Daily Rate (ADR) for Airbnb in Llandrindod Wells typically peaks in December and dips lowest during October. Leveraging Airbnb dynamic pricing tools or strategies based on this seasonality can significantly boost revenue. Here's a look at the typical nightly rates achieved:
- Best-in-class properties (Top 10%) command rates of $280+ per night, often due to premium features or locations.
- Strong performing properties (Top 25%) achieve nightly rates of $150 or more.
- Typical properties (Median) charge around $88 per night.
- Entry-level properties (Bottom 25%) earn around $65 per night.
Average Daily Rate (ADR) Trend by Month in Llandrindod Wells
Get Live Llandrindod Wells Market Intelligence 👇

Explore Real-time Analytics
Airbnb Seasonality Analysis & Trends in Llandrindod Wells (2025)
Peak Season (December, August, March)
- Revenue averages $2,988 per month
- Occupancy rates average 53.4%
- Daily rates average $138
Shoulder Season
- Revenue averages $2,378 per month
- Occupancy maintains around 47.0%
- Daily rates hold near $133
Low Season (April, June, October)
- Revenue drops to average $2,004 per month
- Occupancy decreases to average 35.5%
- Daily rates adjust to average $122
Seasonality Insights for Llandrindod Wells
- The Airbnb seasonality in Llandrindod Wells shows moderate seasonality with distinct peak and low periods. While the sections above show seasonal averages, it's also insightful to look at the extremes:
- During the high season, the absolute peak month showcases Llandrindod Wells's highest earning potential, with monthly revenues capable of climbing to $3,223, occupancy reaching a high of 63.4%, and ADRs peaking at $145.
- Conversely, the slowest single month of the year, typically falling within the low season, marks the market's lowest point. In this month, revenue might dip to $1,949, occupancy could drop to 28.7%, and ADRs may adjust down to $119.
- Understanding both the seasonal averages and these monthly peaks and troughs in revenue, occupancy, and ADR is crucial for maximizing your Airbnb profit potential in Llandrindod Wells.
Seasonal Strategies for Maximizing Profit
- Peak Season: Maximize revenue through premium pricing and potentially longer minimum stays. Ensure high availability.
- Low Season: Offer competitive pricing, special promotions (e.g., extended stay discounts), and flexible cancellation policies. Target off-season travelers like remote workers or budget-conscious guests.
- Shoulder Seasons: Implement dynamic pricing that balances peak and low rates. Target weekend travelers or specific events. Offer slightly more flexible terms than peak season.
- Regularly analyze your own performance against these Llandrindod Wells seasonality benchmarks and adjust your pricing and availability strategy accordingly.
Best Areas for Airbnb Investment in Llandrindod Wells (2025)
Exploring the top neighborhoods for short-term rentals in Llandrindod Wells? This section highlights key areas, outlining why they are attractive for hosts and guests, along with notable local attractions. Consider these locations based on your target guest profile and investment strategy.
| Neighborhood / Area | Why Host Here? (Target Guests & Appeal) | Key Attractions & Landmarks |
|---|---|---|
| Llandrindod Wells Town Centre | The heart of Llandrindod Wells, known for its historic buildings and proximity to local amenities. Ideal for tourists wanting to explore the charm of this spa town. | Llandrindod Wells Lake, Radnorshire Museum, Llandrindod Wells Golf Club, The Rock Park, Llandrindod Wells Spa |
| Lake Park | A picturesque area surrounding the lake, perfect for nature lovers. Offers beautiful walking paths and scenic views, attracting visitors looking for tranquility. | Llandrindod Lake, Recreational paths, Picnic areas, Wildlife watching |
| Spa Road | Known for its relaxing atmosphere and historic spa facilities, this area appeals to those looking to unwind and enjoy wellness options. | The National Cycle Museum, Llandrindod Wells Spa, Wellness retreats, Traditional spa services |
| Gilwern Hill | A residential area with stunning views, ideal for those who enjoy outdoor activities like hiking and nature exploration. | Walking trails, Hilltop views, Nature reserves |
| Cilmery | A quaint village just outside Llandrindod Wells, offering a peaceful retreat with a rural feel, perfect for families and couple getaways. | Cilmery Church, Scenic countryside, Local pubs |
| Nantmel | A beautiful rural area providing a countryside escape, good for those looking to experience the Welsh landscape and outdoor adventures. | Brecon Beacons National Park, River Wye, Walking trails |
| Llanddewi Brefi | A charming village that attracts those seeking rural tranquility. Great for guests who want to immerse themselves in local Welsh culture. | Local heritage sites, Community events, Welsh countryside |
| Builth Wells | Nearby town known for its events and festivals; popular with visitors for its equestrian shows and outdoor activities. | Royal Welsh Showground, Builth Wells Castle, Wells and Rivers Festival |
Understanding Airbnb License Requirements & STR Laws in Llandrindod Wells (2025)
While Llandrindod Wells, Wales, United Kingdom currently shows low STR regulations, specific Airbnb license requirements might still exist or change. Always verify the latest short term rental regulations and Airbnb license requirements directly with local government authorities for Llandrindod Wells to ensure full compliance before hosting.
(Source: AirROI data, 2025, finding no licensed listings among those analyzed)
Top Performing Airbnb Properties in Llandrindod Wells (2025)
Benchmark your potential! Explore examples of top-performing Airbnb properties in Llandrindod Wellsbased on Trailing Twelve Month (TTM) revenue. Analyze their characteristics, revenue, occupancy rate, and ADR to understand what drives success in this market.
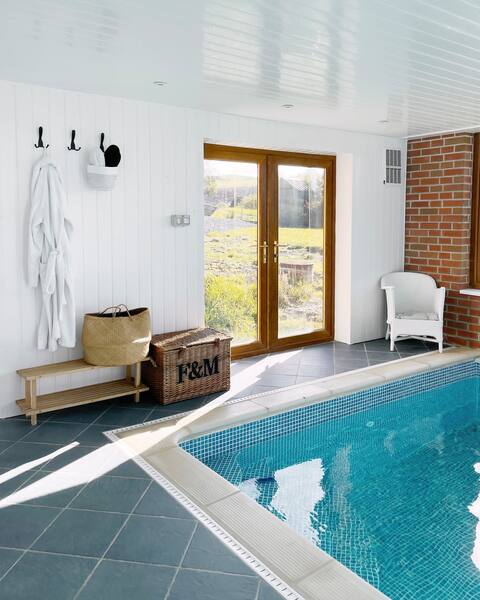
Barn for 10 • Private Heated Pool • Fishing Lake
Entire Place • 5 bedrooms
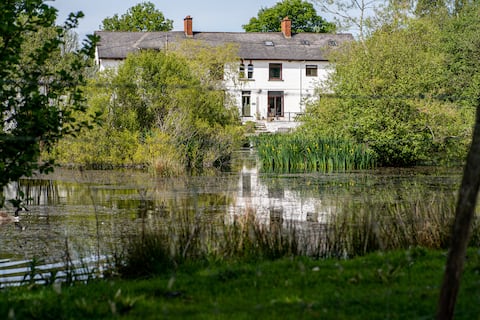
Three Wells Farm
Entire Place • 13 bedrooms
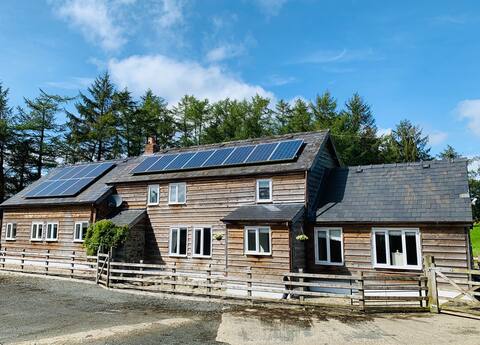
Upper Sign Farmhouse, A Mid Wales Country Retreat!
Entire Place • 3 bedrooms

The Granary Cottage, wonderful views, dog friendly
Entire Place • 2 bedrooms
Flat 4 Russell House
Entire Place • 1 bedroom

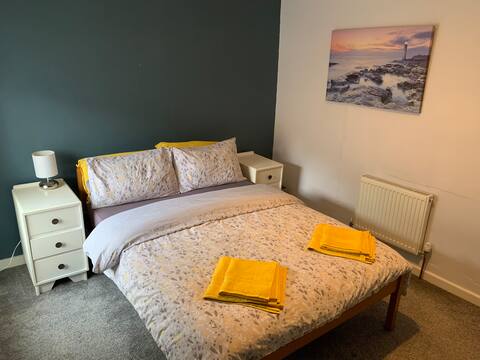
Cosy private guest suite in Llandrindod, Powys.
Entire Place • 1 bedroom
Note: Performance varies based on location, size, amenities, seasonality, and management quality. Data reflects the past 12 months.
Top Performing Airbnb Hosts in Llandrindod Wells (2025)
Learn from the best! This table showcases top-performing Airbnb hosts in Llandrindod Wells based on the number of properties managed and estimated total revenue over the past year. Analyze their scale and performance metrics.
| Host Name | Properties | Grossing Revenue | Stay Reviews | Avg Rating |
|---|---|---|---|---|
| Gary | 1 | $146,599 | 26 | 4.85/5.0 |
| Alison | 1 | $85,671 | 13 | 4.92/5.0 |
| Sandra | 1 | $50,336 | 198 | 4.88/5.0 |
| John | 3 | $46,857 | 513 | 4.79/5.0 |
| Margot | 1 | $27,791 | 58 | 4.90/5.0 |
| Mary | 2 | $23,137 | 188 | 4.83/5.0 |
| Charlotte | 1 | $17,755 | 73 | 4.77/5.0 |
| Lisa | 2 | $15,818 | 70 | 4.96/5.0 |
| Elwyn | 3 | $13,071 | 99 | 4.90/5.0 |
| Host #376105086 | 1 | $12,058 | 1 | 0.00/5.0 |
Analyzing the strategies of top hosts, such as their property selection, pricing, and guest communication, can offer valuable lessons for optimizing your own Airbnb operations in Llandrindod Wells.
Dive Deeper: Advanced Llandrindod Wells STR Market Data (2025)
Ready to unlock more insights? AirROI provides access to advanced metrics and comprehensive Airbnb data for Llandrindod Wells. Explore detailed analytics beyond this report to refine your investment strategy, optimize pricing, and maximize your vacation rental profits.
Explore Advanced MetricsLlandrindod Wells Short-Term Rental Market Composition (2025): Property & Room Types
Room Type Distribution
Property Type Distribution
Market Composition Insights for Llandrindod Wells
- The Llandrindod Wells Airbnb market composition is heavily skewed towards Entire Home/Apt listings, which make up 60% of the 20 active rentals. This indicates strong guest preference for privacy and space.
- However, a notable 40% share for Private Rooms suggests opportunities for budget-conscious travelers or hosts renting out spare rooms.
- Looking at the property type distribution in Llandrindod Wells, House properties are the most common (50%), reflecting the local real estate landscape.
- Houses represent a significant 50% portion, catering likely to families or larger groups.
Llandrindod Wells Airbnb Room Capacity Analysis (2025): Bedroom Distribution
Distribution of Listings by Number of Bedrooms
Room Capacity Insights for Llandrindod Wells
- The dominant room capacity in Llandrindod Wells is 1 bedroom listings, making up 35% of the market. This suggests a strong demand for properties suitable for couples or solo travelers.
- Together, 1 bedroom and 2 bedrooms properties represent 55.0% of the active Airbnb listings in Llandrindod Wells, indicating a high concentration in these sizes.
Llandrindod Wells Vacation Rental Guest Capacity Trends (2025)
Distribution of Listings by Guest Capacity
Guest Capacity Insights for Llandrindod Wells
- The most common guest capacity trend in Llandrindod Wells vacation rentals is listings accommodating 4 guests (30%). This suggests the primary traveler segment is likely small families or groups.
- Properties designed for 4 guests and 8+ guests dominate the Llandrindod Wells STR market, accounting for 45.0% of listings.
- 15.0% of properties accommodate 6+ guests, serving the market segment for larger families or group travel in Llandrindod Wells.
- On average, properties in Llandrindod Wells are equipped to host 2.9 guests.
Llandrindod Wells Airbnb Booking Patterns (2025): Available vs. Booked Days
Available Days Distribution
Booked Days Distribution
Booking Pattern Insights for Llandrindod Wells
- The most common availability pattern in Llandrindod Wells falls within the 91-180 days range, representing 35% of listings. This suggests many properties have significant open periods on their calendars.
- Approximately 55.0% of listings show high availability (181+ days open annually), indicating potential for increased bookings or specific owner usage patterns.
- For booked days, the 181-270 days range is most frequent in Llandrindod Wells (35%), reflecting common guest stay durations or potential owner blocking patterns.
- A notable 50.0% of properties secure long booking periods (181+ days booked per year), highlighting successful long-term rental strategies or significant owner usage.
Llandrindod Wells Airbnb Minimum Stay Requirements Analysis
Distribution of Listings by Minimum Night Requirement
1 Night
9 listings
47.4% of total
2 Nights
6 listings
31.6% of total
3 Nights
4 listings
21.1% of total
Key Insights
- The most prevalent minimum stay requirement in Llandrindod Wells is 1 Night, adopted by 47.4% of listings. This highlights the market's preference for shorter, flexible bookings.
- A strong majority (79.0%) of the Llandrindod Wells Airbnb data shows acceptance of very short stays (1-2 nights), indicating a dynamic, high-turnover market.
Recommendations
- Align with the market by considering a 1 Night minimum stay, as 47.4% of Llandrindod Wells hosts use this setting.
- Adjust minimum nights based on seasonality – potentially shorter during low season and longer during peak demand periods in Llandrindod Wells.
Llandrindod Wells Airbnb Cancellation Policy Trends Analysis (2025)
Flexible
6 listings
31.6% of total
Moderate
8 listings
42.1% of total
Firm
3 listings
15.8% of total
Strict
2 listings
10.5% of total
Cancellation Policy Insights for Llandrindod Wells
- The prevailing Airbnb cancellation policy trend in Llandrindod Wells is Moderate, used by 42.1% of listings.
- The market strongly favors guest-friendly terms, with 73.7% of listings offering Flexible or Moderate policies. This suggests guests in Llandrindod Wells may expect booking flexibility.
Recommendations for Hosts
- Consider adopting a Moderate policy to align with the 42.1% market standard in Llandrindod Wells.
- Using a Strict policy might deter some guests, as only 10.5% of listings use it. Evaluate if potential revenue protection outweighs possible lower booking rates.
- Regularly review your cancellation policy against competitors and market demand shifts in Llandrindod Wells.
Llandrindod Wells STR Booking Lead Time Analysis (2025)
Average Booking Lead Time by Month
Booking Lead Time Insights for Llandrindod Wells
- The overall average booking lead time for vacation rentals in Llandrindod Wells is 54 days.
- Guests book furthest in advance for stays during July (average 120 days), likely coinciding with peak travel demand or local events.
- The shortest booking windows occur for stays in September (average 28 days), indicating more last-minute travel plans during this time.
- Seasonally, Summer (98 days avg.) sees the longest lead times, while Fall (44 days avg.) has the shortest, reflecting typical travel planning cycles.
Recommendations for Hosts
- Use the overall average lead time (54 days) as a baseline for your pricing and availability strategy in Llandrindod Wells.
- For July stays, consider implementing length-of-stay discounts or slightly higher rates for bookings made less than 120 days out to capitalize on advance planning.
- Target marketing efforts for the Summer season well in advance (at least 98 days) to capture early planners.
- Monitor your own booking lead times against these Llandrindod Wells averages to identify opportunities for dynamic pricing adjustments.
Popular & Essential Airbnb Amenities in Llandrindod Wells (2025)
Amenity Prevalence
Amenity Insights for Llandrindod Wells
- Essential amenities in Llandrindod Wells that guests expect include: Smoke alarm, Wifi, Hair dryer, Carbon monoxide alarm, Hot water. Lacking these (any) could significantly impact bookings.
- Popular amenities like Refrigerator, Hangers, Kitchen are common but not universal. Offering these can provide a competitive edge.
Recommendations for Hosts
- Ensure your listing includes all essential amenities for Llandrindod Wells: Smoke alarm, Wifi, Hair dryer, Carbon monoxide alarm, Hot water.
- Prioritize adding missing essentials: Hair dryer, Carbon monoxide alarm, Hot water.
- Consider adding popular differentiators like Refrigerator or Hangers to increase appeal.
- Highlight unique or less common amenities you offer (e.g., hot tub, dedicated workspace, EV charger) in your listing description and photos.
- Regularly check competitor amenities in Llandrindod Wells to stay competitive.
Llandrindod Wells Airbnb Guest Demographics & Profile Analysis (2025)
Guest Profile Summary for Llandrindod Wells
- The typical guest profile for Airbnb in Llandrindod Wells consists of primarily domestic travelers (90%), often arriving from nearby England, typically belonging to the Post-2000s (Gen Z/Alpha) group (50%), primarily speaking English or French.
- Domestic travelers account for 89.5% of guests.
- Key international markets include United Kingdom (89.5%) and Australia (2.6%).
- Top languages spoken are English (63.9%) followed by French (9.1%).
- A significant demographic segment is the Post-2000s (Gen Z/Alpha) group, representing 50% of guests.
Recommendations for Hosts
- Target domestic marketing efforts towards travelers from England and London.
- Tailor amenities and listing descriptions to appeal to the dominant Post-2000s (Gen Z/Alpha) demographic (e.g., highlight fast WiFi, smart home features, local guides).
- Highlight unique local experiences or amenities relevant to the primary guest profile.
- Consider seasonal promotions aligned with peak travel times for key origin markets.
Nearby Short-Term Rental Market Comparison
How does the Llandrindod Wells Airbnb market stack up against its neighbors? Compare key performance metrics like average monthly revenue, ADR, and occupancy rates in surrounding areas to understand the broader regional STR landscape.
| Market | Active Properties | Monthly Revenue | Daily Rate | Avg. Occupancy |
|---|---|---|---|---|
| Englishcombe | 13 | $8,558 | $573.69 | 49% |
| Chew Magna | 14 | $6,649 | $399.59 | 46% |
| Long Sutton | 17 | $5,726 | $383.88 | 46% |
| Stoke St. Michael | 10 | $5,277 | $424.04 | 42% |
| Oldland Common | 13 | $5,093 | $355.47 | 43% |
| Llanrhidian | 15 | $4,842 | $386.18 | 53% |
| Crai | 20 | $4,799 | $371.85 | 46% |
| Limpley Stoke | 10 | $4,598 | $523.47 | 52% |
| Abbeycwmhir | 10 | $4,502 | $259.19 | 49% |
| Ashley | 16 | $4,496 | $321.11 | 52% |