Llanbedr Airbnb Market Analysis 2025: Short Term Rental Data & Vacation Rental Statistics in Wales, United Kingdom
Is Airbnb profitable in Llanbedr in 2025? Explore comprehensive Airbnb analytics for Llanbedr, Wales, United Kingdom to uncover income potential. This 2025 STR market report for Llanbedr, based on AirROI data from April 2024 to March 2025, reveals key trends in the niche market of 42 active listings.
Whether you're considering an Airbnb investment in Llanbedr, optimizing your existing vacation rental, or exploring rental arbitrage opportunities, understanding the Llanbedr Airbnb data is crucial. Leveraging the low regulation environment is key to maximizing your short term rental income potential. Let's dive into the specifics.
Key Llanbedr Airbnb Performance Metrics Overview
Monthly Airbnb Revenue Variations & Income Potential in Llanbedr (2025)
Understanding the monthly revenue variations for Airbnb listings in Llanbedr is key to maximizing your short term rental income potential. Seasonality significantly impacts earnings. Our analysis, based on data from the past 12 months, shows that the peak revenue month for STRs in Llanbedr is typically August, while March often presents the lowest earnings, highlighting opportunities for strategic pricing adjustments during shoulder and low seasons. Explore the typical Airbnb income in Llanbedr across different performance tiers:
- Best-in-class properties (Top 10%) achieve $5,623+ monthly, often utilizing dynamic pricing and superior guest experiences.
- Strong performing properties (Top 25%) earn $3,870 or more, indicating effective management and desirable locations/amenities.
- Typical properties (Median) generate around $2,266 per month, representing the average market performance.
- Entry-level properties (Bottom 25%) see earnings around $1,379, often with potential for optimization.
Average Monthly Airbnb Earnings Trend in Llanbedr
Llanbedr Airbnb Occupancy Rate Trends (2025)
Maximize your bookings by understanding the Llanbedr STR occupancy trends. Seasonal demand shifts significantly influence how often properties are booked. Typically, Augustsees the highest demand (peak season occupancy), while February experiences the lowest (low season). Effective strategies, like adjusting minimum stays or offering promotions, can boost occupancy during slower periods. Here's how different property tiers perform in Llanbedr:
- Best-in-class properties (Top 10%) achieve 78%+ occupancy, indicating high desirability and potentially optimized availability.
- Strong performing properties (Top 25%) maintain 63% or higher occupancy, suggesting good market fit and guest satisfaction.
- Typical properties (Median) have an occupancy rate around 43%.
- Entry-level properties (Bottom 25%) average 28% occupancy, potentially facing higher vacancy.
Average Monthly Occupancy Rate Trend in Llanbedr
Average Daily Rate (ADR) Airbnb Trends in Llanbedr (2025)
Effective short term rental pricing strategy in Llanbedr involves understanding monthly ADR fluctuations. The Average Daily Rate (ADR) for Airbnb in Llanbedr typically peaks in December and dips lowest during April. Leveraging Airbnb dynamic pricing tools or strategies based on this seasonality can significantly boost revenue. Here's a look at the typical nightly rates achieved:
- Best-in-class properties (Top 10%) command rates of $373+ per night, often due to premium features or locations.
- Strong performing properties (Top 25%) achieve nightly rates of $249 or more.
- Typical properties (Median) charge around $169 per night.
- Entry-level properties (Bottom 25%) earn around $119 per night.
Average Daily Rate (ADR) Trend by Month in Llanbedr
Get Live Llanbedr Market Intelligence 👇

Explore Real-time Analytics
Airbnb Seasonality Analysis & Trends in Llanbedr (2025)
Peak Season (August, July, June)
- Revenue averages $4,327 per month
- Occupancy rates average 63.3%
- Daily rates average $209
Shoulder Season
- Revenue averages $2,806 per month
- Occupancy maintains around 44.2%
- Daily rates hold near $210
Low Season (January, February, March)
- Revenue drops to average $1,885 per month
- Occupancy decreases to average 28.7%
- Daily rates adjust to average $218
Seasonality Insights for Llanbedr
- The Airbnb seasonality in Llanbedr shows highly seasonal trends requiring careful strategy. While the sections above show seasonal averages, it's also insightful to look at the extremes:
- During the high season, the absolute peak month showcases Llanbedr's highest earning potential, with monthly revenues capable of climbing to $4,765, occupancy reaching a high of 71.6%, and ADRs peaking at $228.
- Conversely, the slowest single month of the year, typically falling within the low season, marks the market's lowest point. In this month, revenue might dip to $1,821, occupancy could drop to 27.4%, and ADRs may adjust down to $201.
- Understanding both the seasonal averages and these monthly peaks and troughs in revenue, occupancy, and ADR is crucial for maximizing your Airbnb profit potential in Llanbedr.
Seasonal Strategies for Maximizing Profit
- Peak Season: Maximize revenue through premium pricing and potentially longer minimum stays. Ensure high availability.
- Low Season: Offer competitive pricing, special promotions (e.g., extended stay discounts), and flexible cancellation policies. Target off-season travelers like remote workers or budget-conscious guests.
- Shoulder Seasons: Implement dynamic pricing that balances peak and low rates. Target weekend travelers or specific events. Offer slightly more flexible terms than peak season.
- Regularly analyze your own performance against these Llanbedr seasonality benchmarks and adjust your pricing and availability strategy accordingly.
Best Areas for Airbnb Investment in Llanbedr (2025)
Exploring the top neighborhoods for short-term rentals in Llanbedr? This section highlights key areas, outlining why they are attractive for hosts and guests, along with notable local attractions. Consider these locations based on your target guest profile and investment strategy.
| Neighborhood / Area | Why Host Here? (Target Guests & Appeal) | Key Attractions & Landmarks |
|---|---|---|
| Llanbedr Beach | Scenic beach area ideal for summer tourism with beautiful sands and outdoor activities. Perfect for families and holidaymakers looking for a relaxing seaside getaway. | Llanbedr Beach, Llyn Peninsula, The Mawddach Trail, Sygun Copper Mine, Snowdonia National Park, Harlech Castle |
| Snowdonia National Park | Popular for outdoor activities and nature lovers, it attracts hikers and adventure seekers. Ideal for those wanting to explore beautiful landscapes and enjoy various outdoor sports. | Mount Snowdon, Pyg Track, Snowdon Ranger Path, Llyn Tegid, Conwy Valley |
| Harlech | Historic town known for its impressive castle and stunning views. Visitors come for historical tourism as well as proximity to the beach and mountains. | Harlech Castle, Harlech Beach, Royal St. David's Golf Club, St. Tanwg's Church |
| Barmouth | Nearby coastal town with a vibrant beach scene and charming harbor. Great for tourists looking for seaside experiences and local culture. | Barmouth Beach, Barmouth Bridge, Dyffryn Ardudwy, The Mawddach Trail |
| Betws-y-Coed | Gateway to Snowdonia, known for its outdoor activities and scenic beauty. A popular destination for adventure tourism and relaxation. | Swallow Falls, Conwy Valley Railway, Snowdonia National Park, Pont-y-Pair Bridge |
| Dolgellau | Historic market town with wonderful architecture and outdoor adventures. Attracts walkers and cyclists looking to explore the surrounding countryside. | Dolgellau Market, Cader Idris Mountain, Coed y Brenin Forest Park |
| Penmaenpool | Picturesque village near Barmouth with easy access to the coast and countryside, popular with tourists seeking tranquility and nature. | Penmaenpool Bridge, The Mawddach Trail, Dolgellau |
| Porthmadog | Port town with a rich maritime history, close to popular attractions like Portmeirion and the Ffestiniog Railway. Great for visitors interested in unique architecture and rail experiences. | Portmeirion Village, Ffestiniog Railway, Black Rock Sands |
Understanding Airbnb License Requirements & STR Laws in Llanbedr (2025)
While Llanbedr, Wales, United Kingdom currently shows low STR regulations, specific Airbnb license requirements might still exist or change. Always verify the latest short term rental regulations and Airbnb license requirements directly with local government authorities for Llanbedr to ensure full compliance before hosting.
(Source: AirROI data, 2025, finding no licensed listings among those analyzed)
Top Performing Airbnb Properties in Llanbedr (2025)
Benchmark your potential! Explore examples of top-performing Airbnb properties in Llanbedrbased on Trailing Twelve Month (TTM) revenue. Analyze their characteristics, revenue, occupancy rate, and ADR to understand what drives success in this market.
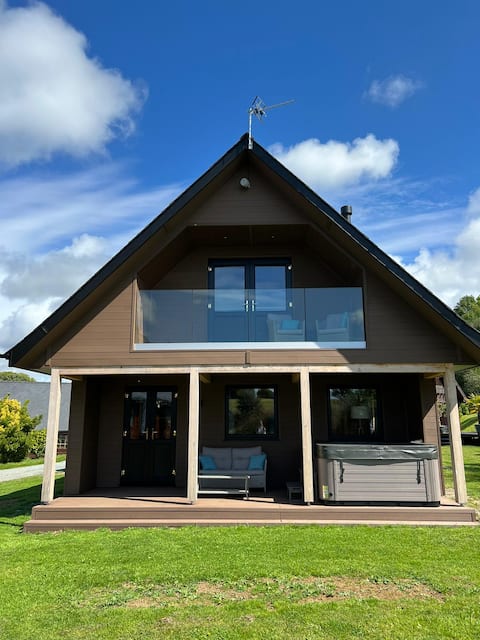
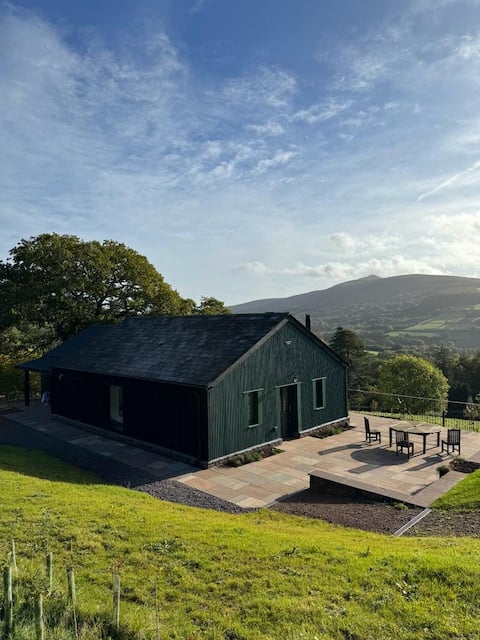
Artro Lodge 21
Entire Place • 3 bedrooms
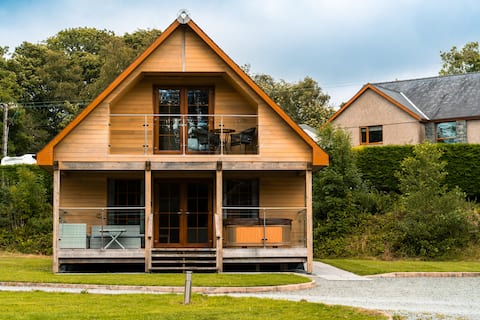
Lodge 22
Entire Place • 3 bedrooms
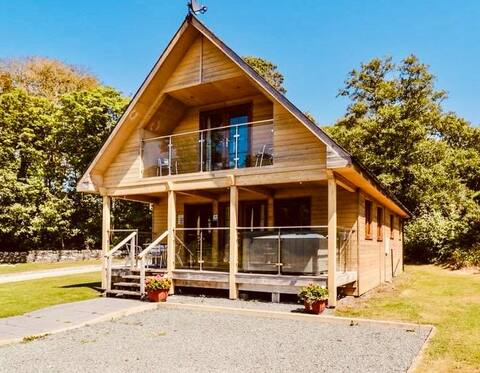
Luxurious and spacious 3 bedroom lodge with hotub.
Entire Place • 3 bedrooms
Cae Nest Hall
Entire Place • 8 bedrooms
The Bothy - unique & charming
Entire Place • 1 bedroom
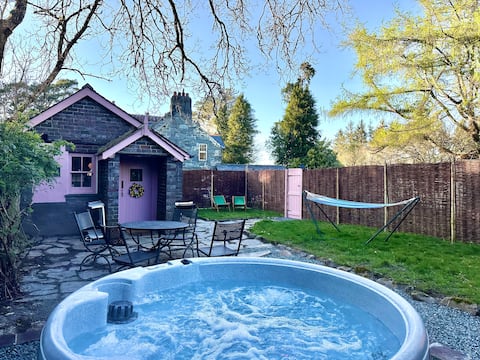
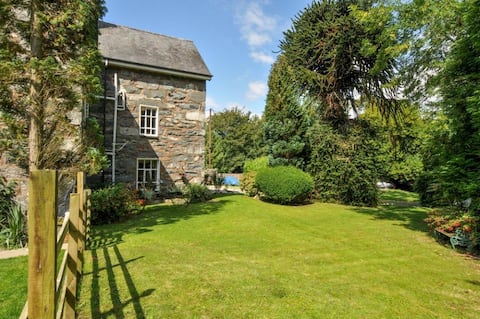
Cosy Country Cottage Hot Tub & Garden in Snowdonia
Entire Place • 1 bedroom
Note: Performance varies based on location, size, amenities, seasonality, and management quality. Data reflects the past 12 months.
Top Performing Airbnb Hosts in Llanbedr (2025)
Learn from the best! This table showcases top-performing Airbnb hosts in Llanbedr based on the number of properties managed and estimated total revenue over the past year. Analyze their scale and performance metrics.
| Host Name | Properties | Grossing Revenue | Stay Reviews | Avg Rating |
|---|---|---|---|---|
| Steve | 1 | $69,507 | 37 | 4.95/5.0 |
| Chrissie | 1 | $65,467 | 70 | 4.87/5.0 |
| Victoria | 1 | $64,237 | 65 | 5.00/5.0 |
| Kina | 1 | $63,762 | 25 | 4.44/5.0 |
| James | 1 | $59,328 | 28 | 5.00/5.0 |
| Cottages | 3 | $54,488 | 25 | 3.22/5.0 |
| Julia | 1 | $49,005 | 15 | 4.93/5.0 |
| Gwion | 1 | $44,647 | 20 | 5.00/5.0 |
| Jennifer | 1 | $44,013 | 46 | 4.76/5.0 |
| Lisa | 1 | $41,030 | 32 | 4.97/5.0 |
Analyzing the strategies of top hosts, such as their property selection, pricing, and guest communication, can offer valuable lessons for optimizing your own Airbnb operations in Llanbedr.
Dive Deeper: Advanced Llanbedr STR Market Data (2025)
Ready to unlock more insights? AirROI provides access to advanced metrics and comprehensive Airbnb data for Llanbedr. Explore detailed analytics beyond this report to refine your investment strategy, optimize pricing, and maximize your vacation rental profits.
Explore Advanced MetricsLlanbedr Short-Term Rental Market Composition (2025): Property & Room Types
Room Type Distribution
Property Type Distribution
Market Composition Insights for Llanbedr
- The Llanbedr Airbnb market composition is heavily skewed towards Entire Home/Apt listings, which make up 97.6% of the 42 active rentals. This indicates strong guest preference for privacy and space.
- Looking at the property type distribution in Llanbedr, House properties are the most common (61.9%), reflecting the local real estate landscape.
- Houses represent a significant 61.9% portion, catering likely to families or larger groups.
- Smaller segments like others, hotel/boutique (combined 7.2%) offer potential for unique stay experiences.
Llanbedr Airbnb Room Capacity Analysis (2025): Bedroom Distribution
Distribution of Listings by Number of Bedrooms
Room Capacity Insights for Llanbedr
- The dominant room capacity in Llanbedr is 3 bedrooms listings, making up 35.7% of the market. This suggests a strong demand for properties suitable for families or small groups.
- Together, 3 bedrooms and 1 bedroom properties represent 69.0% of the active Airbnb listings in Llanbedr, indicating a high concentration in these sizes.
- A significant 47.6% of listings offer 3+ bedrooms, catering to larger groups and families seeking more space in Llanbedr.
Llanbedr Vacation Rental Guest Capacity Trends (2025)
Distribution of Listings by Guest Capacity
Guest Capacity Insights for Llanbedr
- The most common guest capacity trend in Llanbedr vacation rentals is listings accommodating 2 guests (33.3%). This suggests the primary traveler segment is likely couples or solo travelers.
- Properties designed for 2 guests and 6 guests dominate the Llanbedr STR market, accounting for 61.9% of listings.
- 42.9% of properties accommodate 6+ guests, serving the market segment for larger families or group travel in Llanbedr.
- On average, properties in Llanbedr are equipped to host 4.4 guests.
Llanbedr Airbnb Booking Patterns (2025): Available vs. Booked Days
Available Days Distribution
Booked Days Distribution
Booking Pattern Insights for Llanbedr
- The most common availability pattern in Llanbedr falls within the 181-270 days range, representing 38.1% of listings. This suggests many properties have significant open periods on their calendars.
- Approximately 69.1% of listings show high availability (181+ days open annually), indicating potential for increased bookings or specific owner usage patterns.
- For booked days, the 91-180 days range is most frequent in Llanbedr (38.1%), reflecting common guest stay durations or potential owner blocking patterns.
- A notable 31.0% of properties secure long booking periods (181+ days booked per year), highlighting successful long-term rental strategies or significant owner usage.
Llanbedr Airbnb Minimum Stay Requirements Analysis
Distribution of Listings by Minimum Night Requirement
1 Night
5 listings
13.2% of total
2 Nights
11 listings
28.9% of total
3 Nights
13 listings
34.2% of total
4-6 Nights
3 listings
7.9% of total
7-29 Nights
1 listings
2.6% of total
30+ Nights
5 listings
13.2% of total
Key Insights
- The most prevalent minimum stay requirement in Llanbedr is 3 Nights, adopted by 34.2% of listings. This highlights the market's preference for longer commitments.
- A significant segment (13.2%) caters to monthly stays (30+ nights) in Llanbedr, pointing to opportunities in the extended-stay market.
Recommendations
- Align with the market by considering a 3 Nights minimum stay, as 34.2% of Llanbedr hosts use this setting.
- If feasible, allowing 1-night stays, especially midweek or during low season, could capture last-minute bookings, as only 13.2% currently do.
- Explore offering discounts for stays of 30+ nights to attract the 13.2% of the market seeking extended stays.
- Adjust minimum nights based on seasonality – potentially shorter during low season and longer during peak demand periods in Llanbedr.
Llanbedr Airbnb Cancellation Policy Trends Analysis (2025)
Super Strict 30 Days
1 listings
2.9% of total
Super Strict 60 Days
2 listings
5.9% of total
Flexible
4 listings
11.8% of total
Moderate
10 listings
29.4% of total
Firm
8 listings
23.5% of total
Strict
9 listings
26.5% of total
Cancellation Policy Insights for Llanbedr
- The prevailing Airbnb cancellation policy trend in Llanbedr is Moderate, used by 29.4% of listings.
- There's a relatively balanced mix between guest-friendly (41.2%) and stricter (50.0%) policies, offering choices for different guest needs.
Recommendations for Hosts
- Consider adopting a Moderate policy to align with the 29.4% market standard in Llanbedr.
- Regularly review your cancellation policy against competitors and market demand shifts in Llanbedr.
Llanbedr STR Booking Lead Time Analysis (2025)
Average Booking Lead Time by Month
Booking Lead Time Insights for Llanbedr
- The overall average booking lead time for vacation rentals in Llanbedr is 67 days.
- Guests book furthest in advance for stays during July (average 101 days), likely coinciding with peak travel demand or local events.
- The shortest booking windows occur for stays in April (average 50 days), indicating more last-minute travel plans during this time.
- Seasonally, Summer (88 days avg.) sees the longest lead times, while Fall (51 days avg.) has the shortest, reflecting typical travel planning cycles.
Recommendations for Hosts
- Use the overall average lead time (67 days) as a baseline for your pricing and availability strategy in Llanbedr.
- For July stays, consider implementing length-of-stay discounts or slightly higher rates for bookings made less than 101 days out to capitalize on advance planning.
- Target marketing efforts for the Summer season well in advance (at least 88 days) to capture early planners.
- Monitor your own booking lead times against these Llanbedr averages to identify opportunities for dynamic pricing adjustments.
Popular & Essential Airbnb Amenities in Llanbedr (2025)
Amenity Prevalence
Amenity Insights for Llanbedr
- Essential amenities in Llanbedr that guests expect include: Heating, Smoke alarm, Kitchen, Hot water. Lacking these (any) could significantly impact bookings.
- Popular amenities like Wifi, Dishes and silverware, TV are common but not universal. Offering these can provide a competitive edge.
- Warning: Wifi is not universally provided but is considered essential globally. Ensure reliable Wifi is offered.
Recommendations for Hosts
- Ensure your listing includes all essential amenities for Llanbedr: Heating, Smoke alarm, Kitchen, Hot water.
- Prioritize adding missing essentials: Smoke alarm, Kitchen, Hot water.
- Consider adding popular differentiators like Wifi or Dishes and silverware to increase appeal.
- Highlight unique or less common amenities you offer (e.g., hot tub, dedicated workspace, EV charger) in your listing description and photos.
- Regularly check competitor amenities in Llanbedr to stay competitive.
Llanbedr Airbnb Guest Demographics & Profile Analysis (2025)
Guest Profile Summary for Llanbedr
- The typical guest profile for Airbnb in Llanbedr consists of primarily domestic travelers (92%), often arriving from nearby England, typically belonging to the Post-2000s (Gen Z/Alpha) group (50%), primarily speaking English or French.
- Domestic travelers account for 92.3% of guests.
- Key international markets include United Kingdom (92.3%) and Australia (1.5%).
- Top languages spoken are English (67.8%) followed by French (9.1%).
- A significant demographic segment is the Post-2000s (Gen Z/Alpha) group, representing 50% of guests.
Recommendations for Hosts
- Target domestic marketing efforts towards travelers from England and London.
- Tailor amenities and listing descriptions to appeal to the dominant Post-2000s (Gen Z/Alpha) demographic (e.g., highlight fast WiFi, smart home features, local guides).
- Highlight unique local experiences or amenities relevant to the primary guest profile.
- Consider seasonal promotions aligned with peak travel times for key origin markets.
Nearby Short-Term Rental Market Comparison
How does the Llanbedr Airbnb market stack up against its neighbors? Compare key performance metrics like average monthly revenue, ADR, and occupancy rates in surrounding areas to understand the broader regional STR landscape.
| Market | Active Properties | Monthly Revenue | Daily Rate | Avg. Occupancy |
|---|---|---|---|---|
| Englishcombe | 13 | $8,558 | $573.69 | 49% |
| Chew Magna | 14 | $6,649 | $399.59 | 46% |
| Long Sutton | 17 | $5,726 | $383.88 | 46% |
| Stoke St. Michael | 10 | $5,277 | $424.04 | 42% |
| Oldland Common | 13 | $5,093 | $355.47 | 43% |
| Llanrhidian | 15 | $4,842 | $386.18 | 53% |
| Crai | 20 | $4,799 | $371.85 | 46% |
| Limpley Stoke | 10 | $4,598 | $523.47 | 52% |
| Abbeycwmhir | 10 | $4,502 | $259.19 | 49% |
| Ashley | 16 | $4,496 | $321.11 | 52% |