Ilston Airbnb Market Analysis 2025: Short Term Rental Data & Vacation Rental Statistics in Wales, United Kingdom
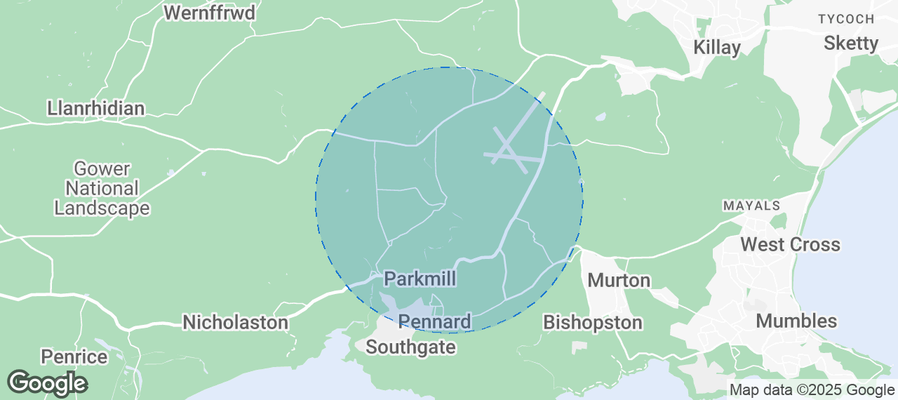
Is Airbnb profitable in Ilston in 2025? Explore comprehensive Airbnb analytics for Ilston, Wales, United Kingdom to uncover income potential. This 2025 STR market report for Ilston, based on AirROI data from April 2024 to March 2025, reveals key trends in the niche market of 26 active listings.
Whether you're considering an Airbnb investment in Ilston, optimizing your existing vacation rental, or exploring rental arbitrage opportunities, understanding the Ilston Airbnb data is crucial. Leveraging the low regulation environment is key to maximizing your short term rental income potential. Let's dive into the specifics.
Key Ilston Airbnb Performance Metrics Overview
Monthly Airbnb Revenue Variations & Income Potential in Ilston (2025)
Understanding the monthly revenue variations for Airbnb listings in Ilston is key to maximizing your short term rental income potential. Seasonality significantly impacts earnings. Our analysis, based on data from the past 12 months, shows that the peak revenue month for STRs in Ilston is typically August, while November often presents the lowest earnings, highlighting opportunities for strategic pricing adjustments during shoulder and low seasons. Explore the typical Airbnb income in Ilston across different performance tiers:
- Best-in-class properties (Top 10%) achieve $5,668+ monthly, often utilizing dynamic pricing and superior guest experiences.
- Strong performing properties (Top 25%) earn $3,609 or more, indicating effective management and desirable locations/amenities.
- Typical properties (Median) generate around $2,638 per month, representing the average market performance.
- Entry-level properties (Bottom 25%) see earnings around $1,447, often with potential for optimization.
Average Monthly Airbnb Earnings Trend in Ilston
Ilston Airbnb Occupancy Rate Trends (2025)
Maximize your bookings by understanding the Ilston STR occupancy trends. Seasonal demand shifts significantly influence how often properties are booked. Typically, Augustsees the highest demand (peak season occupancy), while January experiences the lowest (low season). Effective strategies, like adjusting minimum stays or offering promotions, can boost occupancy during slower periods. Here's how different property tiers perform in Ilston:
- Best-in-class properties (Top 10%) achieve 75%+ occupancy, indicating high desirability and potentially optimized availability.
- Strong performing properties (Top 25%) maintain 62% or higher occupancy, suggesting good market fit and guest satisfaction.
- Typical properties (Median) have an occupancy rate around 43%.
- Entry-level properties (Bottom 25%) average 25% occupancy, potentially facing higher vacancy.
Average Monthly Occupancy Rate Trend in Ilston
Average Daily Rate (ADR) Airbnb Trends in Ilston (2025)
Effective short term rental pricing strategy in Ilston involves understanding monthly ADR fluctuations. The Average Daily Rate (ADR) for Airbnb in Ilston typically peaks in July and dips lowest during November. Leveraging Airbnb dynamic pricing tools or strategies based on this seasonality can significantly boost revenue. Here's a look at the typical nightly rates achieved:
- Best-in-class properties (Top 10%) command rates of $412+ per night, often due to premium features or locations.
- Strong performing properties (Top 25%) achieve nightly rates of $231 or more.
- Typical properties (Median) charge around $168 per night.
- Entry-level properties (Bottom 25%) earn around $128 per night.
Average Daily Rate (ADR) Trend by Month in Ilston
Get Live Ilston Market Intelligence 👇
Explore Real-time Analytics
Airbnb Seasonality Analysis & Trends in Ilston (2025)
Peak Season (August, July, May)
- Revenue averages $4,956 per month
- Occupancy rates average 67.1%
- Daily rates average $265
Shoulder Season
- Revenue averages $3,061 per month
- Occupancy maintains around 39.5%
- Daily rates hold near $245
Low Season (February, October, November)
- Revenue drops to average $1,745 per month
- Occupancy decreases to average 32.2%
- Daily rates adjust to average $237
Seasonality Insights for Ilston
- The Airbnb seasonality in Ilston shows highly seasonal trends requiring careful strategy. While the sections above show seasonal averages, it's also insightful to look at the extremes:
- During the high season, the absolute peak month showcases Ilston's highest earning potential, with monthly revenues capable of climbing to $5,269, occupancy reaching a high of 74.5%, and ADRs peaking at $267.
- Conversely, the slowest single month of the year, typically falling within the low season, marks the market's lowest point. In this month, revenue might dip to $1,599, occupancy could drop to 24.6%, and ADRs may adjust down to $224.
- Understanding both the seasonal averages and these monthly peaks and troughs in revenue, occupancy, and ADR is crucial for maximizing your Airbnb profit potential in Ilston.
Seasonal Strategies for Maximizing Profit
- Peak Season: Maximize revenue through premium pricing and potentially longer minimum stays. Ensure high availability.
- Low Season: Offer competitive pricing, special promotions (e.g., extended stay discounts), and flexible cancellation policies. Target off-season travelers like remote workers or budget-conscious guests.
- Shoulder Seasons: Implement dynamic pricing that balances peak and low rates. Target weekend travelers or specific events. Offer slightly more flexible terms than peak season.
- Regularly analyze your own performance against these Ilston seasonality benchmarks and adjust your pricing and availability strategy accordingly.
Best Areas for Airbnb Investment in Ilston (2025)
Exploring the top neighborhoods for short-term rentals in Ilston? This section highlights key areas, outlining why they are attractive for hosts and guests, along with notable local attractions. Consider these locations based on your target guest profile and investment strategy.
| Neighborhood / Area | Why Host Here? (Target Guests & Appeal) | Key Attractions & Landmarks |
|---|---|---|
| Ilston Village | A charming rural village offering picturesque settings and a peaceful atmosphere. Ideal for travelers looking for a quiet retreat while still being close to urban amenities. | Ilston Priory, Park Wood, Glynn Vivian Art Gallery, Mumbles Pier, Oystermouth Castle |
| Mumbles | A popular seaside area known for its stunning views of Swansea Bay and a plethora of shops and eateries. It's a favored destination for families and beach lovers. | Mumbles Pier, Oystermouth Castle, Lifeboat Station, The Mumbles Promenade, Verdis Ice Cream |
| Swansea City Centre | The vibrant heart of Swansea with a mix of shopping, dining, and cultural sites. A prime location for both business and leisure travelers. | Swansea Market, Swansea Marina, The National Waterfront Museum, Singleton Park, Cineworld |
| Gower Peninsula | Famous for its breathtaking landscapes and beautiful beaches, Gower attracts nature lovers and adventure seekers. Perfect for those looking to experience the great outdoors. | Rhossili Bay, Oxwich Bay, Three Cliffs Bay, Gower Heritage Centre, Cefn Bryn |
| Sketty | A suburban area within Swansea known for its parks and family-friendly environment. Suitable for travelers who want a balance between city life and tranquility. | Singleton Park, Sketty Park, Brynmill Park, Clyne Gardens, Sketty Library |
| Penclawdd | A small village located on the Loughor Estuary with rich heritage and scenic views. Attracts visitors interested in local culture and nature. | Loughor Castle, Cefn Bryn, Penclawdd Marina, Worms Head, Gower Walking Trails |
| Cwmtawe | A scenic area offering outdoor activities and proximity to natural reserves. Great for those wanting to explore the beauty of Wales. | Cwmtawe Community School, Brecon Beacons National Park, Swansea Canal, River Tawe |
| Glais | A quaint village with a traditional feel and access to beautiful Welsh countryside. Appeals to those wanting an authentic Welsh experience. | Glais Park, The River Clydach, Local pubs and shops |
Understanding Airbnb License Requirements & STR Laws in Ilston (2025)
While Ilston, Wales, United Kingdom currently shows low STR regulations, specific Airbnb license requirements might still exist or change. Always verify the latest short term rental regulations and Airbnb license requirements directly with local government authorities for Ilston to ensure full compliance before hosting.
(Source: AirROI data, 2025, based on 4% licensed listings)
Top Performing Airbnb Properties in Ilston (2025)
Benchmark your potential! Explore examples of top-performing Airbnb properties in Ilstonbased on Trailing Twelve Month (TTM) revenue. Analyze their characteristics, revenue, occupancy rate, and ADR to understand what drives success in this market.
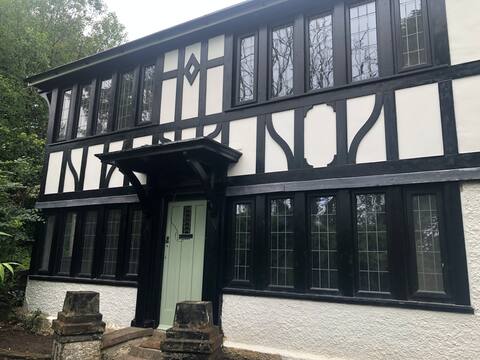
Maes Yr Haf
Entire Place • 5 bedrooms
3 Bedroom House by Three Cliffs Bay
Entire Place • 3 bedrooms

Romantic shepherds hut in the heart of Gower
Entire Place • 1 bedroom

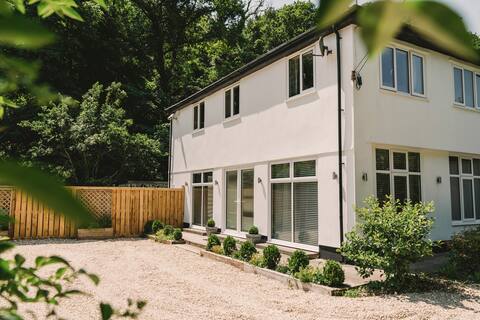
Charming country house annexe
Entire Place • 2 bedrooms

Rose Cottage, Lunnon, Parkmill, Three Cliffs Bay
Entire Place • 3 bedrooms
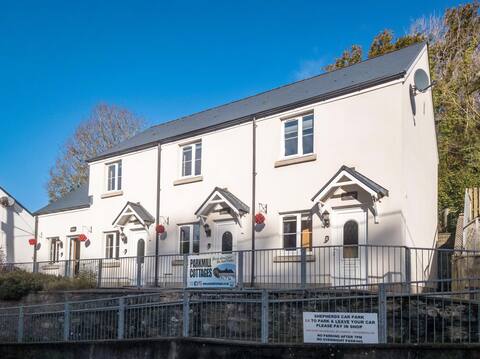
Oxwich Cottage - 2 Bedroom - Parkmill
Entire Place • 2 bedrooms
Note: Performance varies based on location, size, amenities, seasonality, and management quality. Data reflects the past 12 months.
Top Performing Airbnb Hosts in Ilston (2025)
Learn from the best! This table showcases top-performing Airbnb hosts in Ilston based on the number of properties managed and estimated total revenue over the past year. Analyze their scale and performance metrics.
| Host Name | Properties | Grossing Revenue | Stay Reviews | Avg Rating |
|---|---|---|---|---|
| Karly | 1 | $144,429 | 20 | 4.80/5.0 |
| Joseph | 4 | $133,811 | 56 | 4.49/5.0 |
| Mary | 2 | $56,743 | 76 | 4.88/5.0 |
| Grant | 1 | $52,120 | 17 | 4.76/5.0 |
| Sarah | 2 | $47,768 | 49 | 4.80/5.0 |
| Home From Home | 6 | $47,707 | 18 | 2.29/5.0 |
| Nadia | 1 | $47,120 | 96 | 4.78/5.0 |
| Jane | 1 | $42,167 | 71 | 4.96/5.0 |
| Host #212822700 | 1 | $25,020 | 60 | 4.77/5.0 |
| Adam | 1 | $22,576 | 17 | 5.00/5.0 |
Analyzing the strategies of top hosts, such as their property selection, pricing, and guest communication, can offer valuable lessons for optimizing your own Airbnb operations in Ilston.
Dive Deeper: Advanced Ilston STR Market Data (2025)
Ready to unlock more insights? AirROI provides access to advanced metrics and comprehensive Airbnb data for Ilston. Explore detailed analytics beyond this report to refine your investment strategy, optimize pricing, and maximize your vacation rental profits.
Explore Advanced MetricsIlston Short-Term Rental Market Composition (2025): Property & Room Types
Room Type Distribution
Property Type Distribution
Market Composition Insights for Ilston
- The Ilston Airbnb market composition is heavily skewed towards Entire Home/Apt listings, which make up 100% of the 26 active rentals. This indicates strong guest preference for privacy and space.
- Looking at the property type distribution in Ilston, House properties are the most common (65.4%), reflecting the local real estate landscape.
- Houses represent a significant 65.4% portion, catering likely to families or larger groups.
- Smaller segments like others, unique stays (combined 7.6%) offer potential for unique stay experiences.
Ilston Airbnb Room Capacity Analysis (2025): Bedroom Distribution
Distribution of Listings by Number of Bedrooms
Room Capacity Insights for Ilston
- The dominant room capacity in Ilston is 1 bedroom listings, making up 42.3% of the market. This suggests a strong demand for properties suitable for couples or solo travelers.
- Together, 1 bedroom and 3 bedrooms properties represent 69.2% of the active Airbnb listings in Ilston, indicating a high concentration in these sizes.
- A significant 34.5% of listings offer 3+ bedrooms, catering to larger groups and families seeking more space in Ilston.
Ilston Vacation Rental Guest Capacity Trends (2025)
Distribution of Listings by Guest Capacity
Guest Capacity Insights for Ilston
- The most common guest capacity trend in Ilston vacation rentals is listings accommodating 2 guests (30.8%). This suggests the primary traveler segment is likely couples or solo travelers.
- Properties designed for 2 guests and 4 guests dominate the Ilston STR market, accounting for 57.7% of listings.
- 38.5% of properties accommodate 6+ guests, serving the market segment for larger families or group travel in Ilston.
- On average, properties in Ilston are equipped to host 4.5 guests.
Ilston Airbnb Booking Patterns (2025): Available vs. Booked Days
Available Days Distribution
Booked Days Distribution
Booking Pattern Insights for Ilston
- The most common availability pattern in Ilston falls within the 271-366 days range, representing 38.5% of listings. This suggests many properties have significant open periods on their calendars.
- Approximately 65.4% of listings show high availability (181+ days open annually), indicating potential for increased bookings or specific owner usage patterns.
- For booked days, the 181-270 days range is most frequent in Ilston (34.6%), reflecting common guest stay durations or potential owner blocking patterns.
- A notable 34.6% of properties secure long booking periods (181+ days booked per year), highlighting successful long-term rental strategies or significant owner usage.
Ilston Airbnb Minimum Stay Requirements Analysis
Distribution of Listings by Minimum Night Requirement
1 Night
6 listings
25% of total
2 Nights
8 listings
33.3% of total
3 Nights
7 listings
29.2% of total
4-6 Nights
2 listings
8.3% of total
30+ Nights
1 listings
4.2% of total
Key Insights
- The most prevalent minimum stay requirement in Ilston is 2 Nights, adopted by 33.3% of listings. This highlights the market's preference for shorter, flexible bookings.
Recommendations
- Align with the market by considering a 2 Nights minimum stay, as 33.3% of Ilston hosts use this setting.
- If feasible, allowing 1-night stays, especially midweek or during low season, could capture last-minute bookings, as only 25% currently do.
- Adjust minimum nights based on seasonality – potentially shorter during low season and longer during peak demand periods in Ilston.
Ilston Airbnb Cancellation Policy Trends Analysis (2025)
Super Strict 60 Days
6 listings
24% of total
Flexible
4 listings
16% of total
Moderate
3 listings
12% of total
Firm
4 listings
16% of total
Strict
8 listings
32% of total
Cancellation Policy Insights for Ilston
- The prevailing Airbnb cancellation policy trend in Ilston is Strict, used by 32% of listings.
- There's a relatively balanced mix between guest-friendly (28.0%) and stricter (48.0%) policies, offering choices for different guest needs.
Recommendations for Hosts
- Consider adopting a Strict policy to align with the 32% market standard in Ilston.
- With 32% using Strict terms, this is a viable option in Ilston, particularly for high-value properties or during peak demand periods.
- Regularly review your cancellation policy against competitors and market demand shifts in Ilston.
Ilston STR Booking Lead Time Analysis (2025)
Average Booking Lead Time by Month
Booking Lead Time Insights for Ilston
- The overall average booking lead time for vacation rentals in Ilston is 63 days.
- Guests book furthest in advance for stays during May (average 124 days), likely coinciding with peak travel demand or local events.
- The shortest booking windows occur for stays in November (average 33 days), indicating more last-minute travel plans during this time.
- Seasonally, Spring (90 days avg.) sees the longest lead times, while Fall (50 days avg.) has the shortest, reflecting typical travel planning cycles.
Recommendations for Hosts
- Use the overall average lead time (63 days) as a baseline for your pricing and availability strategy in Ilston.
- For May stays, consider implementing length-of-stay discounts or slightly higher rates for bookings made less than 124 days out to capitalize on advance planning.
- Target marketing efforts for the Spring season well in advance (at least 90 days) to capture early planners.
- Monitor your own booking lead times against these Ilston averages to identify opportunities for dynamic pricing adjustments.
Popular & Essential Airbnb Amenities in Ilston (2025)
Amenity Prevalence
Amenity Insights for Ilston
- Popular amenities like Heating, Smoke alarm, Cooking basics are common but not universal. Offering these can provide a competitive edge.
- Warning: Wifi is not universally provided but is considered essential globally. Ensure reliable Wifi is offered.
Recommendations for Hosts
- Consider adding popular differentiators like Heating or Smoke alarm to increase appeal.
- Highlight unique or less common amenities you offer (e.g., hot tub, dedicated workspace, EV charger) in your listing description and photos.
- Regularly check competitor amenities in Ilston to stay competitive.
Ilston Airbnb Guest Demographics & Profile Analysis (2025)
Guest Profile Summary for Ilston
- The typical guest profile for Airbnb in Ilston consists of primarily domestic travelers (94%), often arriving from nearby England, typically belonging to the Post-2000s (Gen Z/Alpha) group (50%), primarily speaking English or French.
- Domestic travelers account for 94.2% of guests.
- Key international markets include United Kingdom (94.2%) and United States (1.9%).
- Top languages spoken are English (69.4%) followed by French (11.1%).
- A significant demographic segment is the Post-2000s (Gen Z/Alpha) group, representing 50% of guests.
Recommendations for Hosts
- Target domestic marketing efforts towards travelers from England and London.
- Tailor amenities and listing descriptions to appeal to the dominant Post-2000s (Gen Z/Alpha) demographic (e.g., highlight fast WiFi, smart home features, local guides).
- Highlight unique local experiences or amenities relevant to the primary guest profile.
- Consider seasonal promotions aligned with peak travel times for key origin markets.
Nearby Short-Term Rental Market Comparison
How does the Ilston Airbnb market stack up against its neighbors? Compare key performance metrics like average monthly revenue, ADR, and occupancy rates in surrounding areas to understand the broader regional STR landscape.
| Market | Active Properties | Monthly Revenue | Daily Rate | Avg. Occupancy |
|---|---|---|---|---|
| Llanrhidian | 15 | $4,842 | $386.18 | 53% |
| Crai | 20 | $4,799 | $371.85 | 46% |
| Trenance | 19 | $4,795 | $428.63 | 43% |
| Angle | 13 | $4,602 | $384.81 | 42% |
| Abbeycwmhir | 10 | $4,502 | $259.18 | 49% |
| Ludchurch | 15 | $4,354 | $291.87 | 43% |
| Chirbury | 14 | $4,233 | $702.20 | 41% |
| Cwmann | 17 | $4,162 | $228.82 | 54% |
| Borth-y-Gêst | 18 | $4,139 | $240.51 | 55% |
| Redberth | 29 | $4,103 | $223.37 | 59% |