Hay on Wye Airbnb Market Analysis 2025: Short Term Rental Data & Vacation Rental Statistics in Wales, United Kingdom
Is Airbnb profitable in Hay on Wye in 2025? Explore comprehensive Airbnb analytics for Hay on Wye, Wales, United Kingdom to uncover income potential. This 2025 STR market report for Hay on Wye, based on AirROI data from April 2024 to March 2025, reveals key trends in the niche market of 56 active listings.
Whether you're considering an Airbnb investment in Hay on Wye, optimizing your existing vacation rental, or exploring rental arbitrage opportunities, understanding the Hay on Wye Airbnb data is crucial. Leveraging the low regulation environment is key to maximizing your short term rental income potential. Let's dive into the specifics.
Key Hay on Wye Airbnb Performance Metrics Overview
Monthly Airbnb Revenue Variations & Income Potential in Hay on Wye (2025)
Understanding the monthly revenue variations for Airbnb listings in Hay on Wye is key to maximizing your short term rental income potential. Seasonality significantly impacts earnings. Our analysis, based on data from the past 12 months, shows that the peak revenue month for STRs in Hay on Wye is typically May, while November often presents the lowest earnings, highlighting opportunities for strategic pricing adjustments during shoulder and low seasons. Explore the typical Airbnb income in Hay on Wye across different performance tiers:
- Best-in-class properties (Top 10%) achieve $5,090+ monthly, often utilizing dynamic pricing and superior guest experiences.
- Strong performing properties (Top 25%) earn $3,211 or more, indicating effective management and desirable locations/amenities.
- Typical properties (Median) generate around $2,061 per month, representing the average market performance.
- Entry-level properties (Bottom 25%) see earnings around $1,276, often with potential for optimization.
Average Monthly Airbnb Earnings Trend in Hay on Wye
Hay on Wye Airbnb Occupancy Rate Trends (2025)
Maximize your bookings by understanding the Hay on Wye STR occupancy trends. Seasonal demand shifts significantly influence how often properties are booked. Typically, Augustsees the highest demand (peak season occupancy), while January experiences the lowest (low season). Effective strategies, like adjusting minimum stays or offering promotions, can boost occupancy during slower periods. Here's how different property tiers perform in Hay on Wye:
- Best-in-class properties (Top 10%) achieve 83%+ occupancy, indicating high desirability and potentially optimized availability.
- Strong performing properties (Top 25%) maintain 69% or higher occupancy, suggesting good market fit and guest satisfaction.
- Typical properties (Median) have an occupancy rate around 50%.
- Entry-level properties (Bottom 25%) average 32% occupancy, potentially facing higher vacancy.
Average Monthly Occupancy Rate Trend in Hay on Wye
Average Daily Rate (ADR) Airbnb Trends in Hay on Wye (2025)
Effective short term rental pricing strategy in Hay on Wye involves understanding monthly ADR fluctuations. The Average Daily Rate (ADR) for Airbnb in Hay on Wye typically peaks in December and dips lowest during September. Leveraging Airbnb dynamic pricing tools or strategies based on this seasonality can significantly boost revenue. Here's a look at the typical nightly rates achieved:
- Best-in-class properties (Top 10%) command rates of $369+ per night, often due to premium features or locations.
- Strong performing properties (Top 25%) achieve nightly rates of $238 or more.
- Typical properties (Median) charge around $141 per night.
- Entry-level properties (Bottom 25%) earn around $107 per night.
Average Daily Rate (ADR) Trend by Month in Hay on Wye
Get Live Hay on Wye Market Intelligence 👇

Explore Real-time Analytics
Airbnb Seasonality Analysis & Trends in Hay on Wye (2025)
Peak Season (May, April, December)
- Revenue averages $2,999 per month
- Occupancy rates average 49.8%
- Daily rates average $200
Shoulder Season
- Revenue averages $2,737 per month
- Occupancy maintains around 52.2%
- Daily rates hold near $196
Low Season (March, September, November)
- Revenue drops to average $2,344 per month
- Occupancy decreases to average 48.1%
- Daily rates adjust to average $200
Seasonality Insights for Hay on Wye
- The Airbnb seasonality in Hay on Wye shows moderate seasonality with distinct peak and low periods. While the sections above show seasonal averages, it's also insightful to look at the extremes:
- During the high season, the absolute peak month showcases Hay on Wye's highest earning potential, with monthly revenues capable of climbing to $3,043, occupancy reaching a high of 61.6%, and ADRs peaking at $235.
- Conversely, the slowest single month of the year, typically falling within the low season, marks the market's lowest point. In this month, revenue might dip to $2,178, occupancy could drop to 41.6%, and ADRs may adjust down to $179.
- Understanding both the seasonal averages and these monthly peaks and troughs in revenue, occupancy, and ADR is crucial for maximizing your Airbnb profit potential in Hay on Wye.
Seasonal Strategies for Maximizing Profit
- Peak Season: Maximize revenue through premium pricing and potentially longer minimum stays. Ensure high availability.
- Low Season: Offer competitive pricing, special promotions (e.g., extended stay discounts), and flexible cancellation policies. Target off-season travelers like remote workers or budget-conscious guests.
- Shoulder Seasons: Implement dynamic pricing that balances peak and low rates. Target weekend travelers or specific events. Offer slightly more flexible terms than peak season.
- Regularly analyze your own performance against these Hay on Wye seasonality benchmarks and adjust your pricing and availability strategy accordingly.
Best Areas for Airbnb Investment in Hay on Wye (2025)
Exploring the top neighborhoods for short-term rentals in Hay on Wye? This section highlights key areas, outlining why they are attractive for hosts and guests, along with notable local attractions. Consider these locations based on your target guest profile and investment strategy.
| Neighborhood / Area | Why Host Here? (Target Guests & Appeal) | Key Attractions & Landmarks |
|---|---|---|
| Hay-on-Wye Town Centre | Known as the 'town of books', it attracts visitors for its numerous bookshops, literary festivals and vibrant arts scene. A prime location for tourists who appreciate literature and culture. | Hay Festival, Richard Booth's Bookshop, The Old Electric Shop, Hay Castle, The Globe at Hay |
| Whitney-on-Wye | A picturesque village located on the River Wye, perfect for nature lovers and those who enjoy outdoor activities such as hiking and canoeing. Ideal for guests seeking a tranquil retreat. | River Wye, Whitney Bridge, Canoeing and kayaking, Brecon Beacons National Park |
| Bredwardine | A charming village on the banks of the Wye, offering stunning countryside views. Appeals to visitors looking for a quiet getaway close to nature. | Bredwardine Church, River Wye walks, Local Wildlife |
| Clyro | Just a mile away from Hay-on-Wye, this village offers a peaceful atmosphere with great access to local hiking trails and scenic walking routes. | Clyro Castle, Riverside walks, Scenic countryside |
| Peterchurch | A small village with a historic church, it's a great base for exploring the Black Mountains and the Wye Valley. Attracts outdoor enthusiasts and history buffs. | Peterchurch Church, River Dore, Black Mountains |
| Dorstone | A tranquil village situated in a beautiful rural setting, attracting visitors for its scenic beauty and hiking paths. | Dorstone Hill, Walking trails, Local farms |
| Eardisley | A scenic village known for its beautiful landscapes and proximity to the Herefordshire Trail, popular among walkers and cyclists. | Eardisley Church, Herefordshire Trail, Wye Valley |
| Cranbrook | A charming and peaceful rural village perfect for guests looking for a serene escape amidst nature while still being close to Hay-on-Wye. | Local countryside, Historic sites, Nature walks |
Understanding Airbnb License Requirements & STR Laws in Hay on Wye (2025)
While Hay on Wye, Wales, United Kingdom currently shows low STR regulations, specific Airbnb license requirements might still exist or change. Always verify the latest short term rental regulations and Airbnb license requirements directly with local government authorities for Hay on Wye to ensure full compliance before hosting.
(Source: AirROI data, 2025, based on 2% licensed listings)
Top Performing Airbnb Properties in Hay on Wye (2025)
Benchmark your potential! Explore examples of top-performing Airbnb properties in Hay on Wyebased on Trailing Twelve Month (TTM) revenue. Analyze their characteristics, revenue, occupancy rate, and ADR to understand what drives success in this market.
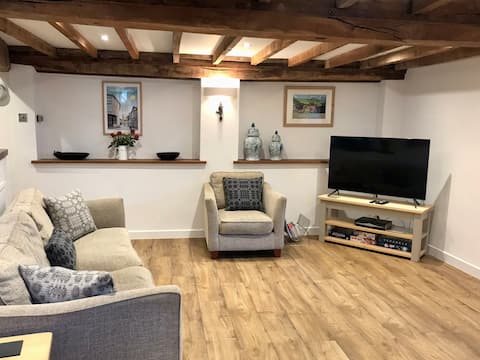
Hay on Wye Welsh Townhouse in town centre
Entire Place • 4 bedrooms

3 St Mary's Villas
Entire Place • 2 bedrooms
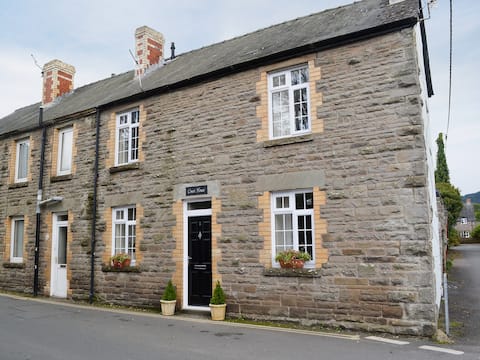
Court House
Entire Place • 4 bedrooms

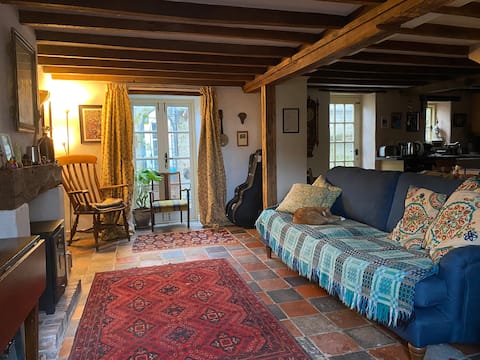
Ty Newydd. Spacious two bed in heart of Hay
Entire Place • 2 bedrooms

Dog Friendly 3 Bed Townhouse
Entire Place • 3 bedrooms
3 floor central house
Entire Place • 3 bedrooms
Note: Performance varies based on location, size, amenities, seasonality, and management quality. Data reflects the past 12 months.
Top Performing Airbnb Hosts in Hay on Wye (2025)
Learn from the best! This table showcases top-performing Airbnb hosts in Hay on Wye based on the number of properties managed and estimated total revenue over the past year. Analyze their scale and performance metrics.
| Host Name | Properties | Grossing Revenue | Stay Reviews | Avg Rating |
|---|---|---|---|---|
| Greg | 1 | $91,698 | 34 | 4.91/5.0 |
| Emma | 3 | $86,719 | 593 | 4.94/5.0 |
| Alison | 2 | $79,975 | 440 | 4.97/5.0 |
| Wales Cottage Holidays | 1 | $76,202 | 17 | 4.65/5.0 |
| Host #222199733 | 1 | $69,371 | 5 | 4.60/5.0 |
| Kate | 2 | $57,158 | 282 | 4.95/5.0 |
| Joanne | 3 | $56,522 | 327 | 4.69/5.0 |
| Sue | 1 | $51,630 | 70 | 4.90/5.0 |
| Rita | 2 | $35,981 | 190 | 2.49/5.0 |
| Ade | 1 | $35,897 | 19 | 4.95/5.0 |
Analyzing the strategies of top hosts, such as their property selection, pricing, and guest communication, can offer valuable lessons for optimizing your own Airbnb operations in Hay on Wye.
Dive Deeper: Advanced Hay on Wye STR Market Data (2025)
Ready to unlock more insights? AirROI provides access to advanced metrics and comprehensive Airbnb data for Hay on Wye. Explore detailed analytics beyond this report to refine your investment strategy, optimize pricing, and maximize your vacation rental profits.
Explore Advanced MetricsHay on Wye Short-Term Rental Market Composition (2025): Property & Room Types
Room Type Distribution
Property Type Distribution
Market Composition Insights for Hay on Wye
- The Hay on Wye Airbnb market composition is heavily skewed towards Entire Home/Apt listings, which make up 76.8% of the 56 active rentals. This indicates strong guest preference for privacy and space.
- Looking at the property type distribution in Hay on Wye, House properties are the most common (60.7%), reflecting the local real estate landscape.
- Houses represent a significant 60.7% portion, catering likely to families or larger groups.
- The presence of 5.4% Hotel/Boutique listings indicates integration with traditional hospitality.
- Smaller segments like outdoor/unique, others (combined 7.2%) offer potential for unique stay experiences.
Hay on Wye Airbnb Room Capacity Analysis (2025): Bedroom Distribution
Distribution of Listings by Number of Bedrooms
Room Capacity Insights for Hay on Wye
- The dominant room capacity in Hay on Wye is 1 bedroom listings, making up 33.9% of the market. This suggests a strong demand for properties suitable for couples or solo travelers.
- Together, 1 bedroom and 2 bedrooms properties represent 55.3% of the active Airbnb listings in Hay on Wye, indicating a high concentration in these sizes.
- A significant 21.4% of listings offer 3+ bedrooms, catering to larger groups and families seeking more space in Hay on Wye.
Hay on Wye Vacation Rental Guest Capacity Trends (2025)
Distribution of Listings by Guest Capacity
Guest Capacity Insights for Hay on Wye
- The most common guest capacity trend in Hay on Wye vacation rentals is listings accommodating 2 guests (32.1%). This suggests the primary traveler segment is likely couples or solo travelers.
- Properties designed for 2 guests and 4 guests dominate the Hay on Wye STR market, accounting for 55.3% of listings.
- 14.2% of properties accommodate 6+ guests, serving the market segment for larger families or group travel in Hay on Wye.
- On average, properties in Hay on Wye are equipped to host 3.2 guests.
Hay on Wye Airbnb Booking Patterns (2025): Available vs. Booked Days
Available Days Distribution
Booked Days Distribution
Booking Pattern Insights for Hay on Wye
- The most common availability pattern in Hay on Wye falls within the 91-180 days range, representing 35.7% of listings. This suggests many properties have significant open periods on their calendars.
- Approximately 55.4% of listings show high availability (181+ days open annually), indicating potential for increased bookings or specific owner usage patterns.
- For booked days, the 181-270 days range is most frequent in Hay on Wye (37.5%), reflecting common guest stay durations or potential owner blocking patterns.
- A notable 46.4% of properties secure long booking periods (181+ days booked per year), highlighting successful long-term rental strategies or significant owner usage.
Hay on Wye Airbnb Minimum Stay Requirements Analysis
Distribution of Listings by Minimum Night Requirement
1 Night
15 listings
27.3% of total
2 Nights
25 listings
45.5% of total
3 Nights
6 listings
10.9% of total
4-6 Nights
2 listings
3.6% of total
30+ Nights
7 listings
12.7% of total
Key Insights
- The most prevalent minimum stay requirement in Hay on Wye is 2 Nights, adopted by 45.5% of listings. This highlights the market's preference for shorter, flexible bookings.
- A strong majority (72.8%) of the Hay on Wye Airbnb data shows acceptance of very short stays (1-2 nights), indicating a dynamic, high-turnover market.
- A significant segment (12.7%) caters to monthly stays (30+ nights) in Hay on Wye, pointing to opportunities in the extended-stay market.
Recommendations
- Align with the market by considering a 2 Nights minimum stay, as 45.5% of Hay on Wye hosts use this setting.
- If feasible, allowing 1-night stays, especially midweek or during low season, could capture last-minute bookings, as only 27.3% currently do.
- Explore offering discounts for stays of 30+ nights to attract the 12.7% of the market seeking extended stays.
- Adjust minimum nights based on seasonality – potentially shorter during low season and longer during peak demand periods in Hay on Wye.
Hay on Wye Airbnb Cancellation Policy Trends Analysis (2025)
Super Strict 60 Days
2 listings
4% of total
Flexible
4 listings
8% of total
Moderate
16 listings
32% of total
Firm
8 listings
16% of total
Strict
20 listings
40% of total
Cancellation Policy Insights for Hay on Wye
- The prevailing Airbnb cancellation policy trend in Hay on Wye is Strict, used by 40% of listings.
- A majority (56.0%) of hosts in Hay on Wye utilize Firm or Strict policies, indicating a market where hosts prioritize booking security.
Recommendations for Hosts
- Consider adopting a Strict policy to align with the 40% market standard in Hay on Wye.
- With 40% using Strict terms, this is a viable option in Hay on Wye, particularly for high-value properties or during peak demand periods.
- Regularly review your cancellation policy against competitors and market demand shifts in Hay on Wye.
Hay on Wye STR Booking Lead Time Analysis (2025)
Average Booking Lead Time by Month
Booking Lead Time Insights for Hay on Wye
- The overall average booking lead time for vacation rentals in Hay on Wye is 72 days.
- Guests book furthest in advance for stays during May (average 134 days), likely coinciding with peak travel demand or local events.
- The shortest booking windows occur for stays in February (average 31 days), indicating more last-minute travel plans during this time.
- Seasonally, Spring (93 days avg.) sees the longest lead times, while Winter (39 days avg.) has the shortest, reflecting typical travel planning cycles.
Recommendations for Hosts
- Use the overall average lead time (72 days) as a baseline for your pricing and availability strategy in Hay on Wye.
- For May stays, consider implementing length-of-stay discounts or slightly higher rates for bookings made less than 134 days out to capitalize on advance planning.
- Target marketing efforts for the Spring season well in advance (at least 93 days) to capture early planners.
- Monitor your own booking lead times against these Hay on Wye averages to identify opportunities for dynamic pricing adjustments.
Popular & Essential Airbnb Amenities in Hay on Wye (2025)
Amenity Prevalence
Amenity Insights for Hay on Wye
- Essential amenities in Hay on Wye that guests expect include: Smoke alarm. Lacking these (this) could significantly impact bookings.
- Popular amenities like Heating, Hot water, Essentials are common but not universal. Offering these can provide a competitive edge.
- Warning: Wifi is not universally provided but is considered essential globally. Ensure reliable Wifi is offered.
Recommendations for Hosts
- Ensure your listing includes all essential amenities for Hay on Wye: Smoke alarm.
- Prioritize adding missing essentials: Smoke alarm.
- Consider adding popular differentiators like Heating or Hot water to increase appeal.
- Highlight unique or less common amenities you offer (e.g., hot tub, dedicated workspace, EV charger) in your listing description and photos.
- Regularly check competitor amenities in Hay on Wye to stay competitive.
Hay on Wye Airbnb Guest Demographics & Profile Analysis (2025)
Guest Profile Summary for Hay on Wye
- The typical guest profile for Airbnb in Hay on Wye consists of primarily domestic travelers (86%), often arriving from nearby England, typically belonging to the Post-2000s (Gen Z/Alpha) group (50%), primarily speaking English or French.
- Domestic travelers account for 85.5% of guests.
- Key international markets include United Kingdom (85.5%) and United States (5.1%).
- Top languages spoken are English (65.9%) followed by French (10.7%).
- A significant demographic segment is the Post-2000s (Gen Z/Alpha) group, representing 50% of guests.
Recommendations for Hosts
- Target domestic marketing efforts towards travelers from England and London.
- Tailor amenities and listing descriptions to appeal to the dominant Post-2000s (Gen Z/Alpha) demographic (e.g., highlight fast WiFi, smart home features, local guides).
- Highlight unique local experiences or amenities relevant to the primary guest profile.
- Consider seasonal promotions aligned with peak travel times for key origin markets.
Nearby Short-Term Rental Market Comparison
How does the Hay on Wye Airbnb market stack up against its neighbors? Compare key performance metrics like average monthly revenue, ADR, and occupancy rates in surrounding areas to understand the broader regional STR landscape.
| Market | Active Properties | Monthly Revenue | Daily Rate | Avg. Occupancy |
|---|---|---|---|---|
| Englishcombe | 13 | $8,558 | $573.69 | 49% |
| Chew Magna | 14 | $6,649 | $399.59 | 46% |
| Long Sutton | 17 | $5,726 | $383.88 | 46% |
| Stoke St. Michael | 10 | $5,277 | $424.04 | 42% |
| Oldland Common | 13 | $5,093 | $355.47 | 43% |
| Llanrhidian | 15 | $4,842 | $386.18 | 53% |
| Crai | 20 | $4,799 | $371.85 | 46% |
| Limpley Stoke | 10 | $4,598 | $523.47 | 52% |
| Abbeycwmhir | 10 | $4,502 | $259.19 | 49% |
| Ashley | 16 | $4,496 | $321.11 | 52% |