Dinas Cross Airbnb Market Analysis 2025: Short Term Rental Data & Vacation Rental Statistics in Wales, United Kingdom
Is Airbnb profitable in Dinas Cross in 2025? Explore comprehensive Airbnb analytics for Dinas Cross, Wales, United Kingdom to uncover income potential. This 2025 STR market report for Dinas Cross, based on AirROI data from April 2024 to March 2025, reveals key trends in the niche market of 32 active listings.
Whether you're considering an Airbnb investment in Dinas Cross, optimizing your existing vacation rental, or exploring rental arbitrage opportunities, understanding the Dinas Cross Airbnb data is crucial. Leveraging the low regulation environment is key to maximizing your short term rental income potential. Let's dive into the specifics.
Key Dinas Cross Airbnb Performance Metrics Overview
Monthly Airbnb Revenue Variations & Income Potential in Dinas Cross (2025)
Understanding the monthly revenue variations for Airbnb listings in Dinas Cross is key to maximizing your short term rental income potential. Seasonality significantly impacts earnings. Our analysis, based on data from the past 12 months, shows that the peak revenue month for STRs in Dinas Cross is typically August, while March often presents the lowest earnings, highlighting opportunities for strategic pricing adjustments during shoulder and low seasons. Explore the typical Airbnb income in Dinas Cross across different performance tiers:
- Best-in-class properties (Top 10%) achieve $5,002+ monthly, often utilizing dynamic pricing and superior guest experiences.
- Strong performing properties (Top 25%) earn $3,656 or more, indicating effective management and desirable locations/amenities.
- Typical properties (Median) generate around $2,341 per month, representing the average market performance.
- Entry-level properties (Bottom 25%) see earnings around $1,380, often with potential for optimization.
Average Monthly Airbnb Earnings Trend in Dinas Cross
Dinas Cross Airbnb Occupancy Rate Trends (2025)
Maximize your bookings by understanding the Dinas Cross STR occupancy trends. Seasonal demand shifts significantly influence how often properties are booked. Typically, Augustsees the highest demand (peak season occupancy), while December experiences the lowest (low season). Effective strategies, like adjusting minimum stays or offering promotions, can boost occupancy during slower periods. Here's how different property tiers perform in Dinas Cross:
- Best-in-class properties (Top 10%) achieve 81%+ occupancy, indicating high desirability and potentially optimized availability.
- Strong performing properties (Top 25%) maintain 68% or higher occupancy, suggesting good market fit and guest satisfaction.
- Typical properties (Median) have an occupancy rate around 40%.
- Entry-level properties (Bottom 25%) average 23% occupancy, potentially facing higher vacancy.
Average Monthly Occupancy Rate Trend in Dinas Cross
Average Daily Rate (ADR) Airbnb Trends in Dinas Cross (2025)
Effective short term rental pricing strategy in Dinas Cross involves understanding monthly ADR fluctuations. The Average Daily Rate (ADR) for Airbnb in Dinas Cross typically peaks in August and dips lowest during March. Leveraging Airbnb dynamic pricing tools or strategies based on this seasonality can significantly boost revenue. Here's a look at the typical nightly rates achieved:
- Best-in-class properties (Top 10%) command rates of $341+ per night, often due to premium features or locations.
- Strong performing properties (Top 25%) achieve nightly rates of $245 or more.
- Typical properties (Median) charge around $159 per night.
- Entry-level properties (Bottom 25%) earn around $112 per night.
Average Daily Rate (ADR) Trend by Month in Dinas Cross
Get Live Dinas Cross Market Intelligence 👇

Explore Real-time Analytics
Airbnb Seasonality Analysis & Trends in Dinas Cross (2025)
Peak Season (August, May, June)
- Revenue averages $4,283 per month
- Occupancy rates average 56.3%
- Daily rates average $242
Shoulder Season
- Revenue averages $2,515 per month
- Occupancy maintains around 42.8%
- Daily rates hold near $221
Low Season (January, March, November)
- Revenue drops to average $1,634 per month
- Occupancy decreases to average 38.5%
- Daily rates adjust to average $182
Seasonality Insights for Dinas Cross
- The Airbnb seasonality in Dinas Cross shows highly seasonal trends requiring careful strategy. While the sections above show seasonal averages, it's also insightful to look at the extremes:
- During the high season, the absolute peak month showcases Dinas Cross's highest earning potential, with monthly revenues capable of climbing to $5,309, occupancy reaching a high of 78.6%, and ADRs peaking at $247.
- Conversely, the slowest single month of the year, typically falling within the low season, marks the market's lowest point. In this month, revenue might dip to $1,555, occupancy could drop to 31.3%, and ADRs may adjust down to $181.
- Understanding both the seasonal averages and these monthly peaks and troughs in revenue, occupancy, and ADR is crucial for maximizing your Airbnb profit potential in Dinas Cross.
Seasonal Strategies for Maximizing Profit
- Peak Season: Maximize revenue through premium pricing and potentially longer minimum stays. Ensure high availability.
- Low Season: Offer competitive pricing, special promotions (e.g., extended stay discounts), and flexible cancellation policies. Target off-season travelers like remote workers or budget-conscious guests.
- Shoulder Seasons: Implement dynamic pricing that balances peak and low rates. Target weekend travelers or specific events. Offer slightly more flexible terms than peak season.
- Regularly analyze your own performance against these Dinas Cross seasonality benchmarks and adjust your pricing and availability strategy accordingly.
Best Areas for Airbnb Investment in Dinas Cross (2025)
Exploring the top neighborhoods for short-term rentals in Dinas Cross? This section highlights key areas, outlining why they are attractive for hosts and guests, along with notable local attractions. Consider these locations based on your target guest profile and investment strategy.
| Neighborhood / Area | Why Host Here? (Target Guests & Appeal) | Key Attractions & Landmarks |
|---|---|---|
| Abermawr Beach | A picturesque beach known for its stunning natural beauty and tranquil atmosphere. Great for families and outdoor enthusiasts seeking relaxation and adventure. | Abermawr Beach, Pembrokeshire Coast National Park, Cwm-yr-Eglwys Beach, Walking trails, Wildlife watching |
| Dinas Head | A prominent headland offering breathtaking views and fantastic hiking opportunities. Attracts hikers and nature lovers looking for scenic landscapes and coastal views. | Dinas Head walk, St. Non's Chapel, Porthgain Harbour, Pembrokeshire Coastal Path, Spectacular viewpoints |
| Fishguard | A charming coastal town with a rich maritime history. Ideal for visitors wanting to explore local culture, history, and access ferry services to Ireland. | Fishguard Bay, Welsh Famine Memorial, Fishguard Fort, Local shops and cafes, Historic architecture |
| Goodwick | A vibrant community with a lovely beach and access to boat services. Popular for its local charm and proximity to fishguard. | Goodwick Beach, Goodwick Heritage Centre, Bwlch Nant yr Arian Forest Visitor Centre, Coastal walks, Local eateries |
| Pwllgwaelod Beach | A small, family-friendly beach known for its safe swimming and beautiful surroundings. A hotspot for families and beach-goers. | Pwllgwaelod Beach, Water sports, Picnic areas, Coastal trails, Local cafes |
| Gwaun Valley | A hidden gem known for its lush greenery and peaceful rivers. Attracts those looking for a tranquil retreat in nature. | Gwaun Valley Walks, Local wildlife, Traditional pubs, Countryside views, Nature photography |
| Shirenewton | A quaint village offering a blend of rural charm and easy access to nearby attractions. Great for visitors looking to explore the Welsh countryside. | Local hiking trails, Historic churches, Parks, Welsh countryside, Charming local pubs |
| Trefin | A scenic village close to the coast, known for its artist community and vibrant culture. Perfect for those seeking artistic inspiration and coastal beauty. | Trefin Beach, Art galleries, Coastal walking paths, Community events, Local craft shops |
Understanding Airbnb License Requirements & STR Laws in Dinas Cross (2025)
While Dinas Cross, Wales, United Kingdom currently shows low STR regulations, specific Airbnb license requirements might still exist or change. Always verify the latest short term rental regulations and Airbnb license requirements directly with local government authorities for Dinas Cross to ensure full compliance before hosting.
(Source: AirROI data, 2025, finding no licensed listings among those analyzed)
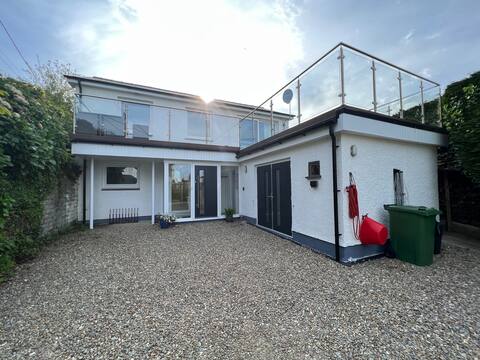
Top Performing Airbnb Properties in Dinas Cross (2025)
Benchmark your potential! Explore examples of top-performing Airbnb properties in Dinas Crossbased on Trailing Twelve Month (TTM) revenue. Analyze their characteristics, revenue, occupancy rate, and ADR to understand what drives success in this market.

Hen Ty Llaeth, Aberfforest, beachside & sea views
Entire Place • 4 bedrooms
Stunning House with Sea Views and 4 Car Parking
Entire Place • 4 bedrooms

Barnacle Cottage - 100 metres to the beach
Entire Place • 3 bedrooms

Crab Cottage - 100 metres to the beach
Entire Place • 3 bedrooms

Fforest Cottage - Newport
Entire Place • 4 bedrooms

Cosy cottage in a stunning location
Entire Place • 4 bedrooms
Note: Performance varies based on location, size, amenities, seasonality, and management quality. Data reflects the past 12 months.
Top Performing Airbnb Hosts in Dinas Cross (2025)
Learn from the best! This table showcases top-performing Airbnb hosts in Dinas Cross based on the number of properties managed and estimated total revenue over the past year. Analyze their scale and performance metrics.
| Host Name | Properties | Grossing Revenue | Stay Reviews | Avg Rating |
|---|---|---|---|---|
| Megan & Emma | 3 | $93,098 | 11 | 3.25/5.0 |
| Kathryn | 2 | $91,339 | 57 | 5.00/5.0 |
| Cottages | 2 | $58,707 | 14 | 4.79/5.0 |
| Moira | 1 | $56,817 | 14 | 4.93/5.0 |
| Rodrigo | 1 | $54,829 | 11 | 4.82/5.0 |
| Thomas | 1 | $38,581 | 184 | 4.76/5.0 |
| Dots | 2 | $31,544 | 13 | 2.46/5.0 |
| Owen | 1 | $31,290 | 11 | 5.00/5.0 |
| Martha | 1 | $28,766 | 17 | 4.94/5.0 |
| Kathryn | 1 | $27,959 | 198 | 4.95/5.0 |
Analyzing the strategies of top hosts, such as their property selection, pricing, and guest communication, can offer valuable lessons for optimizing your own Airbnb operations in Dinas Cross.
Dive Deeper: Advanced Dinas Cross STR Market Data (2025)
Ready to unlock more insights? AirROI provides access to advanced metrics and comprehensive Airbnb data for Dinas Cross. Explore detailed analytics beyond this report to refine your investment strategy, optimize pricing, and maximize your vacation rental profits.
Explore Advanced MetricsDinas Cross Short-Term Rental Market Composition (2025): Property & Room Types
Room Type Distribution
Property Type Distribution
Market Composition Insights for Dinas Cross
- The Dinas Cross Airbnb market composition is heavily skewed towards Entire Home/Apt listings, which make up 100% of the 32 active rentals. This indicates strong guest preference for privacy and space.
- Looking at the property type distribution in Dinas Cross, House properties are the most common (75%), reflecting the local real estate landscape.
- Houses represent a significant 75% portion, catering likely to families or larger groups.
Dinas Cross Airbnb Room Capacity Analysis (2025): Bedroom Distribution
Distribution of Listings by Number of Bedrooms
Room Capacity Insights for Dinas Cross
- The dominant room capacity in Dinas Cross is 2 bedrooms listings, making up 34.4% of the market. This suggests a strong demand for properties suitable for couples or solo travelers.
- Together, 2 bedrooms and 3 bedrooms properties represent 59.4% of the active Airbnb listings in Dinas Cross, indicating a high concentration in these sizes.
- A significant 50.0% of listings offer 3+ bedrooms, catering to larger groups and families seeking more space in Dinas Cross.
Dinas Cross Vacation Rental Guest Capacity Trends (2025)
Distribution of Listings by Guest Capacity
Guest Capacity Insights for Dinas Cross
- The most common guest capacity trend in Dinas Cross vacation rentals is listings accommodating 4 guests (28.1%). This suggests the primary traveler segment is likely small families or groups.
- Properties designed for 4 guests and 8+ guests dominate the Dinas Cross STR market, accounting for 50.0% of listings.
- 47.0% of properties accommodate 6+ guests, serving the market segment for larger families or group travel in Dinas Cross.
- On average, properties in Dinas Cross are equipped to host 5.1 guests.
Dinas Cross Airbnb Booking Patterns (2025): Available vs. Booked Days
Available Days Distribution
Booked Days Distribution
Booking Pattern Insights for Dinas Cross
- The most common availability pattern in Dinas Cross falls within the 181-270 days range, representing 37.5% of listings. This suggests many properties have significant open periods on their calendars.
- Approximately 68.8% of listings show high availability (181+ days open annually), indicating potential for increased bookings or specific owner usage patterns.
- For booked days, the 91-180 days range is most frequent in Dinas Cross (40.6%), reflecting common guest stay durations or potential owner blocking patterns.
- A notable 31.3% of properties secure long booking periods (181+ days booked per year), highlighting successful long-term rental strategies or significant owner usage.
Dinas Cross Airbnb Minimum Stay Requirements Analysis
Distribution of Listings by Minimum Night Requirement
1 Night
5 listings
15.6% of total
2 Nights
10 listings
31.3% of total
3 Nights
9 listings
28.1% of total
4-6 Nights
3 listings
9.4% of total
30+ Nights
5 listings
15.6% of total
Key Insights
- The most prevalent minimum stay requirement in Dinas Cross is 2 Nights, adopted by 31.3% of listings. This highlights the market's preference for shorter, flexible bookings.
- A significant segment (15.6%) caters to monthly stays (30+ nights) in Dinas Cross, pointing to opportunities in the extended-stay market.
Recommendations
- Align with the market by considering a 2 Nights minimum stay, as 31.3% of Dinas Cross hosts use this setting.
- If feasible, allowing 1-night stays, especially midweek or during low season, could capture last-minute bookings, as only 15.6% currently do.
- A 2-night minimum appears standard (31.3%). Consider this for weekends or peak periods.
- Explore offering discounts for stays of 30+ nights to attract the 15.6% of the market seeking extended stays.
- Adjust minimum nights based on seasonality – potentially shorter during low season and longer during peak demand periods in Dinas Cross.
Dinas Cross Airbnb Cancellation Policy Trends Analysis (2025)
Super Strict 30 Days
2 listings
6.9% of total
Super Strict 60 Days
2 listings
6.9% of total
Flexible
2 listings
6.9% of total
Moderate
6 listings
20.7% of total
Firm
12 listings
41.4% of total
Strict
5 listings
17.2% of total
Cancellation Policy Insights for Dinas Cross
- The prevailing Airbnb cancellation policy trend in Dinas Cross is Firm, used by 41.4% of listings.
- A majority (58.6%) of hosts in Dinas Cross utilize Firm or Strict policies, indicating a market where hosts prioritize booking security.
Recommendations for Hosts
- Consider adopting a Firm policy to align with the 41.4% market standard in Dinas Cross.
- Regularly review your cancellation policy against competitors and market demand shifts in Dinas Cross.
Dinas Cross STR Booking Lead Time Analysis (2025)
Average Booking Lead Time by Month
Booking Lead Time Insights for Dinas Cross
- The overall average booking lead time for vacation rentals in Dinas Cross is 47 days.
- Guests book furthest in advance for stays during May (average 102 days), likely coinciding with peak travel demand or local events.
- The shortest booking windows occur for stays in September (average 31 days), indicating more last-minute travel plans during this time.
- Seasonally, Spring (75 days avg.) sees the longest lead times, while Fall (36 days avg.) has the shortest, reflecting typical travel planning cycles.
Recommendations for Hosts
- Use the overall average lead time (47 days) as a baseline for your pricing and availability strategy in Dinas Cross.
- For May stays, consider implementing length-of-stay discounts or slightly higher rates for bookings made less than 102 days out to capitalize on advance planning.
- Target marketing efforts for the Spring season well in advance (at least 75 days) to capture early planners.
- Monitor your own booking lead times against these Dinas Cross averages to identify opportunities for dynamic pricing adjustments.
Popular & Essential Airbnb Amenities in Dinas Cross (2025)
Amenity Prevalence
Amenity Insights for Dinas Cross
- Essential amenities in Dinas Cross that guests expect include: Smoke alarm, TV, Wifi. Lacking these (any) could significantly impact bookings.
- Popular amenities like Kitchen, Heating, Carbon monoxide alarm are common but not universal. Offering these can provide a competitive edge.
Recommendations for Hosts
- Ensure your listing includes all essential amenities for Dinas Cross: Smoke alarm, TV, Wifi.
- Prioritize adding missing essentials: TV, Wifi.
- Consider adding popular differentiators like Kitchen or Heating to increase appeal.
- Highlight unique or less common amenities you offer (e.g., hot tub, dedicated workspace, EV charger) in your listing description and photos.
- Regularly check competitor amenities in Dinas Cross to stay competitive.
Dinas Cross Airbnb Guest Demographics & Profile Analysis (2025)
Guest Profile Summary for Dinas Cross
- The typical guest profile for Airbnb in Dinas Cross consists of primarily domestic travelers (93%), often arriving from nearby England, typically belonging to the Post-2000s (Gen Z/Alpha) group (50%), primarily speaking English or French.
- Domestic travelers account for 92.8% of guests.
- Key international markets include United Kingdom (92.8%) and United States (2.2%).
- Top languages spoken are English (67.6%) followed by French (8.6%).
- A significant demographic segment is the Post-2000s (Gen Z/Alpha) group, representing 50% of guests.
Recommendations for Hosts
- Target domestic marketing efforts towards travelers from England and London.
- Tailor amenities and listing descriptions to appeal to the dominant Post-2000s (Gen Z/Alpha) demographic (e.g., highlight fast WiFi, smart home features, local guides).
- Highlight unique local experiences or amenities relevant to the primary guest profile.
- Consider seasonal promotions aligned with peak travel times for key origin markets.
Nearby Short-Term Rental Market Comparison
How does the Dinas Cross Airbnb market stack up against its neighbors? Compare key performance metrics like average monthly revenue, ADR, and occupancy rates in surrounding areas to understand the broader regional STR landscape.
| Market | Active Properties | Monthly Revenue | Daily Rate | Avg. Occupancy |
|---|---|---|---|---|
| Llanrhidian | 15 | $4,842 | $386.18 | 53% |
| Crai | 20 | $4,799 | $371.85 | 46% |
| Angle | 13 | $4,602 | $384.81 | 42% |
| Abbeycwmhir | 10 | $4,502 | $259.18 | 49% |
| Eglwys-bach | 16 | $4,413 | $315.23 | 52% |
| Ludchurch | 15 | $4,354 | $291.87 | 43% |
| Chirbury | 14 | $4,233 | $702.20 | 41% |
| Cwmann | 17 | $4,162 | $228.82 | 54% |
| Borth-y-Gêst | 18 | $4,139 | $240.51 | 55% |
| Redberth | 29 | $4,103 | $223.37 | 59% |