Cowbridge Airbnb Market Analysis 2025: Short Term Rental Data & Vacation Rental Statistics in Wales, United Kingdom
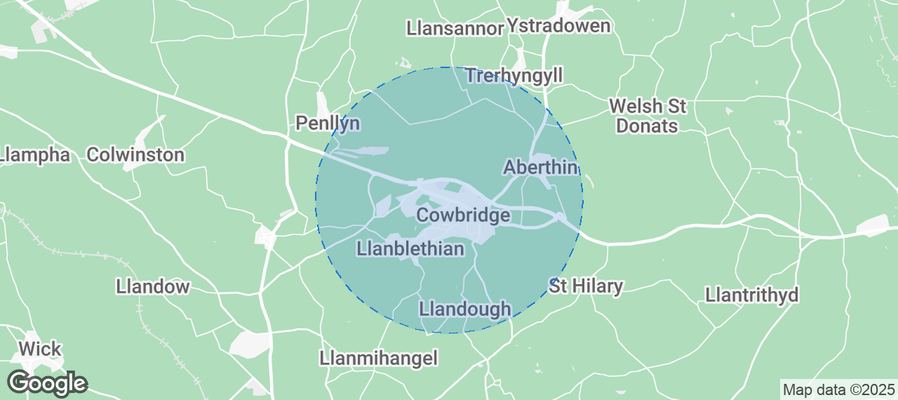
Is Airbnb profitable in Cowbridge in 2025? Explore comprehensive Airbnb analytics for Cowbridge, Wales, United Kingdom to uncover income potential. This 2025 STR market report for Cowbridge, based on AirROI data from April 2024 to March 2025, reveals key trends in the niche market of 21 active listings.
Whether you're considering an Airbnb investment in Cowbridge, optimizing your existing vacation rental, or exploring rental arbitrage opportunities, understanding the Cowbridge Airbnb data is crucial. Leveraging the low regulation environment is key to maximizing your short term rental income potential. Let's dive into the specifics.
Key Cowbridge Airbnb Performance Metrics Overview
Monthly Airbnb Revenue Variations & Income Potential in Cowbridge (2025)
Understanding the monthly revenue variations for Airbnb listings in Cowbridge is key to maximizing your short term rental income potential. Seasonality significantly impacts earnings. Our analysis, based on data from the past 12 months, shows that the peak revenue month for STRs in Cowbridge is typically April, while January often presents the lowest earnings, highlighting opportunities for strategic pricing adjustments during shoulder and low seasons. Explore the typical Airbnb income in Cowbridge across different performance tiers:
- Best-in-class properties (Top 10%) achieve $6,896+ monthly, often utilizing dynamic pricing and superior guest experiences.
- Strong performing properties (Top 25%) earn $3,319 or more, indicating effective management and desirable locations/amenities.
- Typical properties (Median) generate around $2,353 per month, representing the average market performance.
- Entry-level properties (Bottom 25%) see earnings around $1,078, often with potential for optimization.
Average Monthly Airbnb Earnings Trend in Cowbridge
Cowbridge Airbnb Occupancy Rate Trends (2025)
Maximize your bookings by understanding the Cowbridge STR occupancy trends. Seasonal demand shifts significantly influence how often properties are booked. Typically, Augustsees the highest demand (peak season occupancy), while May experiences the lowest (low season). Effective strategies, like adjusting minimum stays or offering promotions, can boost occupancy during slower periods. Here's how different property tiers perform in Cowbridge:
- Best-in-class properties (Top 10%) achieve 76%+ occupancy, indicating high desirability and potentially optimized availability.
- Strong performing properties (Top 25%) maintain 59% or higher occupancy, suggesting good market fit and guest satisfaction.
- Typical properties (Median) have an occupancy rate around 34%.
- Entry-level properties (Bottom 25%) average 17% occupancy, potentially facing higher vacancy.
Average Monthly Occupancy Rate Trend in Cowbridge
Average Daily Rate (ADR) Airbnb Trends in Cowbridge (2025)
Effective short term rental pricing strategy in Cowbridge involves understanding monthly ADR fluctuations. The Average Daily Rate (ADR) for Airbnb in Cowbridge typically peaks in December and dips lowest during April. Leveraging Airbnb dynamic pricing tools or strategies based on this seasonality can significantly boost revenue. Here's a look at the typical nightly rates achieved:
- Best-in-class properties (Top 10%) command rates of $898+ per night, often due to premium features or locations.
- Strong performing properties (Top 25%) achieve nightly rates of $249 or more.
- Typical properties (Median) charge around $168 per night.
- Entry-level properties (Bottom 25%) earn around $122 per night.
Average Daily Rate (ADR) Trend by Month in Cowbridge
Get Live Cowbridge Market Intelligence 👇
Explore Real-time Analytics
Airbnb Seasonality Analysis & Trends in Cowbridge (2025)
Peak Season (April, June, August)
- Revenue averages $5,795 per month
- Occupancy rates average 44.1%
- Daily rates average $308
Shoulder Season
- Revenue averages $3,616 per month
- Occupancy maintains around 39.9%
- Daily rates hold near $340
Low Season (January, February, March)
- Revenue drops to average $1,607 per month
- Occupancy decreases to average 38.8%
- Daily rates adjust to average $397
Seasonality Insights for Cowbridge
- The Airbnb seasonality in Cowbridge shows highly seasonal trends requiring careful strategy. While the sections above show seasonal averages, it's also insightful to look at the extremes:
- During the high season, the absolute peak month showcases Cowbridge's highest earning potential, with monthly revenues capable of climbing to $6,000, occupancy reaching a high of 52.8%, and ADRs peaking at $400.
- Conversely, the slowest single month of the year, typically falling within the low season, marks the market's lowest point. In this month, revenue might dip to $1,402, occupancy could drop to 30.6%, and ADRs may adjust down to $292.
- Understanding both the seasonal averages and these monthly peaks and troughs in revenue, occupancy, and ADR is crucial for maximizing your Airbnb profit potential in Cowbridge.
Seasonal Strategies for Maximizing Profit
- Peak Season: Maximize revenue through premium pricing and potentially longer minimum stays. Ensure high availability.
- Low Season: Offer competitive pricing, special promotions (e.g., extended stay discounts), and flexible cancellation policies. Target off-season travelers like remote workers or budget-conscious guests.
- Shoulder Seasons: Implement dynamic pricing that balances peak and low rates. Target weekend travelers or specific events. Offer slightly more flexible terms than peak season.
- Regularly analyze your own performance against these Cowbridge seasonality benchmarks and adjust your pricing and availability strategy accordingly.
Best Areas for Airbnb Investment in Cowbridge (2025)
Exploring the top neighborhoods for short-term rentals in Cowbridge? This section highlights key areas, outlining why they are attractive for hosts and guests, along with notable local attractions. Consider these locations based on your target guest profile and investment strategy.
| Neighborhood / Area | Why Host Here? (Target Guests & Appeal) | Key Attractions & Landmarks |
|---|---|---|
| Cowbridge Town Centre | The historic market town known for its charming streets, boutiques, and cafes. Popular with visitors seeking a traditional Welsh experience and local culture. | Cowbridge Physic Garden, Cowbridge Market, The Old Hall, St. Mary Church, Local pubs and eateries |
| Fonmon Castle | A beautiful historical landmark that attracts tourists and history enthusiasts. Great location for guests interested in Welsh heritage and countryside attractions. | Fonmon Castle, Castle grounds, Historic tours |
| The Vale of Glamorgan | A picturesque area featuring stunning countryside and coastal views. Ideal for those looking for outdoor activities and nature retreats. | Penarth Pier, Highlighting the Heritage Coast, Walking trails, Beaches and fishing spots |
| Cowbridge Wine Estate | An award-winning winery that attracts visitors for tours and tastings. Perfect for those who appreciate wine and the local gastronomy. | Wine tastings, Vineyard tours, Local events and festivals |
| Llangan | A nearby village offering a peaceful retreat with access to the countryside. Suitable for guests seeking tranquility and relaxation away from the city bustle. | Local parks, Walking trails, Village pubs |
| Dyffryn Gardens | A National Trust site featuring beautiful gardens and a historic house. Attracts visitors interested in horticulture and nature walks. | Dyffryn House, Gardens, Nature trails all year round |
| Barry Island | A popular beach and holiday destination, especially in summer. Ideal for families and beachgoers looking for a fun seaside experience. | Barry Island Pleasure Park, Beaches, Water sports, Coastal walks |
| St. Donats | A charming village known for its castle and coastal scenery. Attractive for visitors looking to explore the Welsh coast and historical sites. | St. Donat's Castle, Coastal paths, Cultural events |
Understanding Airbnb License Requirements & STR Laws in Cowbridge (2025)
While Cowbridge, Wales, United Kingdom currently shows low STR regulations, specific Airbnb license requirements might still exist or change. Always verify the latest short term rental regulations and Airbnb license requirements directly with local government authorities for Cowbridge to ensure full compliance before hosting.
(Source: AirROI data, 2025, finding no licensed listings among those analyzed)
Top Performing Airbnb Properties in Cowbridge (2025)
Benchmark your potential! Explore examples of top-performing Airbnb properties in Cowbridgebased on Trailing Twelve Month (TTM) revenue. Analyze their characteristics, revenue, occupancy rate, and ADR to understand what drives success in this market.

Llwynhelig House - UK46395
Entire Place • 6 bedrooms

12th Century Fairytale Castle
Entire Place • 7 bedrooms
Great country-style house with a courtyard
Entire Place • 2 bedrooms

The West Wing of a Luxury Gated House in Cowgridge
Entire Place • 2 bedrooms

Heart of Cowbridge. Stunning townhouse, sleeps 5
Entire Place • 3 bedrooms

Designer Studio in Central Cowbridge
Entire Place • N/A
Note: Performance varies based on location, size, amenities, seasonality, and management quality. Data reflects the past 12 months.
Top Performing Airbnb Hosts in Cowbridge (2025)
Learn from the best! This table showcases top-performing Airbnb hosts in Cowbridge based on the number of properties managed and estimated total revenue over the past year. Analyze their scale and performance metrics.
| Host Name | Properties | Grossing Revenue | Stay Reviews | Avg Rating |
|---|---|---|---|---|
| Cottages | 2 | $207,425 | 8 | 2.50/5.0 |
| Host #555843053 | 1 | $85,330 | 0 | 0.00/5.0 |
| Anita | 3 | $51,331 | 121 | 4.85/5.0 |
| Glyndwr | 2 | $51,169 | 144 | 4.77/5.0 |
| GuestReady | 1 | $44,548 | 73 | 4.88/5.0 |
| Denise | 1 | $39,596 | 115 | 4.98/5.0 |
| Dawn | 1 | $38,186 | 126 | 4.98/5.0 |
| Ann | 1 | $35,963 | 12 | 5.00/5.0 |
| Michele | 1 | $28,428 | 84 | 4.96/5.0 |
| Donald | 1 | $17,338 | 11 | 5.00/5.0 |
Analyzing the strategies of top hosts, such as their property selection, pricing, and guest communication, can offer valuable lessons for optimizing your own Airbnb operations in Cowbridge.
Dive Deeper: Advanced Cowbridge STR Market Data (2025)
Ready to unlock more insights? AirROI provides access to advanced metrics and comprehensive Airbnb data for Cowbridge. Explore detailed analytics beyond this report to refine your investment strategy, optimize pricing, and maximize your vacation rental profits.
Explore Advanced MetricsCowbridge Short-Term Rental Market Composition (2025): Property & Room Types
Room Type Distribution
Property Type Distribution
Market Composition Insights for Cowbridge
- The Cowbridge Airbnb market composition is heavily skewed towards Entire Home/Apt listings, which make up 100% of the 21 active rentals. This indicates strong guest preference for privacy and space.
- Looking at the property type distribution in Cowbridge, House properties are the most common (61.9%), reflecting the local real estate landscape.
- Houses represent a significant 61.9% portion, catering likely to families or larger groups.
- Smaller segments like apartment/condo, hotel/boutique, outdoor/unique (combined 14.4%) offer potential for unique stay experiences.
Cowbridge Airbnb Room Capacity Analysis (2025): Bedroom Distribution
Distribution of Listings by Number of Bedrooms
Room Capacity Insights for Cowbridge
- The dominant room capacity in Cowbridge is 1 bedroom listings, making up 33.3% of the market. This suggests a strong demand for properties suitable for couples or solo travelers.
- Together, 1 bedroom and 2 bedrooms properties represent 66.6% of the active Airbnb listings in Cowbridge, indicating a high concentration in these sizes.
- A significant 28.5% of listings offer 3+ bedrooms, catering to larger groups and families seeking more space in Cowbridge.
Cowbridge Vacation Rental Guest Capacity Trends (2025)
Distribution of Listings by Guest Capacity
Guest Capacity Insights for Cowbridge
- The most common guest capacity trend in Cowbridge vacation rentals is listings accommodating 4 guests (38.1%). This suggests the primary traveler segment is likely small families or groups.
- Properties designed for 4 guests and 2 guests dominate the Cowbridge STR market, accounting for 71.4% of listings.
- 23.8% of properties accommodate 6+ guests, serving the market segment for larger families or group travel in Cowbridge.
- On average, properties in Cowbridge are equipped to host 4.1 guests.
Cowbridge Airbnb Booking Patterns (2025): Available vs. Booked Days
Available Days Distribution
Booked Days Distribution
Booking Pattern Insights for Cowbridge
- The most common availability pattern in Cowbridge falls within the 271-366 days range, representing 52.4% of listings. This suggests many properties have significant open periods on their calendars.
- Approximately 76.2% of listings show high availability (181+ days open annually), indicating potential for increased bookings or specific owner usage patterns.
- For booked days, the 31-90 days range is most frequent in Cowbridge (38.1%), reflecting common guest stay durations or potential owner blocking patterns.
- A notable 28.5% of properties secure long booking periods (181+ days booked per year), highlighting successful long-term rental strategies or significant owner usage.
Cowbridge Airbnb Minimum Stay Requirements Analysis
Distribution of Listings by Minimum Night Requirement
1 Night
5 listings
29.4% of total
2 Nights
5 listings
29.4% of total
3 Nights
1 listings
5.9% of total
4-6 Nights
1 listings
5.9% of total
7-29 Nights
1 listings
5.9% of total
30+ Nights
4 listings
23.5% of total
Key Insights
- The most prevalent minimum stay requirement in Cowbridge is 1 Night, adopted by 29.4% of listings. This highlights the market's preference for shorter, flexible bookings.
- A significant segment (23.5%) caters to monthly stays (30+ nights) in Cowbridge, pointing to opportunities in the extended-stay market.
Recommendations
- Align with the market by considering a 1 Night minimum stay, as 29.4% of Cowbridge hosts use this setting.
- If feasible, allowing 1-night stays, especially midweek or during low season, could capture last-minute bookings, as only 29.4% currently do.
- Explore offering discounts for stays of 30+ nights to attract the 23.5% of the market seeking extended stays.
- Adjust minimum nights based on seasonality – potentially shorter during low season and longer during peak demand periods in Cowbridge.
Cowbridge Airbnb Cancellation Policy Trends Analysis (2025)
Super Strict 60 Days
2 listings
11.1% of total
Flexible
4 listings
22.2% of total
Moderate
4 listings
22.2% of total
Firm
3 listings
16.7% of total
Strict
5 listings
27.8% of total
Cancellation Policy Insights for Cowbridge
- The prevailing Airbnb cancellation policy trend in Cowbridge is Strict, used by 27.8% of listings.
- There's a relatively balanced mix between guest-friendly (44.4%) and stricter (44.5%) policies, offering choices for different guest needs.
Recommendations for Hosts
- Consider adopting a Strict policy to align with the 27.8% market standard in Cowbridge.
- Regularly review your cancellation policy against competitors and market demand shifts in Cowbridge.
Cowbridge STR Booking Lead Time Analysis (2025)
Average Booking Lead Time by Month
Booking Lead Time Insights for Cowbridge
- The overall average booking lead time for vacation rentals in Cowbridge is 50 days.
- Guests book furthest in advance for stays during July (average 92 days), likely coinciding with peak travel demand or local events.
- The shortest booking windows occur for stays in January (average 14 days), indicating more last-minute travel plans during this time.
- Seasonally, Summer (74 days avg.) sees the longest lead times, while Winter (37 days avg.) has the shortest, reflecting typical travel planning cycles.
Recommendations for Hosts
- Use the overall average lead time (50 days) as a baseline for your pricing and availability strategy in Cowbridge.
- For July stays, consider implementing length-of-stay discounts or slightly higher rates for bookings made less than 92 days out to capitalize on advance planning.
- During January, focus on last-minute booking availability and promotions, as guests book with very short notice (14 days avg.).
- Target marketing efforts for the Summer season well in advance (at least 74 days) to capture early planners.
- Monitor your own booking lead times against these Cowbridge averages to identify opportunities for dynamic pricing adjustments.
Popular & Essential Airbnb Amenities in Cowbridge (2025)
Amenity Prevalence
Amenity Insights for Cowbridge
- Essential amenities in Cowbridge that guests expect include: Smoke alarm, Heating, Wifi, Hot water, TV. Lacking these (any) could significantly impact bookings.
- Popular amenities like Kitchen, Essentials, Hangers are common but not universal. Offering these can provide a competitive edge.
Recommendations for Hosts
- Ensure your listing includes all essential amenities for Cowbridge: Smoke alarm, Heating, Wifi, Hot water, TV.
- Prioritize adding missing essentials: Hot water, TV.
- Consider adding popular differentiators like Kitchen or Essentials to increase appeal.
- Highlight unique or less common amenities you offer (e.g., hot tub, dedicated workspace, EV charger) in your listing description and photos.
- Regularly check competitor amenities in Cowbridge to stay competitive.
Cowbridge Airbnb Guest Demographics & Profile Analysis (2025)
Guest Profile Summary for Cowbridge
- The typical guest profile for Airbnb in Cowbridge consists of primarily domestic travelers (88%), often arriving from nearby England, typically belonging to the Post-2000s (Gen Z/Alpha) group (50%), primarily speaking English or French.
- Domestic travelers account for 87.8% of guests.
- Key international markets include United Kingdom (87.8%) and United States (6.4%).
- Top languages spoken are English (73.3%) followed by French (7%).
- A significant demographic segment is the Post-2000s (Gen Z/Alpha) group, representing 50% of guests.
Recommendations for Hosts
- Target domestic marketing efforts towards travelers from England and London.
- Tailor amenities and listing descriptions to appeal to the dominant Post-2000s (Gen Z/Alpha) demographic (e.g., highlight fast WiFi, smart home features, local guides).
- Highlight unique local experiences or amenities relevant to the primary guest profile.
- Consider seasonal promotions aligned with peak travel times for key origin markets.
Nearby Short-Term Rental Market Comparison
How does the Cowbridge Airbnb market stack up against its neighbors? Compare key performance metrics like average monthly revenue, ADR, and occupancy rates in surrounding areas to understand the broader regional STR landscape.
| Market | Active Properties | Monthly Revenue | Daily Rate | Avg. Occupancy |
|---|---|---|---|---|
| Englishcombe | 13 | $8,558 | $573.69 | 49% |
| Chew Magna | 14 | $6,649 | $399.59 | 46% |
| Long Sutton | 17 | $5,726 | $383.88 | 46% |
| Stoke St. Michael | 10 | $5,277 | $424.04 | 42% |
| Winsham | 10 | $5,154 | $484.22 | 52% |
| Oldland Common | 13 | $5,093 | $355.47 | 43% |
| Llanrhidian | 15 | $4,842 | $386.18 | 53% |
| Crai | 20 | $4,799 | $371.85 | 46% |
| Limpley Stoke | 10 | $4,598 | $523.47 | 52% |
| Abbeycwmhir | 10 | $4,502 | $259.18 | 49% |