Bridgend Airbnb Market Analysis 2025: Short Term Rental Data & Vacation Rental Statistics in Wales, United Kingdom
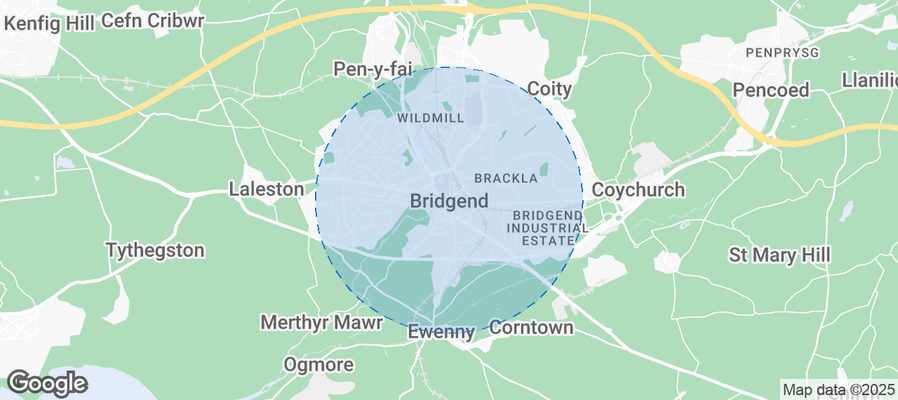
Is Airbnb profitable in Bridgend in 2025? Explore comprehensive Airbnb analytics for Bridgend, Wales, United Kingdom to uncover income potential. This 2025 STR market report for Bridgend, based on AirROI data from April 2024 to March 2025, reveals key trends in the niche market of 21 active listings.
Whether you're considering an Airbnb investment in Bridgend, optimizing your existing vacation rental, or exploring rental arbitrage opportunities, understanding the Bridgend Airbnb data is crucial. Leveraging the low regulation environment is key to maximizing your short term rental income potential. Let's dive into the specifics.
Key Bridgend Airbnb Performance Metrics Overview
Monthly Airbnb Revenue Variations & Income Potential in Bridgend (2025)
Understanding the monthly revenue variations for Airbnb listings in Bridgend is key to maximizing your short term rental income potential. Seasonality significantly impacts earnings. Our analysis, based on data from the past 12 months, shows that the peak revenue month for STRs in Bridgend is typically May, while September often presents the lowest earnings, highlighting opportunities for strategic pricing adjustments during shoulder and low seasons. Explore the typical Airbnb income in Bridgend across different performance tiers:
- Best-in-class properties (Top 10%) achieve $3,689+ monthly, often utilizing dynamic pricing and superior guest experiences.
- Strong performing properties (Top 25%) earn $2,559 or more, indicating effective management and desirable locations/amenities.
- Typical properties (Median) generate around $1,410 per month, representing the average market performance.
- Entry-level properties (Bottom 25%) see earnings around $709, often with potential for optimization.
Average Monthly Airbnb Earnings Trend in Bridgend
Bridgend Airbnb Occupancy Rate Trends (2025)
Maximize your bookings by understanding the Bridgend STR occupancy trends. Seasonal demand shifts significantly influence how often properties are booked. Typically, Novembersees the highest demand (peak season occupancy), while May experiences the lowest (low season). Effective strategies, like adjusting minimum stays or offering promotions, can boost occupancy during slower periods. Here's how different property tiers perform in Bridgend:
- Best-in-class properties (Top 10%) achieve 80%+ occupancy, indicating high desirability and potentially optimized availability.
- Strong performing properties (Top 25%) maintain 71% or higher occupancy, suggesting good market fit and guest satisfaction.
- Typical properties (Median) have an occupancy rate around 43%.
- Entry-level properties (Bottom 25%) average 27% occupancy, potentially facing higher vacancy.
Average Monthly Occupancy Rate Trend in Bridgend
Average Daily Rate (ADR) Airbnb Trends in Bridgend (2025)
Effective short term rental pricing strategy in Bridgend involves understanding monthly ADR fluctuations. The Average Daily Rate (ADR) for Airbnb in Bridgend typically peaks in December and dips lowest during April. Leveraging Airbnb dynamic pricing tools or strategies based on this seasonality can significantly boost revenue. Here's a look at the typical nightly rates achieved:
- Best-in-class properties (Top 10%) command rates of $216+ per night, often due to premium features or locations.
- Strong performing properties (Top 25%) achieve nightly rates of $174 or more.
- Typical properties (Median) charge around $100 per night.
- Entry-level properties (Bottom 25%) earn around $60 per night.
Average Daily Rate (ADR) Trend by Month in Bridgend
Get Live Bridgend Market Intelligence 👇
Explore Real-time Analytics
Airbnb Seasonality Analysis & Trends in Bridgend (2025)
Peak Season (May, July, December)
- Revenue averages $2,077 per month
- Occupancy rates average 47.0%
- Daily rates average $132
Shoulder Season
- Revenue averages $1,775 per month
- Occupancy maintains around 48.1%
- Daily rates hold near $131
Low Season (February, April, September)
- Revenue drops to average $1,584 per month
- Occupancy decreases to average 45.5%
- Daily rates adjust to average $129
Seasonality Insights for Bridgend
- The Airbnb seasonality in Bridgend shows moderate seasonality with distinct peak and low periods. While the sections above show seasonal averages, it's also insightful to look at the extremes:
- During the high season, the absolute peak month showcases Bridgend's highest earning potential, with monthly revenues capable of climbing to $2,148, occupancy reaching a high of 59.7%, and ADRs peaking at $144.
- Conversely, the slowest single month of the year, typically falling within the low season, marks the market's lowest point. In this month, revenue might dip to $1,539, occupancy could drop to 37.1%, and ADRs may adjust down to $125.
- Understanding both the seasonal averages and these monthly peaks and troughs in revenue, occupancy, and ADR is crucial for maximizing your Airbnb profit potential in Bridgend.
Seasonal Strategies for Maximizing Profit
- Peak Season: Maximize revenue through premium pricing and potentially longer minimum stays. Ensure high availability.
- Low Season: Offer competitive pricing, special promotions (e.g., extended stay discounts), and flexible cancellation policies. Target off-season travelers like remote workers or budget-conscious guests.
- Shoulder Seasons: Implement dynamic pricing that balances peak and low rates. Target weekend travelers or specific events. Offer slightly more flexible terms than peak season.
- Regularly analyze your own performance against these Bridgend seasonality benchmarks and adjust your pricing and availability strategy accordingly.
Best Areas for Airbnb Investment in Bridgend (2025)
Exploring the top neighborhoods for short-term rentals in Bridgend? This section highlights key areas, outlining why they are attractive for hosts and guests, along with notable local attractions. Consider these locations based on your target guest profile and investment strategy.
| Neighborhood / Area | Why Host Here? (Target Guests & Appeal) | Key Attractions & Landmarks |
|---|---|---|
| Porthcawl | Popular coastal town known for its beautiful beaches and vibrant seaside promenade. Ideal for families and tourists looking for a beach getaway with plenty of amenities. | Rest Bay, Coney Beach, Traeth y Wrach, Cwm Nash Beach, Porthcawl Harbour |
| Bridgend Town Centre | The heart of Bridgend, offering a mixture of shopping, dining, and entertainment. Great for guests looking for convenience and access to local culture. | The Grand Pavilion, Bridgend Shopping Centre, Newcastle Castle, St. John's House, Bryngarw Country Park |
| Ogmore-by-Sea | Quaint seaside village known for its stunning natural beauty and outdoor activities. Attracts nature lovers and those seeking a peaceful retreat. | Ogmore Castle, Ogmore Beach, Merthyr Mawr Sand Dunes, River Ogmore, Walking trails |
| Sarn | Residential area with access to local amenities and good transport links. Suitable for travelers wanting a quiet place with easy access to Bridgend and surrounding areas. | Sarn Park, Ebenezer Baptist Church, Local shops and cafes |
| Cornelly | A village close to Porthcawl and the coast, offering a more rural charm but within reach of the seaside attractions. | Cornelly Church, Local parks, Easy access to Porthcawl attractions |
| Coychurch | A picturesque village with historical sites and countryside charm, appealing to those who appreciate a quieter environment near Bridgend. | St. Mary's Church, Coychurch Common, Local walking trails |
| Treforest | A vibrant area with a mix of residential and commercial properties, popular with students and young professionals due to its proximity to the university. | University of South Wales, Treforest Industrial Estate, Local shops |
| Bridgend Industrial Estate | Home to numerous businesses and industries, making it a great location for business travelers looking for accommodation near their workplaces. | Local businesses, Transport links, Amenities for business travelers |
Understanding Airbnb License Requirements & STR Laws in Bridgend (2025)
While Bridgend, Wales, United Kingdom currently shows low STR regulations, specific Airbnb license requirements might still exist or change. Always verify the latest short term rental regulations and Airbnb license requirements directly with local government authorities for Bridgend to ensure full compliance before hosting.
(Source: AirROI data, 2025, finding no licensed listings among those analyzed)
Top Performing Airbnb Properties in Bridgend (2025)
Benchmark your potential! Explore examples of top-performing Airbnb properties in Bridgendbased on Trailing Twelve Month (TTM) revenue. Analyze their characteristics, revenue, occupancy rate, and ADR to understand what drives success in this market.

4-Bedrooms - Perfect for those working in Bridgend
Entire Place • 4 bedrooms
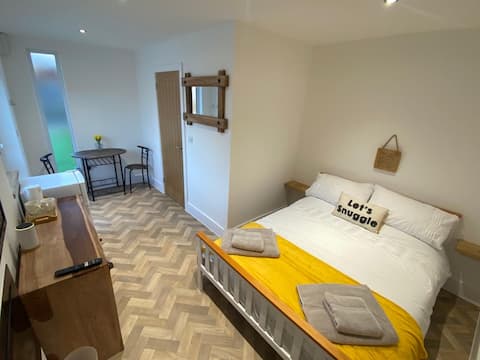
Modern, self-contained accommodation Bridgend
Entire Place • 1 bedroom

Heronston Barn - Cosy 2 bed Cottage
Entire Place • 2 bedrooms

Chic Edwardian House, Bridgend
Entire Place • 3 bedrooms
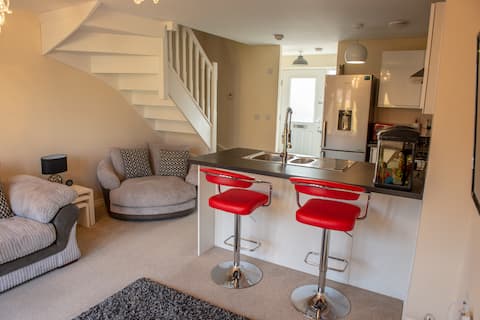
Modern 2 Bedroom House (5L)
Entire Place • 2 bedrooms
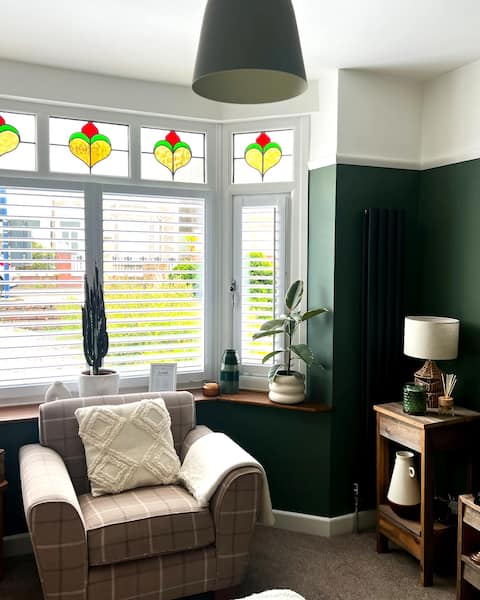
The Stained Glass Heart - Modern 3 Bed Home
Entire Place • 2 bedrooms
Note: Performance varies based on location, size, amenities, seasonality, and management quality. Data reflects the past 12 months.
Top Performing Airbnb Hosts in Bridgend (2025)
Learn from the best! This table showcases top-performing Airbnb hosts in Bridgend based on the number of properties managed and estimated total revenue over the past year. Analyze their scale and performance metrics.
| Host Name | Properties | Grossing Revenue | Stay Reviews | Avg Rating |
|---|---|---|---|---|
| Tailored Accommodation | 1 | $49,565 | 4 | 4.00/5.0 |
| Sean | 1 | $24,005 | 94 | 4.86/5.0 |
| Sarah | 1 | $23,150 | 12 | 5.00/5.0 |
| Hassan | 1 | $22,994 | 8 | 4.75/5.0 |
| Emma | 1 | $22,531 | 15 | 4.67/5.0 |
| Lucy | 1 | $22,217 | 12 | 4.92/5.0 |
| Lyn | 1 | $21,625 | 70 | 5.00/5.0 |
| Nicole | 1 | $20,441 | 87 | 4.83/5.0 |
| Andrew | 1 | $19,308 | 106 | 4.72/5.0 |
| Mair | 2 | $18,759 | 193 | 4.99/5.0 |
Analyzing the strategies of top hosts, such as their property selection, pricing, and guest communication, can offer valuable lessons for optimizing your own Airbnb operations in Bridgend.
Dive Deeper: Advanced Bridgend STR Market Data (2025)
Ready to unlock more insights? AirROI provides access to advanced metrics and comprehensive Airbnb data for Bridgend. Explore detailed analytics beyond this report to refine your investment strategy, optimize pricing, and maximize your vacation rental profits.
Explore Advanced MetricsBridgend Short-Term Rental Market Composition (2025): Property & Room Types
Room Type Distribution
Property Type Distribution
Market Composition Insights for Bridgend
- The Bridgend Airbnb market composition is heavily skewed towards Entire Home/Apt listings, which make up 71.4% of the 21 active rentals. This indicates strong guest preference for privacy and space.
- Looking at the property type distribution in Bridgend, House properties are the most common (57.1%), reflecting the local real estate landscape.
- Houses represent a significant 57.1% portion, catering likely to families or larger groups.
- The presence of 9.5% Hotel/Boutique listings indicates integration with traditional hospitality.
Bridgend Airbnb Room Capacity Analysis (2025): Bedroom Distribution
Distribution of Listings by Number of Bedrooms
Room Capacity Insights for Bridgend
- The dominant room capacity in Bridgend is 2 bedrooms listings, making up 38.1% of the market. This suggests a strong demand for properties suitable for couples or solo travelers.
- Together, 2 bedrooms and 1 bedroom properties represent 66.7% of the active Airbnb listings in Bridgend, indicating a high concentration in these sizes.
Bridgend Vacation Rental Guest Capacity Trends (2025)
Distribution of Listings by Guest Capacity
Guest Capacity Insights for Bridgend
- The most common guest capacity trend in Bridgend vacation rentals is listings accommodating 2 guests (23.8%). This suggests the primary traveler segment is likely couples or solo travelers.
- Properties designed for 2 guests and 4 guests dominate the Bridgend STR market, accounting for 42.8% of listings.
- 28.6% of properties accommodate 6+ guests, serving the market segment for larger families or group travel in Bridgend.
- On average, properties in Bridgend are equipped to host 3.5 guests.
Bridgend Airbnb Booking Patterns (2025): Available vs. Booked Days
Available Days Distribution
Booked Days Distribution
Booking Pattern Insights for Bridgend
- The most common availability pattern in Bridgend falls within the 91-180 days range, representing 33.3% of listings. This suggests many properties have significant open periods on their calendars.
- Approximately 61.9% of listings show high availability (181+ days open annually), indicating potential for increased bookings or specific owner usage patterns.
- For booked days, the 181-270 days range is most frequent in Bridgend (33.3%), reflecting common guest stay durations or potential owner blocking patterns.
- A notable 38.1% of properties secure long booking periods (181+ days booked per year), highlighting successful long-term rental strategies or significant owner usage.
Bridgend Airbnb Minimum Stay Requirements Analysis
Distribution of Listings by Minimum Night Requirement
1 Night
5 listings
27.8% of total
2 Nights
9 listings
50% of total
3 Nights
1 listings
5.6% of total
4-6 Nights
2 listings
11.1% of total
30+ Nights
1 listings
5.6% of total
Key Insights
- The most prevalent minimum stay requirement in Bridgend is 2 Nights, adopted by 50% of listings. This highlights the market's preference for shorter, flexible bookings.
- A strong majority (77.8%) of the Bridgend Airbnb data shows acceptance of very short stays (1-2 nights), indicating a dynamic, high-turnover market.
Recommendations
- Align with the market by considering a 2 Nights minimum stay, as 50% of Bridgend hosts use this setting.
- If feasible, allowing 1-night stays, especially midweek or during low season, could capture last-minute bookings, as only 27.8% currently do.
- Explore offering discounts for stays of 30+ nights to attract the 5.6% of the market seeking extended stays.
- Adjust minimum nights based on seasonality – potentially shorter during low season and longer during peak demand periods in Bridgend.
Bridgend Airbnb Cancellation Policy Trends Analysis (2025)
Flexible
9 listings
50% of total
Moderate
5 listings
27.8% of total
Firm
1 listings
5.6% of total
Strict
3 listings
16.7% of total
Cancellation Policy Insights for Bridgend
- The prevailing Airbnb cancellation policy trend in Bridgend is Flexible, used by 50% of listings.
- The market strongly favors guest-friendly terms, with 77.8% of listings offering Flexible or Moderate policies. This suggests guests in Bridgend may expect booking flexibility.
Recommendations for Hosts
- Consider adopting a Flexible policy to align with the 50% market standard in Bridgend.
- Regularly review your cancellation policy against competitors and market demand shifts in Bridgend.
Bridgend STR Booking Lead Time Analysis (2025)
Average Booking Lead Time by Month
Booking Lead Time Insights for Bridgend
- The overall average booking lead time for vacation rentals in Bridgend is 65 days.
- Guests book furthest in advance for stays during September (average 87 days), likely coinciding with peak travel demand or local events.
- The shortest booking windows occur for stays in November (average 36 days), indicating more last-minute travel plans during this time.
- Seasonally, Summer (71 days avg.) sees the longest lead times, while Winter (57 days avg.) has the shortest, reflecting typical travel planning cycles.
Recommendations for Hosts
- Use the overall average lead time (65 days) as a baseline for your pricing and availability strategy in Bridgend.
- For September stays, consider implementing length-of-stay discounts or slightly higher rates for bookings made less than 87 days out to capitalize on advance planning.
- Target marketing efforts for the Summer season well in advance (at least 71 days) to capture early planners.
- Monitor your own booking lead times against these Bridgend averages to identify opportunities for dynamic pricing adjustments.
Popular & Essential Airbnb Amenities in Bridgend (2025)
Amenity Prevalence
Amenity Insights for Bridgend
- Essential amenities in Bridgend that guests expect include: TV, Heating, Wifi, Kitchen, Refrigerator, Smoke alarm. Lacking these (any) could significantly impact bookings.
- Popular amenities like Dishes and silverware, Hangers, Essentials are common but not universal. Offering these can provide a competitive edge.
Recommendations for Hosts
- Ensure your listing includes all essential amenities for Bridgend: TV, Heating, Wifi, Kitchen, Refrigerator, Smoke alarm.
- Prioritize adding missing essentials: Kitchen, Refrigerator, Smoke alarm.
- Consider adding popular differentiators like Dishes and silverware or Hangers to increase appeal.
- Highlight unique or less common amenities you offer (e.g., hot tub, dedicated workspace, EV charger) in your listing description and photos.
- Regularly check competitor amenities in Bridgend to stay competitive.
Bridgend Airbnb Guest Demographics & Profile Analysis (2025)
Guest Profile Summary for Bridgend
- The typical guest profile for Airbnb in Bridgend consists of primarily domestic travelers (84%), often arriving from nearby England, typically belonging to the Post-2000s (Gen Z/Alpha) group (50%), primarily speaking English or French.
- Domestic travelers account for 84.0% of guests.
- Key international markets include United Kingdom (84%) and Australia (6%).
- Top languages spoken are English (70.8%) followed by French (5.6%).
- A significant demographic segment is the Post-2000s (Gen Z/Alpha) group, representing 50% of guests.
Recommendations for Hosts
- Target domestic marketing efforts towards travelers from England and London.
- Tailor amenities and listing descriptions to appeal to the dominant Post-2000s (Gen Z/Alpha) demographic (e.g., highlight fast WiFi, smart home features, local guides).
- Highlight unique local experiences or amenities relevant to the primary guest profile.
- Consider seasonal promotions aligned with peak travel times for key origin markets.
Nearby Short-Term Rental Market Comparison
How does the Bridgend Airbnb market stack up against its neighbors? Compare key performance metrics like average monthly revenue, ADR, and occupancy rates in surrounding areas to understand the broader regional STR landscape.
| Market | Active Properties | Monthly Revenue | Daily Rate | Avg. Occupancy |
|---|---|---|---|---|
| Englishcombe | 13 | $8,558 | $573.69 | 49% |
| Chew Magna | 14 | $6,649 | $399.59 | 46% |
| Long Sutton | 17 | $5,726 | $383.88 | 46% |
| Stoke St. Michael | 10 | $5,277 | $424.04 | 42% |
| Winsham | 10 | $5,154 | $484.22 | 52% |
| Oldland Common | 13 | $5,093 | $355.47 | 43% |
| Llanrhidian | 15 | $4,842 | $386.18 | 53% |
| Crai | 20 | $4,799 | $371.85 | 46% |
| Limpley Stoke | 10 | $4,598 | $523.47 | 52% |
| Abbeycwmhir | 10 | $4,502 | $259.19 | 49% |