Bethesda Airbnb Market Analysis 2025: Short Term Rental Data & Vacation Rental Statistics in Wales, United Kingdom
Is Airbnb profitable in Bethesda in 2025? Explore comprehensive Airbnb analytics for Bethesda, Wales, United Kingdom to uncover income potential. This 2025 STR market report for Bethesda, based on AirROI data from April 2024 to March 2025, reveals key trends in the niche market of 47 active listings.
Whether you're considering an Airbnb investment in Bethesda, optimizing your existing vacation rental, or exploring rental arbitrage opportunities, understanding the Bethesda Airbnb data is crucial. Leveraging the low regulation environment is key to maximizing your short term rental income potential. Let's dive into the specifics.
Key Bethesda Airbnb Performance Metrics Overview
Monthly Airbnb Revenue Variations & Income Potential in Bethesda (2025)
Understanding the monthly revenue variations for Airbnb listings in Bethesda is key to maximizing your short term rental income potential. Seasonality significantly impacts earnings. Our analysis, based on data from the past 12 months, shows that the peak revenue month for STRs in Bethesda is typically August, while February often presents the lowest earnings, highlighting opportunities for strategic pricing adjustments during shoulder and low seasons. Explore the typical Airbnb income in Bethesda across different performance tiers:
- Best-in-class properties (Top 10%) achieve $5,346+ monthly, often utilizing dynamic pricing and superior guest experiences.
- Strong performing properties (Top 25%) earn $3,096 or more, indicating effective management and desirable locations/amenities.
- Typical properties (Median) generate around $1,902 per month, representing the average market performance.
- Entry-level properties (Bottom 25%) see earnings around $1,195, often with potential for optimization.
Average Monthly Airbnb Earnings Trend in Bethesda
Bethesda Airbnb Occupancy Rate Trends (2025)
Maximize your bookings by understanding the Bethesda STR occupancy trends. Seasonal demand shifts significantly influence how often properties are booked. Typically, Augustsees the highest demand (peak season occupancy), while January experiences the lowest (low season). Effective strategies, like adjusting minimum stays or offering promotions, can boost occupancy during slower periods. Here's how different property tiers perform in Bethesda:
- Best-in-class properties (Top 10%) achieve 76%+ occupancy, indicating high desirability and potentially optimized availability.
- Strong performing properties (Top 25%) maintain 62% or higher occupancy, suggesting good market fit and guest satisfaction.
- Typical properties (Median) have an occupancy rate around 45%.
- Entry-level properties (Bottom 25%) average 28% occupancy, potentially facing higher vacancy.
Average Monthly Occupancy Rate Trend in Bethesda
Average Daily Rate (ADR) Airbnb Trends in Bethesda (2025)
Effective short term rental pricing strategy in Bethesda involves understanding monthly ADR fluctuations. The Average Daily Rate (ADR) for Airbnb in Bethesda typically peaks in November and dips lowest during February. Leveraging Airbnb dynamic pricing tools or strategies based on this seasonality can significantly boost revenue. Here's a look at the typical nightly rates achieved:
- Best-in-class properties (Top 10%) command rates of $367+ per night, often due to premium features or locations.
- Strong performing properties (Top 25%) achieve nightly rates of $181 or more.
- Typical properties (Median) charge around $131 per night.
- Entry-level properties (Bottom 25%) earn around $103 per night.
Average Daily Rate (ADR) Trend by Month in Bethesda
Get Live Bethesda Market Intelligence 👇

Explore Real-time Analytics
Airbnb Seasonality Analysis & Trends in Bethesda (2025)
Peak Season (August, June, May)
- Revenue averages $3,560 per month
- Occupancy rates average 61.8%
- Daily rates average $197
Shoulder Season
- Revenue averages $2,522 per month
- Occupancy maintains around 45.8%
- Daily rates hold near $196
Low Season (January, February, March)
- Revenue drops to average $1,817 per month
- Occupancy decreases to average 31.1%
- Daily rates adjust to average $189
Seasonality Insights for Bethesda
- The Airbnb seasonality in Bethesda shows highly seasonal trends requiring careful strategy. While the sections above show seasonal averages, it's also insightful to look at the extremes:
- During the high season, the absolute peak month showcases Bethesda's highest earning potential, with monthly revenues capable of climbing to $4,014, occupancy reaching a high of 75.5%, and ADRs peaking at $199.
- Conversely, the slowest single month of the year, typically falling within the low season, marks the market's lowest point. In this month, revenue might dip to $1,671, occupancy could drop to 28.9%, and ADRs may adjust down to $186.
- Understanding both the seasonal averages and these monthly peaks and troughs in revenue, occupancy, and ADR is crucial for maximizing your Airbnb profit potential in Bethesda.
Seasonal Strategies for Maximizing Profit
- Peak Season: Maximize revenue through premium pricing and potentially longer minimum stays. Ensure high availability.
- Low Season: Offer competitive pricing, special promotions (e.g., extended stay discounts), and flexible cancellation policies. Target off-season travelers like remote workers or budget-conscious guests.
- Shoulder Seasons: Implement dynamic pricing that balances peak and low rates. Target weekend travelers or specific events. Offer slightly more flexible terms than peak season.
- Regularly analyze your own performance against these Bethesda seasonality benchmarks and adjust your pricing and availability strategy accordingly.
Best Areas for Airbnb Investment in Bethesda (2025)
Exploring the top neighborhoods for short-term rentals in Bethesda? This section highlights key areas, outlining why they are attractive for hosts and guests, along with notable local attractions. Consider these locations based on your target guest profile and investment strategy.
| Neighborhood / Area | Why Host Here? (Target Guests & Appeal) | Key Attractions & Landmarks |
|---|---|---|
| City Centre | The vibrant heart of Bethesda with a mix of shops, restaurants, and cultural venues. Ideal for guests who want to experience the local community and attractions. | Bethesda Row, American Film Institute, Bethesda Contemporary Arts, Georgetown Preparatory School, Walking paths and parks |
| West Bethesda | A quieter suburban area with family-friendly amenities and parks. Perfect for longer stays and families looking for spacious accommodations. | Wheaton Regional Park, Cabin John Regional Park, Local restaurants and cafes, Parks and Nature Centers |
| North Bethesda | Features a blend of residential comfort and business districts. Popular among professionals and families seeking proximity to Washington, D.C. | Strathmore Music Center, Montgomery Mall, Rockville Town Square, Local shops and dining options |
| South Bethesda | Provides a mix of residential neighborhoods and convenient access to the Metro. Great for travelers looking to explore D.C. while enjoying a suburban setting. | Pooks Hill Park, The Bethesda Trolley Trail, Nearby grocery stores and shopping centers |
| East Bethesda | Known for its parks and community events, this area is great for those who appreciate outdoor activities and local culture. | Elm Street Park, Community pool and sports fields, Local farmers' markets |
| Bethesda Arts District | A hub for art enthusiasts, this area features galleries, theaters, and performance spaces, attracting culturally-minded visitors. | Bethesda Theatre, The Strathmore, Art galleries, Cultural events and festivals |
| Woodmont Triangle | A trendy area filled with dining options, coffee shops, and nightlife. Perfect for younger travelers looking for social experiences. | Local eateries and bistros, Bethesda Farmer's Market, Live music venues |
| Little Falls | A picturesque neighborhood along the Little Falls Stream, ideal for nature lovers and those seeking a peaceful retreat close to the city. | Little Falls Stream Valley Park, Walking trails, Quiet residential streets |
Understanding Airbnb License Requirements & STR Laws in Bethesda (2025)
While Bethesda, Wales, United Kingdom currently shows low STR regulations, specific Airbnb license requirements might still exist or change. Always verify the latest short term rental regulations and Airbnb license requirements directly with local government authorities for Bethesda to ensure full compliance before hosting.
(Source: AirROI data, 2025, finding no licensed listings among those analyzed)
Top Performing Airbnb Properties in Bethesda (2025)
Benchmark your potential! Explore examples of top-performing Airbnb properties in Bethesdabased on Trailing Twelve Month (TTM) revenue. Analyze their characteristics, revenue, occupancy rate, and ADR to understand what drives success in this market.
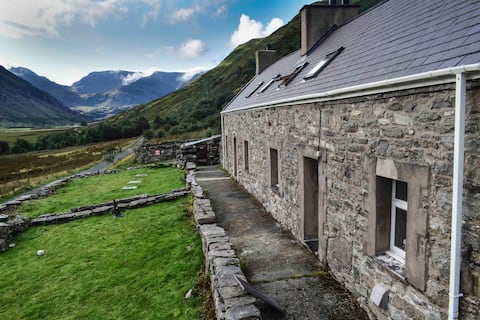
Snowdonia Hostel (sleeps24)peaceful stunning views
Entire Place • 5 bedrooms

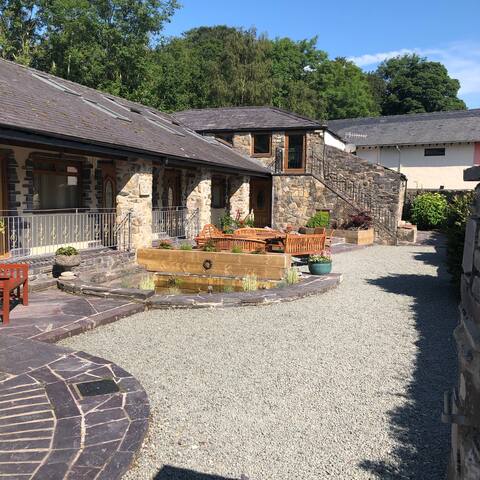
Ceunant Bach, couples cottage with hot tub
Entire Place • 1 bedroom
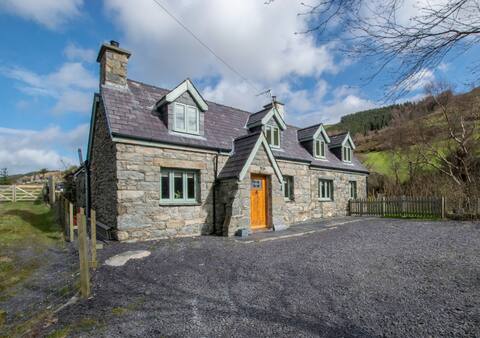
Bryn Llys, doorstep to Snowdonia and North Wales
Entire Place • 5 bedrooms
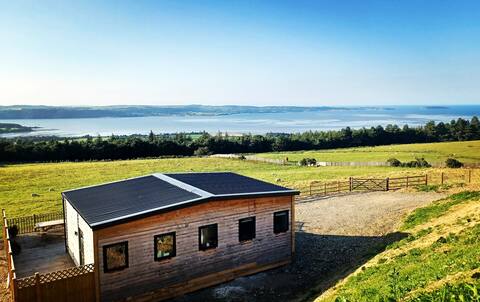
Delightful 2 bedroom log cabin Sleeps 4
Entire Place • 2 bedrooms
Ty'n y Maes
Entire Place • 5 bedrooms

Perfectly situated for 'Zipworld' and Snowdonia
Entire Place • 2 bedrooms
Note: Performance varies based on location, size, amenities, seasonality, and management quality. Data reflects the past 12 months.
Top Performing Airbnb Hosts in Bethesda (2025)
Learn from the best! This table showcases top-performing Airbnb hosts in Bethesda based on the number of properties managed and estimated total revenue over the past year. Analyze their scale and performance metrics.
| Host Name | Properties | Grossing Revenue | Stay Reviews | Avg Rating |
|---|---|---|---|---|
| Carlo | 3 | $143,543 | 207 | 4.97/5.0 |
| Neil | 1 | $96,371 | 61 | 4.87/5.0 |
| North Wales Holiday Cottages | 1 | $91,595 | 23 | 5.00/5.0 |
| Anna | 1 | $73,748 | 222 | 4.97/5.0 |
| Ben | 3 | $71,635 | 88 | 4.87/5.0 |
| Wales Cottage Holidays | 1 | $55,951 | 9 | 5.00/5.0 |
| Lynne | 2 | $54,586 | 518 | 4.89/5.0 |
| Aled | 1 | $48,952 | 163 | 4.91/5.0 |
| Lyndsey | 1 | $42,291 | 98 | 4.97/5.0 |
| Helen | 1 | $40,545 | 32 | 4.94/5.0 |
Analyzing the strategies of top hosts, such as their property selection, pricing, and guest communication, can offer valuable lessons for optimizing your own Airbnb operations in Bethesda.
Dive Deeper: Advanced Bethesda STR Market Data (2025)
Ready to unlock more insights? AirROI provides access to advanced metrics and comprehensive Airbnb data for Bethesda. Explore detailed analytics beyond this report to refine your investment strategy, optimize pricing, and maximize your vacation rental profits.
Explore Advanced MetricsBethesda Short-Term Rental Market Composition (2025): Property & Room Types
Room Type Distribution
Property Type Distribution
Market Composition Insights for Bethesda
- The Bethesda Airbnb market composition is heavily skewed towards Entire Home/Apt listings, which make up 87.2% of the 47 active rentals. This indicates strong guest preference for privacy and space.
- Looking at the property type distribution in Bethesda, House properties are the most common (57.4%), reflecting the local real estate landscape.
- Houses represent a significant 57.4% portion, catering likely to families or larger groups.
- Smaller segments like hotel/boutique (combined 4.3%) offer potential for unique stay experiences.
Bethesda Airbnb Room Capacity Analysis (2025): Bedroom Distribution
Distribution of Listings by Number of Bedrooms
Room Capacity Insights for Bethesda
- The dominant room capacity in Bethesda is 2 bedrooms listings, making up 31.9% of the market. This suggests a strong demand for properties suitable for couples or solo travelers.
- Together, 2 bedrooms and 1 bedroom properties represent 57.4% of the active Airbnb listings in Bethesda, indicating a high concentration in these sizes.
- A significant 29.7% of listings offer 3+ bedrooms, catering to larger groups and families seeking more space in Bethesda.
Bethesda Vacation Rental Guest Capacity Trends (2025)
Distribution of Listings by Guest Capacity
Guest Capacity Insights for Bethesda
- The most common guest capacity trend in Bethesda vacation rentals is listings accommodating 4 guests (23.4%). This suggests the primary traveler segment is likely small families or groups.
- Properties designed for 4 guests and 2 guests dominate the Bethesda STR market, accounting for 42.5% of listings.
- 27.6% of properties accommodate 6+ guests, serving the market segment for larger families or group travel in Bethesda.
- On average, properties in Bethesda are equipped to host 4.1 guests.
Bethesda Airbnb Booking Patterns (2025): Available vs. Booked Days
Available Days Distribution
Booked Days Distribution
Booking Pattern Insights for Bethesda
- The most common availability pattern in Bethesda falls within the 181-270 days range, representing 36.2% of listings. This suggests many properties have significant open periods on their calendars.
- Approximately 63.9% of listings show high availability (181+ days open annually), indicating potential for increased bookings or specific owner usage patterns.
- For booked days, the 181-270 days range is most frequent in Bethesda (31.9%), reflecting common guest stay durations or potential owner blocking patterns.
- A notable 40.4% of properties secure long booking periods (181+ days booked per year), highlighting successful long-term rental strategies or significant owner usage.
Bethesda Airbnb Minimum Stay Requirements Analysis
Distribution of Listings by Minimum Night Requirement
1 Night
5 listings
11.1% of total
2 Nights
31 listings
68.9% of total
3 Nights
2 listings
4.4% of total
30+ Nights
7 listings
15.6% of total
Key Insights
- The most prevalent minimum stay requirement in Bethesda is 2 Nights, adopted by 68.9% of listings. This highlights the market's preference for shorter, flexible bookings.
- A strong majority (80.0%) of the Bethesda Airbnb data shows acceptance of very short stays (1-2 nights), indicating a dynamic, high-turnover market.
- A significant segment (15.6%) caters to monthly stays (30+ nights) in Bethesda, pointing to opportunities in the extended-stay market.
Recommendations
- Align with the market by considering a 2 Nights minimum stay, as 68.9% of Bethesda hosts use this setting.
- If feasible, allowing 1-night stays, especially midweek or during low season, could capture last-minute bookings, as only 11.1% currently do.
- A 2-night minimum appears standard (68.9%). Consider this for weekends or peak periods.
- Explore offering discounts for stays of 30+ nights to attract the 15.6% of the market seeking extended stays.
- Adjust minimum nights based on seasonality – potentially shorter during low season and longer during peak demand periods in Bethesda.
Bethesda Airbnb Cancellation Policy Trends Analysis (2025)
Super Strict 60 Days
3 listings
7% of total
Flexible
7 listings
16.3% of total
Moderate
11 listings
25.6% of total
Firm
11 listings
25.6% of total
Strict
11 listings
25.6% of total
Cancellation Policy Insights for Bethesda
- The prevailing Airbnb cancellation policy trend in Bethesda is Moderate, used by 25.6% of listings.
- A majority (51.2%) of hosts in Bethesda utilize Firm or Strict policies, indicating a market where hosts prioritize booking security.
Recommendations for Hosts
- Consider adopting a Moderate policy to align with the 25.6% market standard in Bethesda.
- Regularly review your cancellation policy against competitors and market demand shifts in Bethesda.
Bethesda STR Booking Lead Time Analysis (2025)
Average Booking Lead Time by Month
Booking Lead Time Insights for Bethesda
- The overall average booking lead time for vacation rentals in Bethesda is 55 days.
- Guests book furthest in advance for stays during May (average 91 days), likely coinciding with peak travel demand or local events.
- The shortest booking windows occur for stays in February (average 32 days), indicating more last-minute travel plans during this time.
- Seasonally, Summer (79 days avg.) sees the longest lead times, while Winter (43 days avg.) has the shortest, reflecting typical travel planning cycles.
Recommendations for Hosts
- Use the overall average lead time (55 days) as a baseline for your pricing and availability strategy in Bethesda.
- For May stays, consider implementing length-of-stay discounts or slightly higher rates for bookings made less than 91 days out to capitalize on advance planning.
- Target marketing efforts for the Summer season well in advance (at least 79 days) to capture early planners.
- Monitor your own booking lead times against these Bethesda averages to identify opportunities for dynamic pricing adjustments.
Popular & Essential Airbnb Amenities in Bethesda (2025)
Amenity Prevalence
Amenity Insights for Bethesda
- Essential amenities in Bethesda that guests expect include: Heating, Smoke alarm. Lacking these (any) could significantly impact bookings.
- Popular amenities like Wifi, TV, Kitchen are common but not universal. Offering these can provide a competitive edge.
- Warning: Wifi is not universally provided but is considered essential globally. Ensure reliable Wifi is offered.
Recommendations for Hosts
- Ensure your listing includes all essential amenities for Bethesda: Heating, Smoke alarm.
- Prioritize adding missing essentials: Heating, Smoke alarm.
- Consider adding popular differentiators like Wifi or TV to increase appeal.
- Highlight unique or less common amenities you offer (e.g., hot tub, dedicated workspace, EV charger) in your listing description and photos.
- Regularly check competitor amenities in Bethesda to stay competitive.
Bethesda Airbnb Guest Demographics & Profile Analysis (2025)
Guest Profile Summary for Bethesda
- The typical guest profile for Airbnb in Bethesda consists of primarily domestic travelers (91%), often arriving from nearby England, typically belonging to the Post-2000s (Gen Z/Alpha) group (50%), primarily speaking English or French.
- Domestic travelers account for 90.7% of guests.
- Key international markets include United Kingdom (90.7%) and United States (1.6%).
- Top languages spoken are English (69%) followed by French (6.3%).
- A significant demographic segment is the Post-2000s (Gen Z/Alpha) group, representing 50% of guests.
Recommendations for Hosts
- Target domestic marketing efforts towards travelers from England and London.
- Tailor amenities and listing descriptions to appeal to the dominant Post-2000s (Gen Z/Alpha) demographic (e.g., highlight fast WiFi, smart home features, local guides).
- Highlight unique local experiences or amenities relevant to the primary guest profile.
- Consider seasonal promotions aligned with peak travel times for key origin markets.
Nearby Short-Term Rental Market Comparison
How does the Bethesda Airbnb market stack up against its neighbors? Compare key performance metrics like average monthly revenue, ADR, and occupancy rates in surrounding areas to understand the broader regional STR landscape.
| Market | Active Properties | Monthly Revenue | Daily Rate | Avg. Occupancy |
|---|---|---|---|---|
| Abbeycwmhir | 10 | $4,502 | $259.19 | 49% |
| Eglwys-bach | 16 | $4,413 | $315.23 | 52% |
| Waverton | 16 | $4,358 | $444.20 | 33% |
| Chirbury | 14 | $4,233 | $702.20 | 41% |
| Seascale | 11 | $4,165 | $354.23 | 40% |
| Cwmann | 17 | $4,162 | $228.82 | 54% |
| Borth-y-Gêst | 18 | $4,139 | $240.51 | 55% |
| Valley | 18 | $4,042 | $254.80 | 44% |
| Braichmelyn | 41 | $3,894 | $246.43 | 54% |
| Rhoscolyn | 17 | $3,799 | $370.12 | 43% |