Wigtown Airbnb Market Analysis 2025: Short Term Rental Data & Vacation Rental Statistics in Scotland, United Kingdom
Is Airbnb profitable in Wigtown in 2025? Explore comprehensive Airbnb analytics for Wigtown, Scotland, United Kingdom to uncover income potential. This 2025 STR market report for Wigtown, based on AirROI data from April 2024 to March 2025, reveals key trends in the niche market of 29 active listings.
Whether you're considering an Airbnb investment in Wigtown, optimizing your existing vacation rental, or exploring rental arbitrage opportunities, understanding the Wigtown Airbnb data is crucial. Understanding the local regulations is key to maximizing your short term rental income potential. Let's dive into the specifics.
Key Wigtown Airbnb Performance Metrics Overview
Monthly Airbnb Revenue Variations & Income Potential in Wigtown (2025)
Understanding the monthly revenue variations for Airbnb listings in Wigtown is key to maximizing your short term rental income potential. Seasonality significantly impacts earnings. Our analysis, based on data from the past 12 months, shows that the peak revenue month for STRs in Wigtown is typically August, while January often presents the lowest earnings, highlighting opportunities for strategic pricing adjustments during shoulder and low seasons. Explore the typical Airbnb income in Wigtown across different performance tiers:
- Best-in-class properties (Top 10%) achieve $4,323+ monthly, often utilizing dynamic pricing and superior guest experiences.
- Strong performing properties (Top 25%) earn $2,725 or more, indicating effective management and desirable locations/amenities.
- Typical properties (Median) generate around $1,575 per month, representing the average market performance.
- Entry-level properties (Bottom 25%) see earnings around $743, often with potential for optimization.
Average Monthly Airbnb Earnings Trend in Wigtown
Wigtown Airbnb Occupancy Rate Trends (2025)
Maximize your bookings by understanding the Wigtown STR occupancy trends. Seasonal demand shifts significantly influence how often properties are booked. Typically, Augustsees the highest demand (peak season occupancy), while January experiences the lowest (low season). Effective strategies, like adjusting minimum stays or offering promotions, can boost occupancy during slower periods. Here's how different property tiers perform in Wigtown:
- Best-in-class properties (Top 10%) achieve 70%+ occupancy, indicating high desirability and potentially optimized availability.
- Strong performing properties (Top 25%) maintain 53% or higher occupancy, suggesting good market fit and guest satisfaction.
- Typical properties (Median) have an occupancy rate around 29%.
- Entry-level properties (Bottom 25%) average 15% occupancy, potentially facing higher vacancy.
Average Monthly Occupancy Rate Trend in Wigtown
Average Daily Rate (ADR) Airbnb Trends in Wigtown (2025)
Effective short term rental pricing strategy in Wigtown involves understanding monthly ADR fluctuations. The Average Daily Rate (ADR) for Airbnb in Wigtown typically peaks in December and dips lowest during May. Leveraging Airbnb dynamic pricing tools or strategies based on this seasonality can significantly boost revenue. Here's a look at the typical nightly rates achieved:
- Best-in-class properties (Top 10%) command rates of $309+ per night, often due to premium features or locations.
- Strong performing properties (Top 25%) achieve nightly rates of $220 or more.
- Typical properties (Median) charge around $152 per night.
- Entry-level properties (Bottom 25%) earn around $88 per night.
Average Daily Rate (ADR) Trend by Month in Wigtown
Get Live Wigtown Market Intelligence 👇

Explore Real-time Analytics
Airbnb Seasonality Analysis & Trends in Wigtown (2025)
Peak Season (August, June, May)
- Revenue averages $2,507 per month
- Occupancy rates average 42.1%
- Daily rates average $166
Shoulder Season
- Revenue averages $2,010 per month
- Occupancy maintains around 36.5%
- Daily rates hold near $171
Low Season (January, February, March)
- Revenue drops to average $1,500 per month
- Occupancy decreases to average 27.8%
- Daily rates adjust to average $178
Seasonality Insights for Wigtown
- The Airbnb seasonality in Wigtown shows moderate seasonality with distinct peak and low periods. While the sections above show seasonal averages, it's also insightful to look at the extremes:
- During the high season, the absolute peak month showcases Wigtown's highest earning potential, with monthly revenues capable of climbing to $2,843, occupancy reaching a high of 52.7%, and ADRs peaking at $183.
- Conversely, the slowest single month of the year, typically falling within the low season, marks the market's lowest point. In this month, revenue might dip to $1,445, occupancy could drop to 21.9%, and ADRs may adjust down to $163.
- Understanding both the seasonal averages and these monthly peaks and troughs in revenue, occupancy, and ADR is crucial for maximizing your Airbnb profit potential in Wigtown.
Seasonal Strategies for Maximizing Profit
- Peak Season: Maximize revenue through premium pricing and potentially longer minimum stays. Ensure high availability.
- Low Season: Offer competitive pricing, special promotions (e.g., extended stay discounts), and flexible cancellation policies. Target off-season travelers like remote workers or budget-conscious guests.
- Shoulder Seasons: Implement dynamic pricing that balances peak and low rates. Target weekend travelers or specific events. Offer slightly more flexible terms than peak season.
- Regularly analyze your own performance against these Wigtown seasonality benchmarks and adjust your pricing and availability strategy accordingly.
Best Areas for Airbnb Investment in Wigtown (2025)
Exploring the top neighborhoods for short-term rentals in Wigtown? This section highlights key areas, outlining why they are attractive for hosts and guests, along with notable local attractions. Consider these locations based on your target guest profile and investment strategy.
| Neighborhood / Area | Why Host Here? (Target Guests & Appeal) | Key Attractions & Landmarks |
|---|---|---|
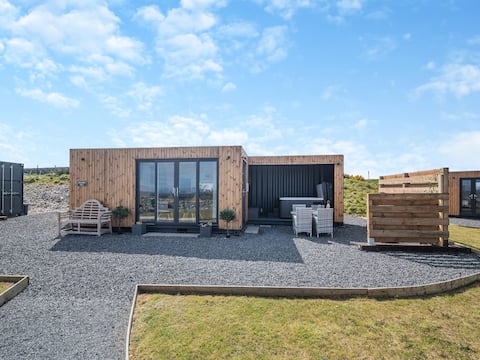
| Wigtown Town Centre | The heart of Wigtown, famous for its bookshops and literary festivals. A charming location attracting book lovers and tourists interested in Scotland's literary heritage. | Wigtown Bookshop, Wigtown Book Festival, Galloway National Park, Wigtown's Historic Sites, Local Cafes and Artisans |
| Galloway Forest Park | Known as the 'Dark Sky Park', this area offers stunning natural beauty and attracts visitors seeking outdoor activities like hiking and stargazing. | Stargazing, Hiking Trails, Wildlife Watching, Mabie Forest, Red Deer and Osprey |
| Bladnoch Distillery | A popular whiskey distillery in the region, attracting whiskey enthusiasts and tourists looking to experience Scottish craftsmanship. | Bladnoch Distillery Tours, Local Whiskey Tastings, Bladnoch River Walks |
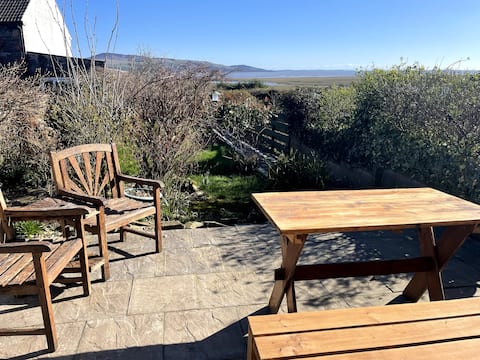
| Drummore | A quaint coastal village offering beautiful sea views and access to splendid natural landscapes, perfect for visitors looking for a peaceful retreat. | Drummore Beach, Nearby Coastal Walks, Fishing Opportunities |
| Port William | A picturesque fishing village known for its harbor, local seafood, and scenic coastline, attracting those who appreciate maritime culture. | Port William Harbor, Seaside Walks, Local Seafood Restaurants |
| Newton Stewart | A larger town near Wigtown, serving as a base for exploring Galloway and the surrounding countryside, with various amenities and attractions. | Newton Stewart Museum, Galloway Hills, Local Shops and Pubs |
| Creech Castle | A historic site nearby with beautiful landscapes, drawing visitors interested in history and nature combined. | Creech Castle Ruins, Walking Trails, Picnic Areas |
| Isle of Whithorn | A small, coastal village with a rich maritime history, perfect for visitors looking to explore the coast and its historical significance. | Historical Sites, Beautiful Coastal Walks, Isle of Whithorn Harbor |
Understanding Airbnb License Requirements & STR Laws in Wigtown (2025)
With 14% of listings showing registration in 2025, understanding potential Airbnb license requirements is crucial in Wigtown. Always verify the latest short term rental regulations and Airbnb license requirements directly with local government authorities for Wigtown to ensure full compliance before hosting.
(Source: AirROI data, 2025, based on 14% licensed listings)
Top Performing Airbnb Properties in Wigtown (2025)
Benchmark your potential! Explore examples of top-performing Airbnb properties in Wigtownbased on Trailing Twelve Month (TTM) revenue. Analyze their characteristics, revenue, occupancy rate, and ADR to understand what drives success in this market.

The Open Book - a bookshop holiday!
Entire Place • 1 bedroom
Galloway Hills - UK46817
Entire Place • 1 bedroom
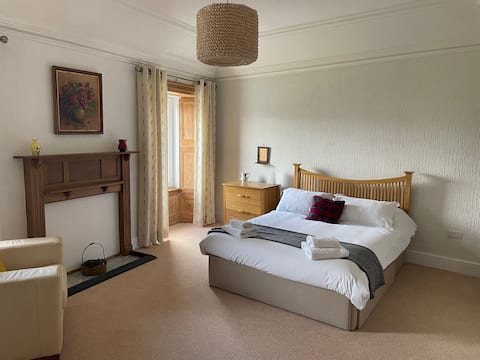
Beautiful 2 bedroom cottage with stunning bay view
Entire Place • 2 bedrooms
Holiday House at 22
Entire Place • 3 bedrooms
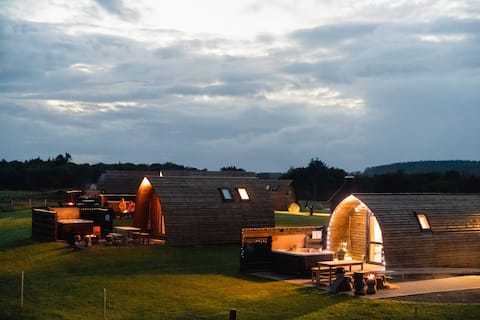
Cosy Modern Glamping Cabin With Hot Tub
Entire Place • 1 bedroom
Cosy Rural Cabin With Hot Tub & A Great View
Entire Place • 1 bedroom
Note: Performance varies based on location, size, amenities, seasonality, and management quality. Data reflects the past 12 months.
Top Performing Airbnb Hosts in Wigtown (2025)
Learn from the best! This table showcases top-performing Airbnb hosts in Wigtown based on the number of properties managed and estimated total revenue over the past year. Analyze their scale and performance metrics.
| Host Name | Properties | Grossing Revenue | Stay Reviews | Avg Rating |
|---|---|---|---|---|
| Host #222202509 | 9 | $99,048 | 6 | 0.00/5.0 |
| Wigwam Holidays Wigtown | 5 | $91,197 | 53 | 4.86/5.0 |
| Anne | 1 | $55,205 | 175 | 4.93/5.0 |
| Nic | 1 | $30,338 | 134 | 4.96/5.0 |
| Graeme | 1 | $28,420 | 7 | 5.00/5.0 |
| Julie | 1 | $24,663 | 15 | 4.93/5.0 |
| Ken | 1 | $22,182 | 7 | 5.00/5.0 |
| Glenn | 1 | $20,625 | 41 | 5.00/5.0 |
| Anne | 2 | $16,593 | 120 | 4.83/5.0 |
| H | 1 | $15,592 | 23 | 4.96/5.0 |
Analyzing the strategies of top hosts, such as their property selection, pricing, and guest communication, can offer valuable lessons for optimizing your own Airbnb operations in Wigtown.
Dive Deeper: Advanced Wigtown STR Market Data (2025)
Ready to unlock more insights? AirROI provides access to advanced metrics and comprehensive Airbnb data for Wigtown. Explore detailed analytics beyond this report to refine your investment strategy, optimize pricing, and maximize your vacation rental profits.
Explore Advanced MetricsWigtown Short-Term Rental Market Composition (2025): Property & Room Types
Room Type Distribution
Property Type Distribution
Market Composition Insights for Wigtown
- The Wigtown Airbnb market composition is heavily skewed towards Entire Home/Apt listings, which make up 89.7% of the 29 active rentals. This indicates strong guest preference for privacy and space.
- Looking at the property type distribution in Wigtown, House properties are the most common (79.3%), reflecting the local real estate landscape.
- Houses represent a significant 79.3% portion, catering likely to families or larger groups.
- Smaller segments like unique stays (combined 3.4%) offer potential for unique stay experiences.
Wigtown Airbnb Room Capacity Analysis (2025): Bedroom Distribution
Distribution of Listings by Number of Bedrooms
Room Capacity Insights for Wigtown
- The dominant room capacity in Wigtown is 1 bedroom listings, making up 48.3% of the market. This suggests a strong demand for properties suitable for couples or solo travelers.
- Together, 1 bedroom and 2 bedrooms properties represent 72.4% of the active Airbnb listings in Wigtown, indicating a high concentration in these sizes.
Wigtown Vacation Rental Guest Capacity Trends (2025)
Distribution of Listings by Guest Capacity
Guest Capacity Insights for Wigtown
- The most common guest capacity trend in Wigtown vacation rentals is listings accommodating 4 guests (41.4%). This suggests the primary traveler segment is likely small families or groups.
- Properties designed for 4 guests and 2 guests dominate the Wigtown STR market, accounting for 72.4% of listings.
- 17.2% of properties accommodate 6+ guests, serving the market segment for larger families or group travel in Wigtown.
- On average, properties in Wigtown are equipped to host 3.3 guests.
Wigtown Airbnb Booking Patterns (2025): Available vs. Booked Days
Available Days Distribution
Booked Days Distribution
Booking Pattern Insights for Wigtown
- The most common availability pattern in Wigtown falls within the 271-366 days range, representing 58.6% of listings. This suggests many properties have significant open periods on their calendars.
- Approximately 86.2% of listings show high availability (181+ days open annually), indicating potential for increased bookings or specific owner usage patterns.
- For booked days, the 31-90 days range is most frequent in Wigtown (44.8%), reflecting common guest stay durations or potential owner blocking patterns.
- A notable 13.7% of properties secure long booking periods (181+ days booked per year), highlighting successful long-term rental strategies or significant owner usage.
Wigtown Airbnb Minimum Stay Requirements Analysis
Distribution of Listings by Minimum Night Requirement
1 Night
14 listings
51.9% of total
2 Nights
4 listings
14.8% of total
3 Nights
4 listings
14.8% of total
4-6 Nights
2 listings
7.4% of total
7-29 Nights
2 listings
7.4% of total
30+ Nights
1 listings
3.7% of total
Key Insights
- The most prevalent minimum stay requirement in Wigtown is 1 Night, adopted by 51.9% of listings. This highlights the market's preference for shorter, flexible bookings.
- A strong majority (66.7%) of the Wigtown Airbnb data shows acceptance of very short stays (1-2 nights), indicating a dynamic, high-turnover market.
Recommendations
- Align with the market by considering a 1 Night minimum stay, as 51.9% of Wigtown hosts use this setting.
- Adjust minimum nights based on seasonality – potentially shorter during low season and longer during peak demand periods in Wigtown.
Wigtown Airbnb Cancellation Policy Trends Analysis (2025)
Super Strict 60 Days
2 listings
9.5% of total
Flexible
1 listings
4.8% of total
Moderate
9 listings
42.9% of total
Firm
3 listings
14.3% of total
Strict
6 listings
28.6% of total
Cancellation Policy Insights for Wigtown
- The prevailing Airbnb cancellation policy trend in Wigtown is Moderate, used by 42.9% of listings.
- There's a relatively balanced mix between guest-friendly (47.7%) and stricter (42.9%) policies, offering choices for different guest needs.
Recommendations for Hosts
- Consider adopting a Moderate policy to align with the 42.9% market standard in Wigtown.
- Regularly review your cancellation policy against competitors and market demand shifts in Wigtown.
Wigtown STR Booking Lead Time Analysis (2025)
Average Booking Lead Time by Month
Booking Lead Time Insights for Wigtown
- The overall average booking lead time for vacation rentals in Wigtown is 69 days.
- Guests book furthest in advance for stays during May (average 117 days), likely coinciding with peak travel demand or local events.
- The shortest booking windows occur for stays in March (average 32 days), indicating more last-minute travel plans during this time.
- Seasonally, Fall (98 days avg.) sees the longest lead times, while Spring (74 days avg.) has the shortest, reflecting typical travel planning cycles.
Recommendations for Hosts
- Use the overall average lead time (69 days) as a baseline for your pricing and availability strategy in Wigtown.
- For May stays, consider implementing length-of-stay discounts or slightly higher rates for bookings made less than 117 days out to capitalize on advance planning.
- Target marketing efforts for the Fall season well in advance (at least 98 days) to capture early planners.
- Monitor your own booking lead times against these Wigtown averages to identify opportunities for dynamic pricing adjustments.
Popular & Essential Airbnb Amenities in Wigtown (2025)
Amenity Prevalence
Amenity Insights for Wigtown
- Essential amenities in Wigtown that guests expect include: Smoke alarm, Heating, Hot water, Wifi, Kitchen. Lacking these (any) could significantly impact bookings.
- Popular amenities like TV, Carbon monoxide alarm, Cooking basics are common but not universal. Offering these can provide a competitive edge.
Recommendations for Hosts
- Ensure your listing includes all essential amenities for Wigtown: Smoke alarm, Heating, Hot water, Wifi, Kitchen.
- Prioritize adding missing essentials: Hot water, Wifi, Kitchen.
- Consider adding popular differentiators like TV or Carbon monoxide alarm to increase appeal.
- Highlight unique or less common amenities you offer (e.g., hot tub, dedicated workspace, EV charger) in your listing description and photos.
- Regularly check competitor amenities in Wigtown to stay competitive.
Wigtown Airbnb Guest Demographics & Profile Analysis (2025)
Guest Profile Summary for Wigtown
- The typical guest profile for Airbnb in Wigtown consists of primarily domestic travelers (76%), often arriving from nearby England, typically belonging to the Post-2000s (Gen Z/Alpha) group (50%), primarily speaking English or French.
- Domestic travelers account for 76.2% of guests.
- Key international markets include United Kingdom (76.2%) and United States (15%).
- Top languages spoken are English (56.7%) followed by French (14.9%).
- A significant demographic segment is the Post-2000s (Gen Z/Alpha) group, representing 50% of guests.
Recommendations for Hosts
- Target domestic marketing efforts towards travelers from England and Glasgow.
- Tailor amenities and listing descriptions to appeal to the dominant Post-2000s (Gen Z/Alpha) demographic (e.g., highlight fast WiFi, smart home features, local guides).
- Highlight unique local experiences or amenities relevant to the primary guest profile.
- Consider seasonal promotions aligned with peak travel times for key origin markets.
Nearby Short-Term Rental Market Comparison
How does the Wigtown Airbnb market stack up against its neighbors? Compare key performance metrics like average monthly revenue, ADR, and occupancy rates in surrounding areas to understand the broader regional STR landscape.
| Market | Active Properties | Monthly Revenue | Daily Rate | Avg. Occupancy |
|---|---|---|---|---|
| Galston | 11 | $7,951 | $676.77 | 46% |
| Gorebridge | 12 | $6,209 | $493.62 | 54% |
| City of Edinburgh | 4,312 | $4,528 | $274.67 | 61% |
| Eglwys-bach | 16 | $4,413 | $315.23 | 52% |
| Waverton | 16 | $4,358 | $444.20 | 33% |
| Seascale | 11 | $4,165 | $354.23 | 40% |
| Valley | 18 | $4,042 | $254.80 | 44% |
| Braichmelyn | 41 | $3,894 | $246.43 | 54% |
| Midlothian | 12 | $3,856 | $277.04 | 44% |
| Rhoscolyn | 17 | $3,799 | $370.12 | 43% |