Stromness Airbnb Market Analysis 2025: Short Term Rental Data & Vacation Rental Statistics in Scotland, United Kingdom
Is Airbnb profitable in Stromness in 2025? Explore comprehensive Airbnb analytics for Stromness, Scotland, United Kingdom to uncover income potential. This 2025 STR market report for Stromness, based on AirROI data from April 2024 to March 2025, reveals key trends in the niche market of 56 active listings.
Whether you're considering an Airbnb investment in Stromness, optimizing your existing vacation rental, or exploring rental arbitrage opportunities, understanding the Stromness Airbnb data is crucial. Understanding the local regulations is key to maximizing your short term rental income potential. Let's dive into the specifics.
Key Stromness Airbnb Performance Metrics Overview
Monthly Airbnb Revenue Variations & Income Potential in Stromness (2025)
Understanding the monthly revenue variations for Airbnb listings in Stromness is key to maximizing your short term rental income potential. Seasonality significantly impacts earnings. Our analysis, based on data from the past 12 months, shows that the peak revenue month for STRs in Stromness is typically July, while February often presents the lowest earnings, highlighting opportunities for strategic pricing adjustments during shoulder and low seasons. Explore the typical Airbnb income in Stromness across different performance tiers:
- Best-in-class properties (Top 10%) achieve $4,823+ monthly, often utilizing dynamic pricing and superior guest experiences.
- Strong performing properties (Top 25%) earn $3,216 or more, indicating effective management and desirable locations/amenities.
- Typical properties (Median) generate around $2,273 per month, representing the average market performance.
- Entry-level properties (Bottom 25%) see earnings around $1,450, often with potential for optimization.
Average Monthly Airbnb Earnings Trend in Stromness
Stromness Airbnb Occupancy Rate Trends (2025)
Maximize your bookings by understanding the Stromness STR occupancy trends. Seasonal demand shifts significantly influence how often properties are booked. Typically, Julysees the highest demand (peak season occupancy), while March experiences the lowest (low season). Effective strategies, like adjusting minimum stays or offering promotions, can boost occupancy during slower periods. Here's how different property tiers perform in Stromness:
- Best-in-class properties (Top 10%) achieve 83%+ occupancy, indicating high desirability and potentially optimized availability.
- Strong performing properties (Top 25%) maintain 70% or higher occupancy, suggesting good market fit and guest satisfaction.
- Typical properties (Median) have an occupancy rate around 52%.
- Entry-level properties (Bottom 25%) average 30% occupancy, potentially facing higher vacancy.
Average Monthly Occupancy Rate Trend in Stromness
Average Daily Rate (ADR) Airbnb Trends in Stromness (2025)
Effective short term rental pricing strategy in Stromness involves understanding monthly ADR fluctuations. The Average Daily Rate (ADR) for Airbnb in Stromness typically peaks in December and dips lowest during April. Leveraging Airbnb dynamic pricing tools or strategies based on this seasonality can significantly boost revenue. Here's a look at the typical nightly rates achieved:
- Best-in-class properties (Top 10%) command rates of $245+ per night, often due to premium features or locations.
- Strong performing properties (Top 25%) achieve nightly rates of $192 or more.
- Typical properties (Median) charge around $149 per night.
- Entry-level properties (Bottom 25%) earn around $116 per night.
Average Daily Rate (ADR) Trend by Month in Stromness
Get Live Stromness Market Intelligence 👇

Explore Real-time Analytics
Airbnb Seasonality Analysis & Trends in Stromness (2025)
Peak Season (July, August, May)
- Revenue averages $3,937 per month
- Occupancy rates average 69.9%
- Daily rates average $160
Shoulder Season
- Revenue averages $2,546 per month
- Occupancy maintains around 50.0%
- Daily rates hold near $160
Low Season (February, March, November)
- Revenue drops to average $1,218 per month
- Occupancy decreases to average 30.3%
- Daily rates adjust to average $169
Seasonality Insights for Stromness
- The Airbnb seasonality in Stromness shows highly seasonal trends requiring careful strategy. While the sections above show seasonal averages, it's also insightful to look at the extremes:
- During the high season, the absolute peak month showcases Stromness's highest earning potential, with monthly revenues capable of climbing to $4,267, occupancy reaching a high of 74.1%, and ADRs peaking at $170.
- Conversely, the slowest single month of the year, typically falling within the low season, marks the market's lowest point. In this month, revenue might dip to $1,005, occupancy could drop to 22.9%, and ADRs may adjust down to $150.
- Understanding both the seasonal averages and these monthly peaks and troughs in revenue, occupancy, and ADR is crucial for maximizing your Airbnb profit potential in Stromness.
Seasonal Strategies for Maximizing Profit
- Peak Season: Maximize revenue through premium pricing and potentially longer minimum stays. Ensure high availability.
- Low Season: Offer competitive pricing, special promotions (e.g., extended stay discounts), and flexible cancellation policies. Target off-season travelers like remote workers or budget-conscious guests.
- Shoulder Seasons: Implement dynamic pricing that balances peak and low rates. Target weekend travelers or specific events. Offer slightly more flexible terms than peak season.
- Regularly analyze your own performance against these Stromness seasonality benchmarks and adjust your pricing and availability strategy accordingly.
Best Areas for Airbnb Investment in Stromness (2025)
Exploring the top neighborhoods for short-term rentals in Stromness? This section highlights key areas, outlining why they are attractive for hosts and guests, along with notable local attractions. Consider these locations based on your target guest profile and investment strategy.
| Neighborhood / Area | Why Host Here? (Target Guests & Appeal) | Key Attractions & Landmarks |
|---|---|---|
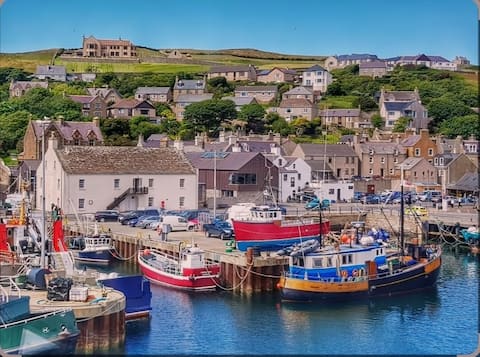
| Stromness Harbour | A picturesque harbour area known for its stunning coastal views and access to the ferry terminals. Ideal for visitors exploring the Orkney Islands and looking for scenic beauty. | Stromness Harbour, Scapa Flow, Northlink Ferries, Pier Arts Centre, Stromness Museum |
| Main Street | The heart of Stromness featuring local shops, cafes, and pubs. Perfect for tourists wanting to experience the local culture and community life. | Local shops and boutiques, Stromness Golf Club, The Ferry Inn, The Royal Hotel, Community events |
| Town Centre | The central area of Stromness where many events and festivals are held. A vibrant area popular with both locals and visitors. | Stromness Library, Town Hall, Cultural festivals, Local markets, Art installations |
| Surfing Beach Area | Nearby beaches are well known for water sports, particularly windsurfing and kayaking. Attracts adventure seekers and nature lovers. | Brig o' Waithe Beach, Wind surfing spots, Kayaking expeditions, Wildlife watching, Scenic coastal walks |
| Orkney Museum District | Home to the Orkney Museum, the district attracts history enthusiasts keen to learn about the area’s rich Viking and prehistoric past. | Orkney Museum, Stromness Town Hall, Local art galleries, Historical walking tours, Viking sites nearby |
| Scapa Flow Viewpoints | Locations offering stunning views of Scapa Flow and the surrounding landscapes. Perfect for nature photographers and tranquility seekers. | Scapa Flow viewpoints, Nature trails, Wildlife spotting, Historical sites, Photography spots |
| Local Distillery Tours | The area is home to various distilleries producing unique whiskies. Attracts connoisseurs and tourists interested in local spirits. | Highland Park Distillery, Scapa Distillery, Distillery tours, Whiskey tasting events, Local craft shops |
| Nature Trails and Parks | Stromness is surrounded by beautiful nature trails and parks, attracting outdoor enthusiasts and families looking for recreational activities. | Stromness Parks, Hiking trails, Wildlife parks, Botanical Garden, Beach walks |
Understanding Airbnb License Requirements & STR Laws in Stromness (2025)
With 29% of listings showing registration in 2025, understanding potential Airbnb license requirements is crucial in Stromness. Always verify the latest short term rental regulations and Airbnb license requirements directly with local government authorities for Stromness to ensure full compliance before hosting.
(Source: AirROI data, 2025, based on 29% licensed listings)
Top Performing Airbnb Properties in Stromness (2025)
Benchmark your potential! Explore examples of top-performing Airbnb properties in Stromnessbased on Trailing Twelve Month (TTM) revenue. Analyze their characteristics, revenue, occupancy rate, and ADR to understand what drives success in this market.
Orkney Lux Lodges with Hot Tub in Stromness
Entire Place • N/A

Luxury seaside harbour house retreat with own pier
Entire Place • 3 bedrooms
Stylish, central harbour front apartment
Entire Place • 2 bedrooms

Merchants House
Entire Place • 4 bedrooms

Stromness Home with a View
Entire Place • 2 bedrooms

Harbour Cottage - Stromness
Entire Place • 2 bedrooms
Note: Performance varies based on location, size, amenities, seasonality, and management quality. Data reflects the past 12 months.
Top Performing Airbnb Hosts in Stromness (2025)
Learn from the best! This table showcases top-performing Airbnb hosts in Stromness based on the number of properties managed and estimated total revenue over the past year. Analyze their scale and performance metrics.
| Host Name | Properties | Grossing Revenue | Stay Reviews | Avg Rating |
|---|---|---|---|---|
| Lyndsey | 2 | $87,196 | 98 | 5.00/5.0 |
| Na'Ím Anis | 6 | $72,184 | 50 | 4.11/5.0 |
| Rosemary | 5 | $70,014 | 180 | 4.99/5.0 |
| Alexander | 3 | $69,064 | 56 | 4.60/5.0 |
| Deborah | 3 | $64,275 | 236 | 4.95/5.0 |
| Sandra | 2 | $63,690 | 123 | 4.99/5.0 |
| Holiday Orkney Letting Managem | 2 | $59,482 | 61 | 4.85/5.0 |
| Rebecca | 1 | $50,740 | 61 | 4.89/5.0 |
| Rachael | 1 | $46,618 | 24 | 4.96/5.0 |
| Evelyn | 3 | $46,568 | 23 | 4.96/5.0 |
Analyzing the strategies of top hosts, such as their property selection, pricing, and guest communication, can offer valuable lessons for optimizing your own Airbnb operations in Stromness.
Dive Deeper: Advanced Stromness STR Market Data (2025)
Ready to unlock more insights? AirROI provides access to advanced metrics and comprehensive Airbnb data for Stromness. Explore detailed analytics beyond this report to refine your investment strategy, optimize pricing, and maximize your vacation rental profits.
Explore Advanced MetricsStromness Short-Term Rental Market Composition (2025): Property & Room Types
Room Type Distribution
Property Type Distribution
Market Composition Insights for Stromness
- The Stromness Airbnb market composition is heavily skewed towards Entire Home/Apt listings, which make up 83.9% of the 56 active rentals. This indicates strong guest preference for privacy and space.
- Looking at the property type distribution in Stromness, House properties are the most common (66.1%), reflecting the local real estate landscape.
- Houses represent a significant 66.1% portion, catering likely to families or larger groups.
- The presence of 16.1% Hotel/Boutique listings indicates integration with traditional hospitality.
- Smaller segments like others, outdoor/unique (combined 5.4%) offer potential for unique stay experiences.
Stromness Airbnb Room Capacity Analysis (2025): Bedroom Distribution
Distribution of Listings by Number of Bedrooms
Room Capacity Insights for Stromness
- The dominant room capacity in Stromness is 2 bedrooms listings, making up 35.7% of the market. This suggests a strong demand for properties suitable for couples or solo travelers.
- Together, 2 bedrooms and 1 bedroom properties represent 55.3% of the active Airbnb listings in Stromness, indicating a high concentration in these sizes.
- A significant 25.0% of listings offer 3+ bedrooms, catering to larger groups and families seeking more space in Stromness.
Stromness Vacation Rental Guest Capacity Trends (2025)
Distribution of Listings by Guest Capacity
Guest Capacity Insights for Stromness
- The most common guest capacity trend in Stromness vacation rentals is listings accommodating 4 guests (32.1%). This suggests the primary traveler segment is likely small families or groups.
- Properties designed for 4 guests and 2 guests dominate the Stromness STR market, accounting for 53.5% of listings.
- 21.4% of properties accommodate 6+ guests, serving the market segment for larger families or group travel in Stromness.
- On average, properties in Stromness are equipped to host 3.9 guests.
Stromness Airbnb Booking Patterns (2025): Available vs. Booked Days
Available Days Distribution
Booked Days Distribution
Booking Pattern Insights for Stromness
- The most common availability pattern in Stromness falls within the 181-270 days range, representing 37.5% of listings. This suggests many properties have significant open periods on their calendars.
- Approximately 66.1% of listings show high availability (181+ days open annually), indicating potential for increased bookings or specific owner usage patterns.
- For booked days, the 181-270 days range is most frequent in Stromness (35.7%), reflecting common guest stay durations or potential owner blocking patterns.
- A notable 37.5% of properties secure long booking periods (181+ days booked per year), highlighting successful long-term rental strategies or significant owner usage.
Stromness Airbnb Minimum Stay Requirements Analysis
Distribution of Listings by Minimum Night Requirement
1 Night
2 listings
3.6% of total
2 Nights
5 listings
9.1% of total
3 Nights
17 listings
30.9% of total
4-6 Nights
11 listings
20% of total
7-29 Nights
9 listings
16.4% of total
30+ Nights
11 listings
20% of total
Key Insights
- The most prevalent minimum stay requirement in Stromness is 3 Nights, adopted by 30.9% of listings. This highlights the market's preference for longer commitments.
- Very short stays (1-2 nights) are less common (12.7%), suggesting hosts prefer slightly longer bookings to optimize turnover.
- A significant segment (20%) caters to monthly stays (30+ nights) in Stromness, pointing to opportunities in the extended-stay market.
Recommendations
- Align with the market by considering a 3 Nights minimum stay, as 30.9% of Stromness hosts use this setting.
- If feasible, allowing 1-night stays, especially midweek or during low season, could capture last-minute bookings, as only 3.6% currently do.
- Explore offering discounts for stays of 30+ nights to attract the 20% of the market seeking extended stays.
- Adjust minimum nights based on seasonality – potentially shorter during low season and longer during peak demand periods in Stromness.
Stromness Airbnb Cancellation Policy Trends Analysis (2025)
Flexible
6 listings
10.9% of total
Moderate
17 listings
30.9% of total
Firm
15 listings
27.3% of total
Strict
17 listings
30.9% of total
Cancellation Policy Insights for Stromness
- The prevailing Airbnb cancellation policy trend in Stromness is Moderate, used by 30.9% of listings.
- A majority (58.2%) of hosts in Stromness utilize Firm or Strict policies, indicating a market where hosts prioritize booking security.
Recommendations for Hosts
- Consider adopting a Moderate policy to align with the 30.9% market standard in Stromness.
- With 30.9% using Strict terms, this is a viable option in Stromness, particularly for high-value properties or during peak demand periods.
- Regularly review your cancellation policy against competitors and market demand shifts in Stromness.
Stromness STR Booking Lead Time Analysis (2025)
Average Booking Lead Time by Month
Booking Lead Time Insights for Stromness
- The overall average booking lead time for vacation rentals in Stromness is 94 days.
- Guests book furthest in advance for stays during July (average 168 days), likely coinciding with peak travel demand or local events.
- The shortest booking windows occur for stays in March (average 35 days), indicating more last-minute travel plans during this time.
- Seasonally, Summer (148 days avg.) sees the longest lead times, while Winter (61 days avg.) has the shortest, reflecting typical travel planning cycles.
Recommendations for Hosts
- Use the overall average lead time (94 days) as a baseline for your pricing and availability strategy in Stromness.
- For July stays, consider implementing length-of-stay discounts or slightly higher rates for bookings made less than 168 days out to capitalize on advance planning.
- Target marketing efforts for the Summer season well in advance (at least 148 days) to capture early planners.
- Monitor your own booking lead times against these Stromness averages to identify opportunities for dynamic pricing adjustments.
Popular & Essential Airbnb Amenities in Stromness (2025)
Amenity Prevalence
Amenity Insights for Stromness
- Essential amenities in Stromness that guests expect include: Smoke alarm, Wifi. Lacking these (any) could significantly impact bookings.
- Popular amenities like Heating, Essentials, TV are common but not universal. Offering these can provide a competitive edge.
Recommendations for Hosts
- Ensure your listing includes all essential amenities for Stromness: Smoke alarm, Wifi.
- Prioritize adding missing essentials: Smoke alarm, Wifi.
- Consider adding popular differentiators like Heating or Essentials to increase appeal.
- Highlight unique or less common amenities you offer (e.g., hot tub, dedicated workspace, EV charger) in your listing description and photos.
- Regularly check competitor amenities in Stromness to stay competitive.
Stromness Airbnb Guest Demographics & Profile Analysis (2025)
Guest Profile Summary for Stromness
- The typical guest profile for Airbnb in Stromness consists of a mix of domestic (64%) and international guests, often arriving from nearby England, typically belonging to the Post-2000s (Gen Z/Alpha) group (50%), primarily speaking English or French.
- Domestic travelers account for 63.5% of guests.
- Key international markets include United Kingdom (63.5%) and United States (13.1%).
- Top languages spoken are English (63%) followed by French (13%).
- A significant demographic segment is the Post-2000s (Gen Z/Alpha) group, representing 50% of guests.
Recommendations for Hosts
- Target domestic marketing efforts towards travelers from England and Scotland.
- Tailor amenities and listing descriptions to appeal to the dominant Post-2000s (Gen Z/Alpha) demographic (e.g., highlight fast WiFi, smart home features, local guides).
- Highlight unique local experiences or amenities relevant to the primary guest profile.
- Consider seasonal promotions aligned with peak travel times for key origin markets.
Nearby Short-Term Rental Market Comparison
How does the Stromness Airbnb market stack up against its neighbors? Compare key performance metrics like average monthly revenue, ADR, and occupancy rates in surrounding areas to understand the broader regional STR landscape.
| Market | Active Properties | Monthly Revenue | Daily Rate | Avg. Occupancy |
|---|---|---|---|---|
| Kirkhill | 10 | $5,719 | $700.26 | 44% |
| North Kessock | 10 | $5,421 | $380.62 | 58% |
| Foyers | 14 | $5,076 | $274.52 | 64% |
| Whitebridge | 10 | $4,907 | $417.35 | 42% |
| Insh | 14 | $4,473 | $289.96 | 63% |
| Nethy Bridge | 49 | $3,742 | $259.42 | 52% |
| Muir of Ord | 14 | $3,694 | $378.82 | 56% |
| Fochabers | 14 | $3,540 | $310.94 | 48% |
| Fort Augustus | 146 | $3,432 | $354.72 | 42% |
| Dulnain Bridge | 16 | $3,431 | $305.50 | 44% |