Stornoway Airbnb Market Analysis 2025: Short Term Rental Data & Vacation Rental Statistics in Scotland, United Kingdom
Is Airbnb profitable in Stornoway in 2025? Explore comprehensive Airbnb analytics for Stornoway, Scotland, United Kingdom to uncover income potential. This 2025 STR market report for Stornoway, based on AirROI data from April 2024 to March 2025, reveals key trends in the niche market of 69 active listings.
Whether you're considering an Airbnb investment in Stornoway, optimizing your existing vacation rental, or exploring rental arbitrage opportunities, understanding the Stornoway Airbnb data is crucial. Understanding the local regulations is key to maximizing your short term rental income potential. Let's dive into the specifics.
Key Stornoway Airbnb Performance Metrics Overview
Monthly Airbnb Revenue Variations & Income Potential in Stornoway (2025)
Understanding the monthly revenue variations for Airbnb listings in Stornoway is key to maximizing your short term rental income potential. Seasonality significantly impacts earnings. Our analysis, based on data from the past 12 months, shows that the peak revenue month for STRs in Stornoway is typically July, while February often presents the lowest earnings, highlighting opportunities for strategic pricing adjustments during shoulder and low seasons. Explore the typical Airbnb income in Stornoway across different performance tiers:
- Best-in-class properties (Top 10%) achieve $3,824+ monthly, often utilizing dynamic pricing and superior guest experiences.
- Strong performing properties (Top 25%) earn $3,048 or more, indicating effective management and desirable locations/amenities.
- Typical properties (Median) generate around $2,335 per month, representing the average market performance.
- Entry-level properties (Bottom 25%) see earnings around $1,680, often with potential for optimization.
Average Monthly Airbnb Earnings Trend in Stornoway
Stornoway Airbnb Occupancy Rate Trends (2025)
Maximize your bookings by understanding the Stornoway STR occupancy trends. Seasonal demand shifts significantly influence how often properties are booked. Typically, Augustsees the highest demand (peak season occupancy), while November experiences the lowest (low season). Effective strategies, like adjusting minimum stays or offering promotions, can boost occupancy during slower periods. Here's how different property tiers perform in Stornoway:
- Best-in-class properties (Top 10%) achieve 87%+ occupancy, indicating high desirability and potentially optimized availability.
- Strong performing properties (Top 25%) maintain 75% or higher occupancy, suggesting good market fit and guest satisfaction.
- Typical properties (Median) have an occupancy rate around 55%.
- Entry-level properties (Bottom 25%) average 38% occupancy, potentially facing higher vacancy.
Average Monthly Occupancy Rate Trend in Stornoway
Average Daily Rate (ADR) Airbnb Trends in Stornoway (2025)
Effective short term rental pricing strategy in Stornoway involves understanding monthly ADR fluctuations. The Average Daily Rate (ADR) for Airbnb in Stornoway typically peaks in July and dips lowest during February. Leveraging Airbnb dynamic pricing tools or strategies based on this seasonality can significantly boost revenue. Here's a look at the typical nightly rates achieved:
- Best-in-class properties (Top 10%) command rates of $378+ per night, often due to premium features or locations.
- Strong performing properties (Top 25%) achieve nightly rates of $182 or more.
- Typical properties (Median) charge around $141 per night.
- Entry-level properties (Bottom 25%) earn around $116 per night.
Average Daily Rate (ADR) Trend by Month in Stornoway
Get Live Stornoway Market Intelligence 👇

Explore Real-time Analytics
Airbnb Seasonality Analysis & Trends in Stornoway (2025)
Peak Season (July, August, June)
- Revenue averages $3,517 per month
- Occupancy rates average 72.5%
- Daily rates average $202
Shoulder Season
- Revenue averages $2,387 per month
- Occupancy maintains around 53.8%
- Daily rates hold near $182
Low Season (January, February, November)
- Revenue drops to average $1,506 per month
- Occupancy decreases to average 38.9%
- Daily rates adjust to average $170
Seasonality Insights for Stornoway
- The Airbnb seasonality in Stornoway shows highly seasonal trends requiring careful strategy. While the sections above show seasonal averages, it's also insightful to look at the extremes:
- During the high season, the absolute peak month showcases Stornoway's highest earning potential, with monthly revenues capable of climbing to $3,571, occupancy reaching a high of 75.2%, and ADRs peaking at $213.
- Conversely, the slowest single month of the year, typically falling within the low season, marks the market's lowest point. In this month, revenue might dip to $1,387, occupancy could drop to 37.9%, and ADRs may adjust down to $166.
- Understanding both the seasonal averages and these monthly peaks and troughs in revenue, occupancy, and ADR is crucial for maximizing your Airbnb profit potential in Stornoway.
Seasonal Strategies for Maximizing Profit
- Peak Season: Maximize revenue through premium pricing and potentially longer minimum stays. Ensure high availability.
- Low Season: Offer competitive pricing, special promotions (e.g., extended stay discounts), and flexible cancellation policies. Target off-season travelers like remote workers or budget-conscious guests.
- Shoulder Seasons: Implement dynamic pricing that balances peak and low rates. Target weekend travelers or specific events. Offer slightly more flexible terms than peak season.
- Regularly analyze your own performance against these Stornoway seasonality benchmarks and adjust your pricing and availability strategy accordingly.
Best Areas for Airbnb Investment in Stornoway (2025)
Exploring the top neighborhoods for short-term rentals in Stornoway? This section highlights key areas, outlining why they are attractive for hosts and guests, along with notable local attractions. Consider these locations based on your target guest profile and investment strategy.
| Neighborhood / Area | Why Host Here? (Target Guests & Appeal) | Key Attractions & Landmarks |
|---|---|---|
| Castle Street | A historic area in the heart of Stornoway, ideal for tourists wanting to explore local culture and heritage. Close to amenities and key attractions. | Stornoway Castle, Lews Castle Museum and Archive, The Kelpies, Celtic Arts Centre |
| Harbour Area | Stornoway's vibrant harbour offers scenic views and is popular with visitors who enjoy coastal walks and fresh seafood dining. | Stornoway Harbour, The Fisherman's Carving, Coastal Path to Sandwick, Local seafood restaurants |
| Sandwick | A charming area just outside Stornoway, known for its beautiful landscapes and close to the famous Callanish Standing Stones. | Callanish Stones, Carloway Broch, Great Bernera, Beach walks |
| Broadbay | A picturesque bay area popular with walkers and nature lovers. Offers stunning views and is favored for outdoor activities. | Broadbay Walks, Loch na Mair shoreline, Wildlife watching, Local beaches |
| Marybank | A pleasant residential area with local amenities, making it suitable for families visiting Stornoway. | Community Centre, Local shops, Nature trails nearby |
| Stornoway Town Centre | The commercial hub of Stornoway, offering shops, cafes, and restaurants,. Great for visitors who want to explore the urban side of the island. | Shopping district, Local pubs, Cafes, Stornoway Market |
| Perceval Square | A central square known for its events and gatherings, perfect for those looking to immerse in local life and community events. | Events and Festivals, Local markets, Public spaces |
| Gress | A scenic village close to Stornoway, offering tranquility and beautiful views, appealing to those seeking a peaceful retreat. | Gress Beach, Rural pathways, Local hiking trails |
Understanding Airbnb License Requirements & STR Laws in Stornoway (2025)
With 26% of listings showing registration in 2025, understanding potential Airbnb license requirements is crucial in Stornoway. Always verify the latest short term rental regulations and Airbnb license requirements directly with local government authorities for Stornoway to ensure full compliance before hosting.
(Source: AirROI data, 2025, based on 26% licensed listings)
Top Performing Airbnb Properties in Stornoway (2025)
Benchmark your potential! Explore examples of top-performing Airbnb properties in Stornowaybased on Trailing Twelve Month (TTM) revenue. Analyze their characteristics, revenue, occupancy rate, and ADR to understand what drives success in this market.
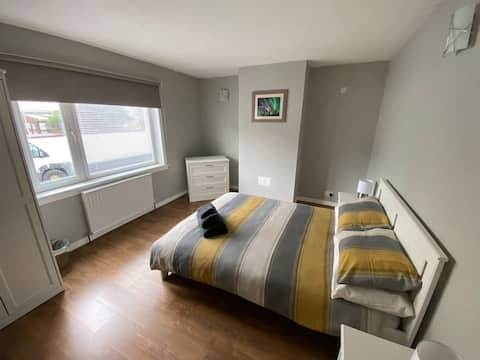
Spacious 7-Bedroom Home in Central Stornoway
Entire Place • 7 bedrooms
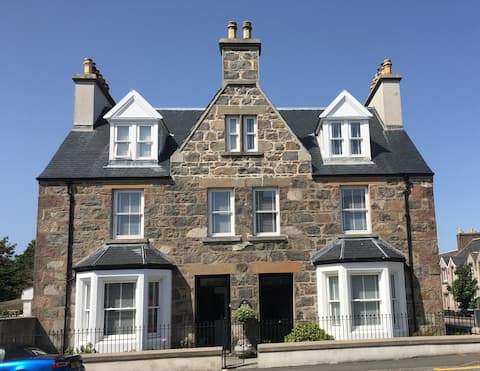
'Mo Eilean' - Your island home
Entire Place • 2 bedrooms

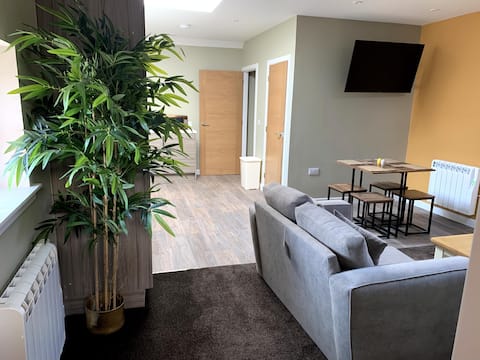
19a Francis Street
Entire Place • 3 bedrooms

The Whale’s Tail Townhouse Stornoway
Entire Place • 2 bedrooms

Flat 2 Decor8 flats
Entire Place • 2 bedrooms
Flat 3 Decor8
Entire Place • 2 bedrooms
Note: Performance varies based on location, size, amenities, seasonality, and management quality. Data reflects the past 12 months.
Top Performing Airbnb Hosts in Stornoway (2025)
Learn from the best! This table showcases top-performing Airbnb hosts in Stornoway based on the number of properties managed and estimated total revenue over the past year. Analyze their scale and performance metrics.
| Host Name | Properties | Grossing Revenue | Stay Reviews | Avg Rating |
|---|---|---|---|---|
| Doreen | 7 | $198,406 | 245 | 4.97/5.0 |
| Laura-Jayne | 3 | $96,768 | 332 | 4.91/5.0 |
| Lewis | 1 | $82,319 | 21 | 4.90/5.0 |
| Malcolm | 2 | $61,245 | 177 | 4.96/5.0 |
| William | 4 | $54,886 | 119 | 3.58/5.0 |
| Christiane | 1 | $45,341 | 44 | 5.00/5.0 |
| Evelyn | 1 | $43,707 | 14 | 4.93/5.0 |
| Jim | 1 | $41,495 | 94 | 4.99/5.0 |
| Mark | 1 | $36,665 | 202 | 4.98/5.0 |
| Mairi | 1 | $35,584 | 54 | 4.93/5.0 |
Analyzing the strategies of top hosts, such as their property selection, pricing, and guest communication, can offer valuable lessons for optimizing your own Airbnb operations in Stornoway.
Dive Deeper: Advanced Stornoway STR Market Data (2025)
Ready to unlock more insights? AirROI provides access to advanced metrics and comprehensive Airbnb data for Stornoway. Explore detailed analytics beyond this report to refine your investment strategy, optimize pricing, and maximize your vacation rental profits.
Explore Advanced MetricsStornoway Short-Term Rental Market Composition (2025): Property & Room Types
Room Type Distribution
Property Type Distribution
Market Composition Insights for Stornoway
- The Stornoway Airbnb market composition is heavily skewed towards Entire Home/Apt listings, which make up 97.1% of the 69 active rentals. This indicates strong guest preference for privacy and space.
- Looking at the property type distribution in Stornoway, Apartment/Condo properties are the most common (63.8%), reflecting the local real estate landscape.
- Houses represent a significant 34.8% portion, catering likely to families or larger groups.
- Smaller segments like hotel/boutique (combined 1.4%) offer potential for unique stay experiences.
Stornoway Airbnb Room Capacity Analysis (2025): Bedroom Distribution
Distribution of Listings by Number of Bedrooms
Room Capacity Insights for Stornoway
- The dominant room capacity in Stornoway is 2 bedrooms listings, making up 42% of the market. This suggests a strong demand for properties suitable for couples or solo travelers.
- Together, 2 bedrooms and 1 bedroom properties represent 78.2% of the active Airbnb listings in Stornoway, indicating a high concentration in these sizes.
Stornoway Vacation Rental Guest Capacity Trends (2025)
Distribution of Listings by Guest Capacity
Guest Capacity Insights for Stornoway
- The most common guest capacity trend in Stornoway vacation rentals is listings accommodating 2 guests (36.2%). This suggests the primary traveler segment is likely couples or solo travelers.
- Properties designed for 2 guests and 4 guests dominate the Stornoway STR market, accounting for 63.7% of listings.
- 15.9% of properties accommodate 6+ guests, serving the market segment for larger families or group travel in Stornoway.
- On average, properties in Stornoway are equipped to host 3.6 guests.
Stornoway Airbnb Booking Patterns (2025): Available vs. Booked Days
Available Days Distribution
Booked Days Distribution
Booking Pattern Insights for Stornoway
- The most common availability pattern in Stornoway falls within the 91-180 days range, representing 37.7% of listings. This suggests many properties have significant open periods on their calendars.
- Approximately 53.6% of listings show high availability (181+ days open annually), indicating potential for increased bookings or specific owner usage patterns.
- For booked days, the 181-270 days range is most frequent in Stornoway (37.7%), reflecting common guest stay durations or potential owner blocking patterns.
- A notable 47.8% of properties secure long booking periods (181+ days booked per year), highlighting successful long-term rental strategies or significant owner usage.
Stornoway Airbnb Minimum Stay Requirements Analysis
Distribution of Listings by Minimum Night Requirement
1 Night
5 listings
7.4% of total
2 Nights
25 listings
36.8% of total
3 Nights
20 listings
29.4% of total
4-6 Nights
8 listings
11.8% of total
7-29 Nights
5 listings
7.4% of total
30+ Nights
5 listings
7.4% of total
Key Insights
- The most prevalent minimum stay requirement in Stornoway is 2 Nights, adopted by 36.8% of listings. This highlights the market's preference for shorter, flexible bookings.
Recommendations
- Align with the market by considering a 2 Nights minimum stay, as 36.8% of Stornoway hosts use this setting.
- If feasible, allowing 1-night stays, especially midweek or during low season, could capture last-minute bookings, as only 7.4% currently do.
- A 2-night minimum appears standard (36.8%). Consider this for weekends or peak periods.
- Explore offering discounts for stays of 30+ nights to attract the 7.4% of the market seeking extended stays.
- Adjust minimum nights based on seasonality – potentially shorter during low season and longer during peak demand periods in Stornoway.
Stornoway Airbnb Cancellation Policy Trends Analysis (2025)
Flexible
27 listings
42.2% of total
Moderate
17 listings
26.6% of total
Firm
8 listings
12.5% of total
Strict
12 listings
18.8% of total
Cancellation Policy Insights for Stornoway
- The prevailing Airbnb cancellation policy trend in Stornoway is Flexible, used by 42.2% of listings.
- There's a relatively balanced mix between guest-friendly (68.8%) and stricter (31.3%) policies, offering choices for different guest needs.
Recommendations for Hosts
- Consider adopting a Flexible policy to align with the 42.2% market standard in Stornoway.
- Regularly review your cancellation policy against competitors and market demand shifts in Stornoway.
Stornoway STR Booking Lead Time Analysis (2025)
Average Booking Lead Time by Month
Booking Lead Time Insights for Stornoway
- The overall average booking lead time for vacation rentals in Stornoway is 67 days.
- Guests book furthest in advance for stays during July (average 122 days), likely coinciding with peak travel demand or local events.
- The shortest booking windows occur for stays in March (average 28 days), indicating more last-minute travel plans during this time.
- Seasonally, Summer (104 days avg.) sees the longest lead times, while Winter (38 days avg.) has the shortest, reflecting typical travel planning cycles.
Recommendations for Hosts
- Use the overall average lead time (67 days) as a baseline for your pricing and availability strategy in Stornoway.
- For July stays, consider implementing length-of-stay discounts or slightly higher rates for bookings made less than 122 days out to capitalize on advance planning.
- Target marketing efforts for the Summer season well in advance (at least 104 days) to capture early planners.
- Monitor your own booking lead times against these Stornoway averages to identify opportunities for dynamic pricing adjustments.
Popular & Essential Airbnb Amenities in Stornoway (2025)
Amenity Prevalence
Amenity Insights for Stornoway
- Essential amenities in Stornoway that guests expect include: TV, Kitchen, Wifi. Lacking these (any) could significantly impact bookings.
- Popular amenities like Heating, Smoke alarm, Washer are common but not universal. Offering these can provide a competitive edge.
Recommendations for Hosts
- Ensure your listing includes all essential amenities for Stornoway: TV, Kitchen, Wifi.
- Prioritize adding missing essentials: Kitchen, Wifi.
- Consider adding popular differentiators like Heating or Smoke alarm to increase appeal.
- Highlight unique or less common amenities you offer (e.g., hot tub, dedicated workspace, EV charger) in your listing description and photos.
- Regularly check competitor amenities in Stornoway to stay competitive.
Stornoway Airbnb Guest Demographics & Profile Analysis (2025)
Guest Profile Summary for Stornoway
- The typical guest profile for Airbnb in Stornoway consists of primarily domestic travelers (67%), often arriving from nearby Scotland, typically belonging to the Post-2000s (Gen Z/Alpha) group (50%), primarily speaking English or French.
- Domestic travelers account for 66.9% of guests.
- Key international markets include United Kingdom (66.9%) and United States (10.7%).
- Top languages spoken are English (60%) followed by French (12.4%).
- A significant demographic segment is the Post-2000s (Gen Z/Alpha) group, representing 50% of guests.
Recommendations for Hosts
- Target domestic marketing efforts towards travelers from Scotland and England.
- Tailor amenities and listing descriptions to appeal to the dominant Post-2000s (Gen Z/Alpha) demographic (e.g., highlight fast WiFi, smart home features, local guides).
- Highlight unique local experiences or amenities relevant to the primary guest profile.
- Consider seasonal promotions aligned with peak travel times for key origin markets.
Nearby Short-Term Rental Market Comparison
How does the Stornoway Airbnb market stack up against its neighbors? Compare key performance metrics like average monthly revenue, ADR, and occupancy rates in surrounding areas to understand the broader regional STR landscape.
| Market | Active Properties | Monthly Revenue | Daily Rate | Avg. Occupancy |
|---|---|---|---|---|
| Carbost | 26 | $5,209 | $324.31 | 62% |
| Port Failthe | 14 | $4,832 | $301.12 | 57% |
| Camuscross | 11 | $4,649 | $300.59 | 61% |
| Culnacnoc | 16 | $4,576 | $299.16 | 60% |
| Portree | 190 | $4,227 | $258.97 | 60% |
| Stein | 14 | $4,160 | $249.21 | 72% |
| Teangue | 16 | $4,109 | $239.94 | 61% |
| Isle of Skye | 13 | $4,072 | $249.35 | 60% |
| Satran | 12 | $4,058 | $232.31 | 75% |
| Portnalong | 21 | $4,008 | $200.07 | 68% |