Stirling Airbnb Market Analysis 2025: Short Term Rental Data & Vacation Rental Statistics in Scotland, United Kingdom
Is Airbnb profitable in Stirling in 2025? Explore comprehensive Airbnb analytics for Stirling, Scotland, United Kingdom to uncover income potential. This 2025 STR market report for Stirling, based on AirROI data from April 2024 to March 2025, reveals key trends in the niche market of 179 active listings.
Whether you're considering an Airbnb investment in Stirling, optimizing your existing vacation rental, or exploring rental arbitrage opportunities, understanding the Stirling Airbnb data is crucial. Navigating the high regulation landscape is key to maximizing your short term rental income potential. Let's dive into the specifics.
Key Stirling Airbnb Performance Metrics Overview
Monthly Airbnb Revenue Variations & Income Potential in Stirling (2025)
Understanding the monthly revenue variations for Airbnb listings in Stirling is key to maximizing your short term rental income potential. Seasonality significantly impacts earnings. Our analysis, based on data from the past 12 months, shows that the peak revenue month for STRs in Stirling is typically August, while January often presents the lowest earnings, highlighting opportunities for strategic pricing adjustments during shoulder and low seasons. Explore the typical Airbnb income in Stirling across different performance tiers:
- Best-in-class properties (Top 10%) achieve $5,946+ monthly, often utilizing dynamic pricing and superior guest experiences.
- Strong performing properties (Top 25%) earn $4,424 or more, indicating effective management and desirable locations/amenities.
- Typical properties (Median) generate around $3,166 per month, representing the average market performance.
- Entry-level properties (Bottom 25%) see earnings around $1,713, often with potential for optimization.
Average Monthly Airbnb Earnings Trend in Stirling
Stirling Airbnb Occupancy Rate Trends (2025)
Maximize your bookings by understanding the Stirling STR occupancy trends. Seasonal demand shifts significantly influence how often properties are booked. Typically, Augustsees the highest demand (peak season occupancy), while January experiences the lowest (low season). Effective strategies, like adjusting minimum stays or offering promotions, can boost occupancy during slower periods. Here's how different property tiers perform in Stirling:
- Best-in-class properties (Top 10%) achieve 87%+ occupancy, indicating high desirability and potentially optimized availability.
- Strong performing properties (Top 25%) maintain 76% or higher occupancy, suggesting good market fit and guest satisfaction.
- Typical properties (Median) have an occupancy rate around 58%.
- Entry-level properties (Bottom 25%) average 35% occupancy, potentially facing higher vacancy.
Average Monthly Occupancy Rate Trend in Stirling
Average Daily Rate (ADR) Airbnb Trends in Stirling (2025)
Effective short term rental pricing strategy in Stirling involves understanding monthly ADR fluctuations. The Average Daily Rate (ADR) for Airbnb in Stirling typically peaks in July and dips lowest during March. Leveraging Airbnb dynamic pricing tools or strategies based on this seasonality can significantly boost revenue. Here's a look at the typical nightly rates achieved:
- Best-in-class properties (Top 10%) command rates of $344+ per night, often due to premium features or locations.
- Strong performing properties (Top 25%) achieve nightly rates of $232 or more.
- Typical properties (Median) charge around $165 per night.
- Entry-level properties (Bottom 25%) earn around $110 per night.
Average Daily Rate (ADR) Trend by Month in Stirling
Get Live Stirling Market Intelligence 👇

Explore Real-time Analytics
Airbnb Seasonality Analysis & Trends in Stirling (2025)
Peak Season (August, July, June)
- Revenue averages $4,755 per month
- Occupancy rates average 67.6%
- Daily rates average $228
Shoulder Season
- Revenue averages $3,456 per month
- Occupancy maintains around 55.2%
- Daily rates hold near $221
Low Season (January, February, March)
- Revenue drops to average $2,235 per month
- Occupancy decreases to average 41.2%
- Daily rates adjust to average $215
Seasonality Insights for Stirling
- The Airbnb seasonality in Stirling shows highly seasonal trends requiring careful strategy. While the sections above show seasonal averages, it's also insightful to look at the extremes:
- During the high season, the absolute peak month showcases Stirling's highest earning potential, with monthly revenues capable of climbing to $4,799, occupancy reaching a high of 70.8%, and ADRs peaking at $230.
- Conversely, the slowest single month of the year, typically falling within the low season, marks the market's lowest point. In this month, revenue might dip to $2,189, occupancy could drop to 38.1%, and ADRs may adjust down to $210.
- Understanding both the seasonal averages and these monthly peaks and troughs in revenue, occupancy, and ADR is crucial for maximizing your Airbnb profit potential in Stirling.
Seasonal Strategies for Maximizing Profit
- Peak Season: Maximize revenue through premium pricing and potentially longer minimum stays. Ensure high availability.
- Low Season: Offer competitive pricing, special promotions (e.g., extended stay discounts), and flexible cancellation policies. Target off-season travelers like remote workers or budget-conscious guests.
- Shoulder Seasons: Implement dynamic pricing that balances peak and low rates. Target weekend travelers or specific events. Offer slightly more flexible terms than peak season.
- Regularly analyze your own performance against these Stirling seasonality benchmarks and adjust your pricing and availability strategy accordingly.
Best Areas for Airbnb Investment in Stirling (2025)
Exploring the top neighborhoods for short-term rentals in Stirling? This section highlights key areas, outlining why they are attractive for hosts and guests, along with notable local attractions. Consider these locations based on your target guest profile and investment strategy.
| Neighborhood / Area | Why Host Here? (Target Guests & Appeal) | Key Attractions & Landmarks |
|---|---|---|
| Stirling City Centre | The heart of Stirling, boasting historical sites, shops, and entertainment. Ideal for visitors wanting to explore the castle and enjoy local amenities. | Stirling Castle, The Old Town Jail, The Thistle Centre, Stirling Bridge, Argyll's Lodging |
| Bridge of Allan | A picturesque village known for its charm and proximity to nature. A popular location for families and tourists seeking relaxation and outdoor activities. | Bridge of Allan Golf Club, Allan Water, The Pathfoot, Stirling University, The Victoria Inn |
| Callander | Known as the 'Gateway to the Highlands', Callander is a popular spot for nature lovers and walkers, making it a fantastic location for hospitality. | Loch Lubnaig, Ben Ledi, Callander Crags, Callander Golf Club, The Rob Roy Way |
| Doune | A quaint village rich in history, Doune is famous for its castle and is close to stunning countryside, appealing to history buffs and nature enthusiasts alike. | Doune Castle, The Old Bridge of Doune, Trossachs National Park, The Wood of Doune, The River Teith |
| Menstrie | A suburban area close to the Ochil Hills, Menstrie is perfect for those seeking tranquility while still close to Stirling's attractions. | Ochil Hills, Menstrie Library, Menstrie Park, Local walking paths, Nearby nature reserves |
| Cambuskenneth | A peaceful village known for its historic abbey and beautiful views of the River Forth, ideal for visitors looking for a quiet retreat. | Cambuskenneth Abbey, The River Forth, Local walking routes, Stirling's Old Town, Nearby gardens |
| Kippen | A charming rural village with a strong community feel and easy access to the surrounding countryside, suitable for those looking to escape city life. | Kippen Church, Local walking paths, The Kippen Railway Path, Nearby farms, Kippen Community Hall |
| Plean | A small village offering a mix of local amenities and access to the countryside, great for travelers seeking budget-friendly options and outdoor activities. | Plean Country Park, Nearby golf courses, Local shops, Community events, The Plean Heritage Trail |
Understanding Airbnb License Requirements & STR Laws in Stirling (2025)
Yes, Stirling, Scotland, United Kingdom enforces high STR regulations. Obtaining a license and ensuring compliance is almost certainly required according to current 2025 STR laws. Always verify the latest short term rental regulations and Airbnb license requirements directly with local government authorities for Stirling to ensure full compliance before hosting.
(Source: AirROI data, 2025, based on 34% licensed listings)
Top Performing Airbnb Properties in Stirling (2025)
Benchmark your potential! Explore examples of top-performing Airbnb properties in Stirlingbased on Trailing Twelve Month (TTM) revenue. Analyze their characteristics, revenue, occupancy rate, and ADR to understand what drives success in this market.
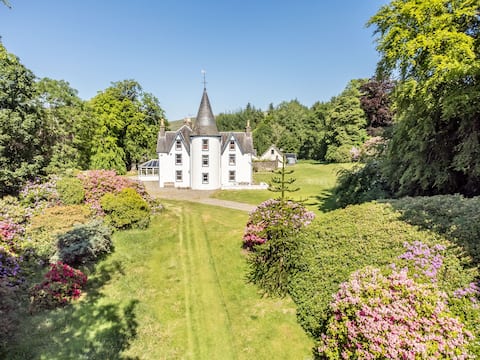
Cauldhame House w/spectacular views
Entire Place • 7 bedrooms
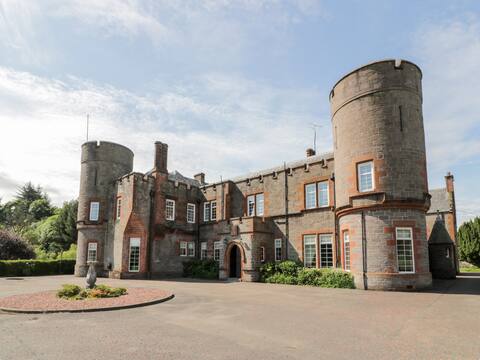
Auchentroig House
Entire Place • 6 bedrooms
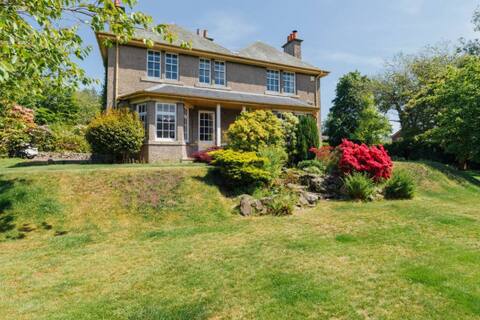
Newholme House
Entire Place • 8 bedrooms
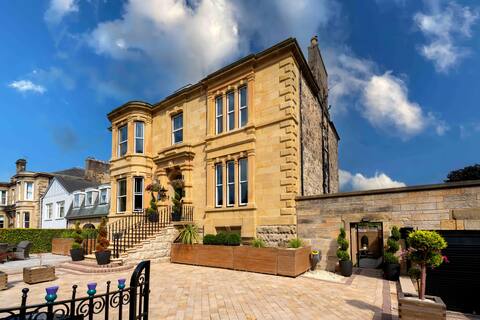
Luxury Garden Apartment in the heart of Stirling
Entire Place • 3 bedrooms
St John’s Jailhouse by the Castle
Entire Place • 3 bedrooms

Topaz - 5 bedroom lodge with private hot tub
Entire Place • N/A
Note: Performance varies based on location, size, amenities, seasonality, and management quality. Data reflects the past 12 months.
Top Performing Airbnb Hosts in Stirling (2025)
Learn from the best! This table showcases top-performing Airbnb hosts in Stirling based on the number of properties managed and estimated total revenue over the past year. Analyze their scale and performance metrics.
| Host Name | Properties | Grossing Revenue | Stay Reviews | Avg Rating |
|---|---|---|---|---|
| Martins | 11 | $433,009 | 664 | 4.78/5.0 |
| Benjamin | 7 | $358,166 | 739 | 4.90/5.0 |
| Elizabeth | 3 | $229,620 | 14 | 5.00/5.0 |
| Sakina | 7 | $221,246 | 122 | 3.49/5.0 |
| Diane | 4 | $205,478 | 308 | 4.96/5.0 |
| Cottages | 6 | $188,914 | 45 | 4.10/5.0 |
| Sykes Holiday Cottages Limited | 1 | $151,453 | 9 | 4.44/5.0 |
| Steven | 2 | $147,136 | 333 | 4.99/5.0 |
| Claire | 1 | $137,885 | 8 | 4.38/5.0 |
| Stuart | 4 | $136,596 | 123 | 4.99/5.0 |
Analyzing the strategies of top hosts, such as their property selection, pricing, and guest communication, can offer valuable lessons for optimizing your own Airbnb operations in Stirling.
Dive Deeper: Advanced Stirling STR Market Data (2025)
Ready to unlock more insights? AirROI provides access to advanced metrics and comprehensive Airbnb data for Stirling. Explore detailed analytics beyond this report to refine your investment strategy, optimize pricing, and maximize your vacation rental profits.
Explore Advanced MetricsStirling Short-Term Rental Market Composition (2025): Property & Room Types
Room Type Distribution
Property Type Distribution
Market Composition Insights for Stirling
- The Stirling Airbnb market composition is heavily skewed towards Entire Home/Apt listings, which make up 85.5% of the 179 active rentals. This indicates strong guest preference for privacy and space.
- Looking at the property type distribution in Stirling, House properties are the most common (41.9%), reflecting the local real estate landscape.
- Houses represent a significant 41.9% portion, catering likely to families or larger groups.
- The presence of 9.5% Hotel/Boutique listings indicates integration with traditional hospitality.
- Smaller segments like outdoor/unique, others, unique stays (combined 8.9%) offer potential for unique stay experiences.
Stirling Airbnb Room Capacity Analysis (2025): Bedroom Distribution
Distribution of Listings by Number of Bedrooms
Room Capacity Insights for Stirling
- The dominant room capacity in Stirling is 2 bedrooms listings, making up 41.3% of the market. This suggests a strong demand for properties suitable for couples or solo travelers.
- Together, 2 bedrooms and 1 bedroom properties represent 62.5% of the active Airbnb listings in Stirling, indicating a high concentration in these sizes.
- A significant 26.3% of listings offer 3+ bedrooms, catering to larger groups and families seeking more space in Stirling.
Stirling Vacation Rental Guest Capacity Trends (2025)
Distribution of Listings by Guest Capacity
Guest Capacity Insights for Stirling
- The most common guest capacity trend in Stirling vacation rentals is listings accommodating 4 guests (36.9%). This suggests the primary traveler segment is likely small families or groups.
- Properties designed for 4 guests and 6 guests dominate the Stirling STR market, accounting for 55.9% of listings.
- 29.1% of properties accommodate 6+ guests, serving the market segment for larger families or group travel in Stirling.
- On average, properties in Stirling are equipped to host 4.1 guests.
Stirling Airbnb Booking Patterns (2025): Available vs. Booked Days
Available Days Distribution
Booked Days Distribution
Booking Pattern Insights for Stirling
- The most common availability pattern in Stirling falls within the 91-180 days range, representing 35.8% of listings. This suggests many properties have significant open periods on their calendars.
- Approximately 50.3% of listings show high availability (181+ days open annually), indicating potential for increased bookings or specific owner usage patterns.
- For booked days, the 181-270 days range is most frequent in Stirling (36.3%), reflecting common guest stay durations or potential owner blocking patterns.
- A notable 51.4% of properties secure long booking periods (181+ days booked per year), highlighting successful long-term rental strategies or significant owner usage.
Stirling Airbnb Minimum Stay Requirements Analysis
Distribution of Listings by Minimum Night Requirement
1 Night
41 listings
23.4% of total
2 Nights
57 listings
32.6% of total
3 Nights
19 listings
10.9% of total
4-6 Nights
10 listings
5.7% of total
7-29 Nights
4 listings
2.3% of total
30+ Nights
44 listings
25.1% of total
Key Insights
- The most prevalent minimum stay requirement in Stirling is 2 Nights, adopted by 32.6% of listings. This highlights the market's preference for shorter, flexible bookings.
- A significant segment (25.1%) caters to monthly stays (30+ nights) in Stirling, pointing to opportunities in the extended-stay market.
Recommendations
- Align with the market by considering a 2 Nights minimum stay, as 32.6% of Stirling hosts use this setting.
- If feasible, allowing 1-night stays, especially midweek or during low season, could capture last-minute bookings, as only 23.4% currently do.
- Explore offering discounts for stays of 30+ nights to attract the 25.1% of the market seeking extended stays.
- Adjust minimum nights based on seasonality – potentially shorter during low season and longer during peak demand periods in Stirling.
Stirling Airbnb Cancellation Policy Trends Analysis (2025)
Super Strict 30 Days
5 listings
3% of total
Super Strict 60 Days
7 listings
4.2% of total
Refundable
4 listings
2.4% of total
Flexible
35 listings
21.2% of total
Moderate
33 listings
20% of total
Firm
40 listings
24.2% of total
Strict
41 listings
24.8% of total
Cancellation Policy Insights for Stirling
- The prevailing Airbnb cancellation policy trend in Stirling is Strict, used by 24.8% of listings.
- There's a relatively balanced mix between guest-friendly (41.2%) and stricter (49.0%) policies, offering choices for different guest needs.
Recommendations for Hosts
- Consider adopting a Strict policy to align with the 24.8% market standard in Stirling.
- Regularly review your cancellation policy against competitors and market demand shifts in Stirling.
Stirling STR Booking Lead Time Analysis (2025)
Average Booking Lead Time by Month
Booking Lead Time Insights for Stirling
- The overall average booking lead time for vacation rentals in Stirling is 60 days.
- Guests book furthest in advance for stays during June (average 105 days), likely coinciding with peak travel demand or local events.
- The shortest booking windows occur for stays in February (average 36 days), indicating more last-minute travel plans during this time.
- Seasonally, Summer (101 days avg.) sees the longest lead times, while Winter (55 days avg.) has the shortest, reflecting typical travel planning cycles.
Recommendations for Hosts
- Use the overall average lead time (60 days) as a baseline for your pricing and availability strategy in Stirling.
- For June stays, consider implementing length-of-stay discounts or slightly higher rates for bookings made less than 105 days out to capitalize on advance planning.
- Target marketing efforts for the Summer season well in advance (at least 101 days) to capture early planners.
- Monitor your own booking lead times against these Stirling averages to identify opportunities for dynamic pricing adjustments.
Popular & Essential Airbnb Amenities in Stirling (2025)
Amenity Prevalence
Amenity Insights for Stirling
- Essential amenities in Stirling that guests expect include: Wifi, Smoke alarm, Heating, TV. Lacking these (any) could significantly impact bookings.
- Popular amenities like Kitchen, Carbon monoxide alarm, Hot water are common but not universal. Offering these can provide a competitive edge.
Recommendations for Hosts
- Ensure your listing includes all essential amenities for Stirling: Wifi, Smoke alarm, Heating, TV.
- Prioritize adding missing essentials: Wifi, Smoke alarm, Heating, TV.
- Consider adding popular differentiators like Kitchen or Carbon monoxide alarm to increase appeal.
- Highlight unique or less common amenities you offer (e.g., hot tub, dedicated workspace, EV charger) in your listing description and photos.
- Regularly check competitor amenities in Stirling to stay competitive.
Stirling Airbnb Guest Demographics & Profile Analysis (2025)
Guest Profile Summary for Stirling
- The typical guest profile for Airbnb in Stirling consists of a mix of domestic (44%) and international guests, with top international origins including United States, typically belonging to the Post-2000s (Gen Z/Alpha) group (50%), primarily speaking English or French.
- Domestic travelers account for 43.7% of guests.
- Key international markets include United Kingdom (43.7%) and United States (22.1%).
- Top languages spoken are English (61%) followed by French (10.3%).
- A significant demographic segment is the Post-2000s (Gen Z/Alpha) group, representing 50% of guests.
Recommendations for Hosts
- Balance marketing efforts between domestic and international channels based on the guest mix.
- Tailor amenities and listing descriptions to appeal to the dominant Post-2000s (Gen Z/Alpha) demographic (e.g., highlight fast WiFi, smart home features, local guides).
- Highlight unique local experiences or amenities relevant to the primary guest profile.
- Consider seasonal promotions aligned with peak travel times for key origin markets.
Nearby Short-Term Rental Market Comparison
How does the Stirling Airbnb market stack up against its neighbors? Compare key performance metrics like average monthly revenue, ADR, and occupancy rates in surrounding areas to understand the broader regional STR landscape.
| Market | Active Properties | Monthly Revenue | Daily Rate | Avg. Occupancy |
|---|---|---|---|---|
| Galston | 11 | $7,951 | $676.77 | 46% |
| Fearnan | 19 | $6,440 | $421.92 | 53% |
| Gorebridge | 12 | $6,209 | $493.62 | 54% |
| Bridge of Cally | 16 | $5,839 | $566.24 | 50% |
| Kirkhill | 10 | $5,719 | $700.26 | 44% |
| Glenachulish | 33 | $5,609 | $424.51 | 46% |
| North Kessock | 10 | $5,421 | $380.62 | 58% |
| Foyers | 14 | $5,076 | $274.52 | 64% |
| Arrochar | 33 | $5,045 | $339.11 | 56% |
| Whitebridge | 10 | $4,907 | $417.35 | 42% |