Salen Airbnb Market Analysis 2025: Short Term Rental Data & Vacation Rental Statistics in Scotland, United Kingdom
Is Airbnb profitable in Salen in 2025? Explore comprehensive Airbnb analytics for Salen, Scotland, United Kingdom to uncover income potential. This 2025 STR market report for Salen, based on AirROI data from April 2024 to March 2025, reveals key trends in the niche market of 26 active listings.
Whether you're considering an Airbnb investment in Salen, optimizing your existing vacation rental, or exploring rental arbitrage opportunities, understanding the Salen Airbnb data is crucial. Understanding the local regulations is key to maximizing your short term rental income potential. Let's dive into the specifics.
Key Salen Airbnb Performance Metrics Overview
Monthly Airbnb Revenue Variations & Income Potential in Salen (2025)
Understanding the monthly revenue variations for Airbnb listings in Salen is key to maximizing your short term rental income potential. Seasonality significantly impacts earnings. Our analysis, based on data from the past 12 months, shows that the peak revenue month for STRs in Salen is typically May, while January often presents the lowest earnings, highlighting opportunities for strategic pricing adjustments during shoulder and low seasons. Explore the typical Airbnb income in Salen across different performance tiers:
- Best-in-class properties (Top 10%) achieve $4,585+ monthly, often utilizing dynamic pricing and superior guest experiences.
- Strong performing properties (Top 25%) earn $3,060 or more, indicating effective management and desirable locations/amenities.
- Typical properties (Median) generate around $1,909 per month, representing the average market performance.
- Entry-level properties (Bottom 25%) see earnings around $1,267, often with potential for optimization.
Average Monthly Airbnb Earnings Trend in Salen
Salen Airbnb Occupancy Rate Trends (2025)
Maximize your bookings by understanding the Salen STR occupancy trends. Seasonal demand shifts significantly influence how often properties are booked. Typically, Maysees the highest demand (peak season occupancy), while January experiences the lowest (low season). Effective strategies, like adjusting minimum stays or offering promotions, can boost occupancy during slower periods. Here's how different property tiers perform in Salen:
- Best-in-class properties (Top 10%) achieve 73%+ occupancy, indicating high desirability and potentially optimized availability.
- Strong performing properties (Top 25%) maintain 60% or higher occupancy, suggesting good market fit and guest satisfaction.
- Typical properties (Median) have an occupancy rate around 39%.
- Entry-level properties (Bottom 25%) average 25% occupancy, potentially facing higher vacancy.
Average Monthly Occupancy Rate Trend in Salen
Average Daily Rate (ADR) Airbnb Trends in Salen (2025)
Effective short term rental pricing strategy in Salen involves understanding monthly ADR fluctuations. The Average Daily Rate (ADR) for Airbnb in Salen typically peaks in December and dips lowest during April. Leveraging Airbnb dynamic pricing tools or strategies based on this seasonality can significantly boost revenue. Here's a look at the typical nightly rates achieved:
- Best-in-class properties (Top 10%) command rates of $246+ per night, often due to premium features or locations.
- Strong performing properties (Top 25%) achieve nightly rates of $186 or more.
- Typical properties (Median) charge around $146 per night.
- Entry-level properties (Bottom 25%) earn around $118 per night.
Average Daily Rate (ADR) Trend by Month in Salen
Get Live Salen Market Intelligence 👇

Explore Real-time Analytics
Airbnb Seasonality Analysis & Trends in Salen (2025)
Peak Season (May, June, August)
- Revenue averages $4,022 per month
- Occupancy rates average 66.1%
- Daily rates average $161
Shoulder Season
- Revenue averages $2,278 per month
- Occupancy maintains around 39.4%
- Daily rates hold near $162
Low Season (January, February, March)
- Revenue drops to average $1,204 per month
- Occupancy decreases to average 24.7%
- Daily rates adjust to average $168
Seasonality Insights for Salen
- The Airbnb seasonality in Salen shows highly seasonal trends requiring careful strategy. While the sections above show seasonal averages, it's also insightful to look at the extremes:
- During the high season, the absolute peak month showcases Salen's highest earning potential, with monthly revenues capable of climbing to $4,258, occupancy reaching a high of 69.9%, and ADRs peaking at $170.
- Conversely, the slowest single month of the year, typically falling within the low season, marks the market's lowest point. In this month, revenue might dip to $1,007, occupancy could drop to 21.2%, and ADRs may adjust down to $157.
- Understanding both the seasonal averages and these monthly peaks and troughs in revenue, occupancy, and ADR is crucial for maximizing your Airbnb profit potential in Salen.
Seasonal Strategies for Maximizing Profit
- Peak Season: Maximize revenue through premium pricing and potentially longer minimum stays. Ensure high availability.
- Low Season: Offer competitive pricing, special promotions (e.g., extended stay discounts), and flexible cancellation policies. Target off-season travelers like remote workers or budget-conscious guests.
- Shoulder Seasons: Implement dynamic pricing that balances peak and low rates. Target weekend travelers or specific events. Offer slightly more flexible terms than peak season.
- Regularly analyze your own performance against these Salen seasonality benchmarks and adjust your pricing and availability strategy accordingly.
Best Areas for Airbnb Investment in Salen (2025)
Exploring the top neighborhoods for short-term rentals in Salen? This section highlights key areas, outlining why they are attractive for hosts and guests, along with notable local attractions. Consider these locations based on your target guest profile and investment strategy.
| Neighborhood / Area | Why Host Here? (Target Guests & Appeal) | Key Attractions & Landmarks |
|---|---|---|
| Salen Village | A picturesque village known for its stunning scenery and proximity to the Isle of Mull's attractions. A tranquil place for tourists looking to experience the beauty of the Scottish Highlands. | Salen Bay, Loch Na Keal, Isle of Mull Wildlife, Salen Craft Centre, Calgary Bay |
| Tobermory | Famous for its colorful waterfront and vibrant arts community. A hub for tourists with excellent dining and shopping options, ideal for a short stay or vacation rental. | Tobermory Harbour, Tobermory Distillery, Mull Aquarium, Mull Museum, Tobermory Wildlife Tours |
| Dervaig | A charming village offering a peaceful retreat with rolling hills and nearby beaches. Great for families and nature lovers seeking a quiet escape in the Scottish countryside. | Dervaig Chocolate Company, Bunessan Bay, Aros Park, Wildlife watching opportunities |
| Calgary | Known for its beautiful beach and scenic views, Calgary attracts visitors looking for outdoor adventures and relaxation by the sea. | Calgary Beach, Calgary Farm, Balcraig Castle, Scenic walking trails |
| Iona | A small island with rich history and stunning landscapes, Iona attracts spiritual seekers and those interested in Scottish history and heritage. | Iona Abbey, Iona Heritage Centre, St. Oran's Chapel |
| Staffa | Home to the famous Fingal's Cave, this uninhabited island is a magnet for nature lovers and those interested in unique geological formations. | Fingal's Cave, Staffa Tours, Puffin watching |
| Fishnish | A lovely ferry terminal area with access to the Isle of Mull, making it a popular stopping point for travelers and an excellent location for short-term rentals. | Fishnish Pier, Loch Don, Scenic coastal views |
| Bunessan | A small village with proximity to beautiful beaches and the scenic countryside, Bunessan is well-suited for tourists seeking an authentic Scottish experience. | Bunessan Beach, Traigh Dhúth, Local pubs and eateries |
Understanding Airbnb License Requirements & STR Laws in Salen (2025)
With 23% of listings showing registration in 2025, understanding potential Airbnb license requirements is crucial in Salen. Always verify the latest short term rental regulations and Airbnb license requirements directly with local government authorities for Salen to ensure full compliance before hosting.
(Source: AirROI data, 2025, based on 23% licensed listings)
Top Performing Airbnb Properties in Salen (2025)
Benchmark your potential! Explore examples of top-performing Airbnb properties in Salenbased on Trailing Twelve Month (TTM) revenue. Analyze their characteristics, revenue, occupancy rate, and ADR to understand what drives success in this market.

Beach House
Entire Place • 5 bedrooms

Teacher's Apartment 2 bed with Wood Burning Stove
Entire Place • 2 bedrooms
Luxury double room with sea view & new en suite
Private Room • 1 bedroom

The Tower - our Scottish Castle in miniature.
Entire Place • 1 bedroom
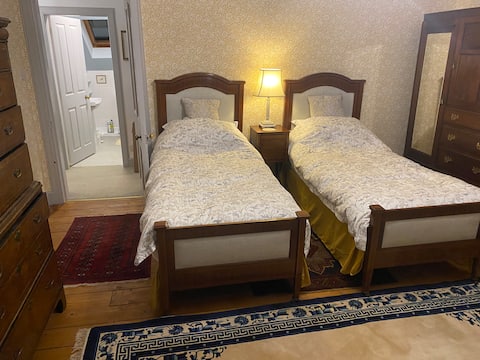
Twin Room B&B - Private Bathroom
Private Room • N/A

Cosy 1 Bedroom Self-Catering Flat by Loch Sunart
Entire Place • 1 bedroom
Note: Performance varies based on location, size, amenities, seasonality, and management quality. Data reflects the past 12 months.
Top Performing Airbnb Hosts in Salen (2025)
Learn from the best! This table showcases top-performing Airbnb hosts in Salen based on the number of properties managed and estimated total revenue over the past year. Analyze their scale and performance metrics.
| Host Name | Properties | Grossing Revenue | Stay Reviews | Avg Rating |
|---|---|---|---|---|
| West | 1 | $80,133 | 30 | 4.80/5.0 |
| Marcus | 2 | $76,883 | 6 | 5.00/5.0 |
| Ian | 4 | $66,431 | 664 | 4.83/5.0 |
| Heather | 1 | $54,588 | 97 | 4.97/5.0 |
| Stephen Gregor | 1 | $41,123 | 42 | 4.98/5.0 |
| Judith | 2 | $33,010 | 64 | 4.86/5.0 |
| Keri | 1 | $31,242 | 138 | 4.85/5.0 |
| Hazel | 1 | $30,524 | 74 | 4.97/5.0 |
| Lyn | 1 | $29,341 | 84 | 4.94/5.0 |
| Alicia | 1 | $22,240 | 124 | 4.77/5.0 |
Analyzing the strategies of top hosts, such as their property selection, pricing, and guest communication, can offer valuable lessons for optimizing your own Airbnb operations in Salen.
Dive Deeper: Advanced Salen STR Market Data (2025)
Ready to unlock more insights? AirROI provides access to advanced metrics and comprehensive Airbnb data for Salen. Explore detailed analytics beyond this report to refine your investment strategy, optimize pricing, and maximize your vacation rental profits.
Explore Advanced MetricsSalen Short-Term Rental Market Composition (2025): Property & Room Types
Room Type Distribution
Property Type Distribution
Market Composition Insights for Salen
- The Salen Airbnb market composition is heavily skewed towards Entire Home/Apt listings, which make up 69.2% of the 26 active rentals. This indicates strong guest preference for privacy and space.
- However, a notable 26.9% share for Private Rooms suggests opportunities for budget-conscious travelers or hosts renting out spare rooms.
- Looking at the property type distribution in Salen, House properties are the most common (38.5%), reflecting the local real estate landscape.
- Houses represent a significant 38.5% portion, catering likely to families or larger groups.
- The presence of 30.8% Hotel/Boutique listings indicates integration with traditional hospitality.
Salen Airbnb Room Capacity Analysis (2025): Bedroom Distribution
Distribution of Listings by Number of Bedrooms
Room Capacity Insights for Salen
- The dominant room capacity in Salen is 1 bedroom listings, making up 42.3% of the market. This suggests a strong demand for properties suitable for couples or solo travelers.
- Together, 1 bedroom and 2 bedrooms properties represent 65.4% of the active Airbnb listings in Salen, indicating a high concentration in these sizes.
Salen Vacation Rental Guest Capacity Trends (2025)
Distribution of Listings by Guest Capacity
Guest Capacity Insights for Salen
- The most common guest capacity trend in Salen vacation rentals is listings accommodating 2 guests (38.5%). This suggests the primary traveler segment is likely couples or solo travelers.
- Properties designed for 2 guests and 4 guests dominate the Salen STR market, accounting for 57.7% of listings.
- On average, properties in Salen are equipped to host 2.6 guests.
Salen Airbnb Booking Patterns (2025): Available vs. Booked Days
Available Days Distribution
Booked Days Distribution
Booking Pattern Insights for Salen
- The most common availability pattern in Salen falls within the 181-270 days range, representing 46.2% of listings. This suggests many properties have significant open periods on their calendars.
- Approximately 84.7% of listings show high availability (181+ days open annually), indicating potential for increased bookings or specific owner usage patterns.
- For booked days, the 91-180 days range is most frequent in Salen (50%), reflecting common guest stay durations or potential owner blocking patterns.
- A notable 15.3% of properties secure long booking periods (181+ days booked per year), highlighting successful long-term rental strategies or significant owner usage.
Salen Airbnb Minimum Stay Requirements Analysis
Distribution of Listings by Minimum Night Requirement
1 Night
7 listings
26.9% of total
2 Nights
4 listings
15.4% of total
3 Nights
4 listings
15.4% of total
4-6 Nights
3 listings
11.5% of total
7-29 Nights
6 listings
23.1% of total
30+ Nights
2 listings
7.7% of total
Key Insights
- The most prevalent minimum stay requirement in Salen is 1 Night, adopted by 26.9% of listings. This highlights the market's preference for shorter, flexible bookings.
Recommendations
- Align with the market by considering a 1 Night minimum stay, as 26.9% of Salen hosts use this setting.
- If feasible, allowing 1-night stays, especially midweek or during low season, could capture last-minute bookings, as only 26.9% currently do.
- Explore offering discounts for stays of 30+ nights to attract the 7.7% of the market seeking extended stays.
- Adjust minimum nights based on seasonality – potentially shorter during low season and longer during peak demand periods in Salen.
Salen Airbnb Cancellation Policy Trends Analysis (2025)
Super Strict 60 Days
2 listings
9.5% of total
Super Strict 30 Days
1 listings
4.8% of total
Flexible
3 listings
14.3% of total
Moderate
2 listings
9.5% of total
Firm
3 listings
14.3% of total
Strict
10 listings
47.6% of total
Cancellation Policy Insights for Salen
- The prevailing Airbnb cancellation policy trend in Salen is Strict, used by 47.6% of listings.
- A majority (61.9%) of hosts in Salen utilize Firm or Strict policies, indicating a market where hosts prioritize booking security.
Recommendations for Hosts
- Consider adopting a Strict policy to align with the 47.6% market standard in Salen.
- With 47.6% using Strict terms, this is a viable option in Salen, particularly for high-value properties or during peak demand periods.
- Regularly review your cancellation policy against competitors and market demand shifts in Salen.
Salen STR Booking Lead Time Analysis (2025)
Average Booking Lead Time by Month
Booking Lead Time Insights for Salen
- The overall average booking lead time for vacation rentals in Salen is 69 days.
- Guests book furthest in advance for stays during May (average 123 days), likely coinciding with peak travel demand or local events.
- The shortest booking windows occur for stays in March (average 17 days), indicating more last-minute travel plans during this time.
- Seasonally, Summer (81 days avg.) sees the longest lead times, while Fall (62 days avg.) has the shortest, reflecting typical travel planning cycles.
Recommendations for Hosts
- Use the overall average lead time (69 days) as a baseline for your pricing and availability strategy in Salen.
- For May stays, consider implementing length-of-stay discounts or slightly higher rates for bookings made less than 123 days out to capitalize on advance planning.
- Target marketing efforts for the Summer season well in advance (at least 81 days) to capture early planners.
- Monitor your own booking lead times against these Salen averages to identify opportunities for dynamic pricing adjustments.
Popular & Essential Airbnb Amenities in Salen (2025)
Amenity Prevalence
Amenity Insights for Salen
- Essential amenities in Salen that guests expect include: TV, Free parking on premises, Smoke alarm, Heating. Lacking these (any) could significantly impact bookings.
- Popular amenities like Wifi, Carbon monoxide alarm, Essentials are common but not universal. Offering these can provide a competitive edge.
- Warning: Wifi is not universally provided but is considered essential globally. Ensure reliable Wifi is offered.
Recommendations for Hosts
- Ensure your listing includes all essential amenities for Salen: TV, Free parking on premises, Smoke alarm, Heating.
- Prioritize adding missing essentials: Smoke alarm, Heating.
- Consider adding popular differentiators like Wifi or Carbon monoxide alarm to increase appeal.
- Highlight unique or less common amenities you offer (e.g., hot tub, dedicated workspace, EV charger) in your listing description and photos.
- Regularly check competitor amenities in Salen to stay competitive.
Salen Airbnb Guest Demographics & Profile Analysis (2025)
Guest Profile Summary for Salen
- The typical guest profile for Airbnb in Salen consists of a mix of domestic (64%) and international guests, often arriving from nearby England, typically belonging to the Post-2000s (Gen Z/Alpha) group (50%), primarily speaking English or French.
- Domestic travelers account for 64.3% of guests.
- Key international markets include United Kingdom (64.3%) and United States (9.5%).
- Top languages spoken are English (56.5%) followed by French (13.7%).
- A significant demographic segment is the Post-2000s (Gen Z/Alpha) group, representing 50% of guests.
Recommendations for Hosts
- Target domestic marketing efforts towards travelers from England and London.
- Tailor amenities and listing descriptions to appeal to the dominant Post-2000s (Gen Z/Alpha) demographic (e.g., highlight fast WiFi, smart home features, local guides).
- Highlight unique local experiences or amenities relevant to the primary guest profile.
- Consider seasonal promotions aligned with peak travel times for key origin markets.
Nearby Short-Term Rental Market Comparison
How does the Salen Airbnb market stack up against its neighbors? Compare key performance metrics like average monthly revenue, ADR, and occupancy rates in surrounding areas to understand the broader regional STR landscape.
| Market | Active Properties | Monthly Revenue | Daily Rate | Avg. Occupancy |
|---|---|---|---|---|
| Galston | 11 | $7,951 | $676.77 | 46% |
| Fearnan | 19 | $6,440 | $421.92 | 53% |
| Kirkhill | 10 | $5,719 | $700.26 | 44% |
| Glenachulish | 33 | $5,609 | $424.51 | 46% |
| North Kessock | 10 | $5,421 | $380.62 | 58% |
| Carbost | 26 | $5,209 | $324.31 | 62% |
| Foyers | 14 | $5,076 | $274.52 | 64% |
| Arrochar | 33 | $5,045 | $339.11 | 56% |
| Whitebridge | 10 | $4,907 | $417.35 | 42% |
| Port Failthe | 14 | $4,832 | $301.12 | 57% |