Rutherglen Airbnb Market Analysis 2025: Short Term Rental Data & Vacation Rental Statistics in Scotland, United Kingdom
Is Airbnb profitable in Rutherglen in 2025? Explore comprehensive Airbnb analytics for Rutherglen, Scotland, United Kingdom to uncover income potential. This 2025 STR market report for Rutherglen, based on AirROI data from April 2024 to March 2025, reveals key trends in the niche market of 21 active listings.
Whether you're considering an Airbnb investment in Rutherglen, optimizing your existing vacation rental, or exploring rental arbitrage opportunities, understanding the Rutherglen Airbnb data is crucial. Leveraging the low regulation environment is key to maximizing your short term rental income potential. Let's dive into the specifics.
Key Rutherglen Airbnb Performance Metrics Overview
Monthly Airbnb Revenue Variations & Income Potential in Rutherglen (2025)
Understanding the monthly revenue variations for Airbnb listings in Rutherglen is key to maximizing your short term rental income potential. Seasonality significantly impacts earnings. Our analysis, based on data from the past 12 months, shows that the peak revenue month for STRs in Rutherglen is typically June, while February often presents the lowest earnings, highlighting opportunities for strategic pricing adjustments during shoulder and low seasons. Explore the typical Airbnb income in Rutherglen across different performance tiers:
- Best-in-class properties (Top 10%) achieve $4,276+ monthly, often utilizing dynamic pricing and superior guest experiences.
- Strong performing properties (Top 25%) earn $2,711 or more, indicating effective management and desirable locations/amenities.
- Typical properties (Median) generate around $1,296 per month, representing the average market performance.
- Entry-level properties (Bottom 25%) see earnings around $665, often with potential for optimization.
Average Monthly Airbnb Earnings Trend in Rutherglen
Rutherglen Airbnb Occupancy Rate Trends (2025)
Maximize your bookings by understanding the Rutherglen STR occupancy trends. Seasonal demand shifts significantly influence how often properties are booked. Typically, Octobersees the highest demand (peak season occupancy), while November experiences the lowest (low season). Effective strategies, like adjusting minimum stays or offering promotions, can boost occupancy during slower periods. Here's how different property tiers perform in Rutherglen:
- Best-in-class properties (Top 10%) achieve 76%+ occupancy, indicating high desirability and potentially optimized availability.
- Strong performing properties (Top 25%) maintain 59% or higher occupancy, suggesting good market fit and guest satisfaction.
- Typical properties (Median) have an occupancy rate around 34%.
- Entry-level properties (Bottom 25%) average 14% occupancy, potentially facing higher vacancy.
Average Monthly Occupancy Rate Trend in Rutherglen
Average Daily Rate (ADR) Airbnb Trends in Rutherglen (2025)
Effective short term rental pricing strategy in Rutherglen involves understanding monthly ADR fluctuations. The Average Daily Rate (ADR) for Airbnb in Rutherglen typically peaks in July and dips lowest during January. Leveraging Airbnb dynamic pricing tools or strategies based on this seasonality can significantly boost revenue. Here's a look at the typical nightly rates achieved:
- Best-in-class properties (Top 10%) command rates of $292+ per night, often due to premium features or locations.
- Strong performing properties (Top 25%) achieve nightly rates of $187 or more.
- Typical properties (Median) charge around $143 per night.
- Entry-level properties (Bottom 25%) earn around $106 per night.
Average Daily Rate (ADR) Trend by Month in Rutherglen
Get Live Rutherglen Market Intelligence 👇

Explore Real-time Analytics
Airbnb Seasonality Analysis & Trends in Rutherglen (2025)
Peak Season (June, April, May)
- Revenue averages $2,321 per month
- Occupancy rates average 38.0%
- Daily rates average $233
Shoulder Season
- Revenue averages $1,826 per month
- Occupancy maintains around 42.1%
- Daily rates hold near $209
Low Season (January, February, November)
- Revenue drops to average $1,303 per month
- Occupancy decreases to average 32.5%
- Daily rates adjust to average $149
Seasonality Insights for Rutherglen
- The Airbnb seasonality in Rutherglen shows moderate seasonality with distinct peak and low periods. While the sections above show seasonal averages, it's also insightful to look at the extremes:
- During the high season, the absolute peak month showcases Rutherglen's highest earning potential, with monthly revenues capable of climbing to $2,379, occupancy reaching a high of 47.6%, and ADRs peaking at $240.
- Conversely, the slowest single month of the year, typically falling within the low season, marks the market's lowest point. In this month, revenue might dip to $1,229, occupancy could drop to 30.3%, and ADRs may adjust down to $147.
- Understanding both the seasonal averages and these monthly peaks and troughs in revenue, occupancy, and ADR is crucial for maximizing your Airbnb profit potential in Rutherglen.
Seasonal Strategies for Maximizing Profit
- Peak Season: Maximize revenue through premium pricing and potentially longer minimum stays. Ensure high availability.
- Low Season: Offer competitive pricing, special promotions (e.g., extended stay discounts), and flexible cancellation policies. Target off-season travelers like remote workers or budget-conscious guests.
- Shoulder Seasons: Implement dynamic pricing that balances peak and low rates. Target weekend travelers or specific events. Offer slightly more flexible terms than peak season.
- Regularly analyze your own performance against these Rutherglen seasonality benchmarks and adjust your pricing and availability strategy accordingly.
Best Areas for Airbnb Investment in Rutherglen (2025)
Exploring the top neighborhoods for short-term rentals in Rutherglen? This section highlights key areas, outlining why they are attractive for hosts and guests, along with notable local attractions. Consider these locations based on your target guest profile and investment strategy.
| Neighborhood / Area | Why Host Here? (Target Guests & Appeal) | Key Attractions & Landmarks |
|---|---|---|
| Rutherglen Town Centre | The town center offers easy access to transportation links, shops, and local amenities, making it attractive for both short-term and long-term stays. | Rutherglen Town Hall, Rutherglen Golf Club, Local shops and restaurants, Clyde Walkway, Cambuslang Park |
| Burnside | A residential area with a mix of local charm and convenience, Burnside is appealing to families and those looking for a quieter stay while still being close to Glasgow. | Burnside Park, Local cafes and pubs, Quick access to Glasgow city center, Train station links |
| Cambuslang | Just north of Rutherglen, Cambuslang offers a variety of parks and recreational options, and is well-connected to public transport for quick access to greater Glasgow. | Clyde Bridge, Clyde Walkway, Cambuslang Park, Shopping areas, Local eateries |
| Croftfoot | Croftfoot provides a suburban feel with green spaces, great for visitors wanting a peaceful getaway while being a short distance from the city life of Glasgow. | Hampden Park, Local parks, Transport links to the city |
| Kingston | A developing area that offers proximity to recreational facilities and vibrant local culture. Ideal for travelers looking for local experiences. | Kingston Park, Local dining options, Easy access to the River Clyde |
| Westburn | Westburn is a quieter part of Rutherglen, ideal for travelers looking to relax and explore the local park and nearby attractions. | Local parks, Westburn Park, Community events, Proximity to local shops |
| Mosspark | Mosspark provides excellent access to both park areas and local amenities. Ideal for families and tourists wanting to enjoy a more residential experience. | Mosspark Boulevard, Local stores, Transport links to the city |
| Clincarthill | An emerging neighborhood with green spaces, Clincarthill is suited for those looking for a balance of urban and suburban living, with easy access to transport and nature walks. | Clincarthill Park, Local eateries, Quick access to Glasgow city center |
Understanding Airbnb License Requirements & STR Laws in Rutherglen (2025)
While Rutherglen, Scotland, United Kingdom currently shows low STR regulations, specific Airbnb license requirements might still exist or change. Always verify the latest short term rental regulations and Airbnb license requirements directly with local government authorities for Rutherglen to ensure full compliance before hosting.
(Source: AirROI data, 2025, based on 10% licensed listings)
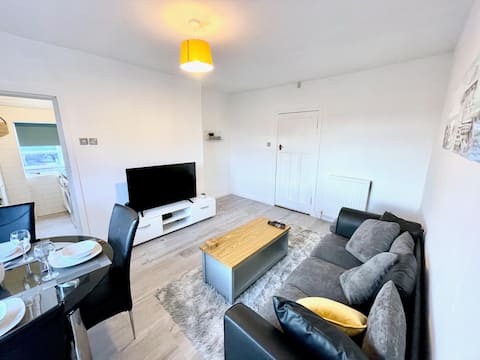
Top Performing Airbnb Properties in Rutherglen (2025)
Benchmark your potential! Explore examples of top-performing Airbnb properties in Rutherglenbased on Trailing Twelve Month (TTM) revenue. Analyze their characteristics, revenue, occupancy rate, and ADR to understand what drives success in this market.
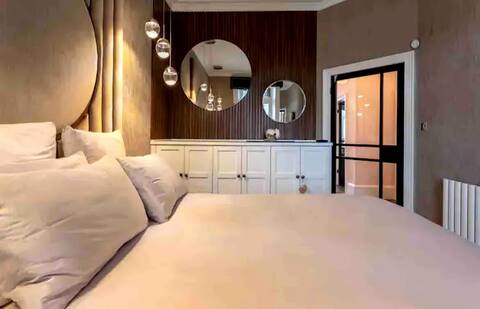
Stylish Luxury Pad w/ hot tub
Entire Place • 2 bedrooms

The Terrace
Entire Place • 2 bedrooms
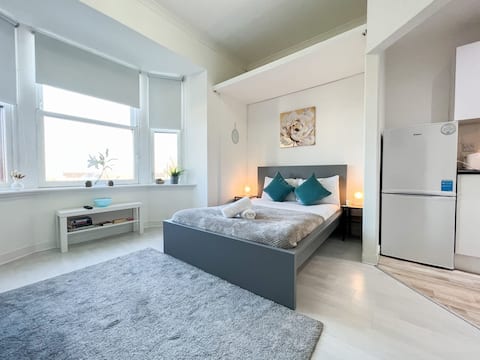
1Bd Glasgow Apartment
Entire Place • 1 bedroom
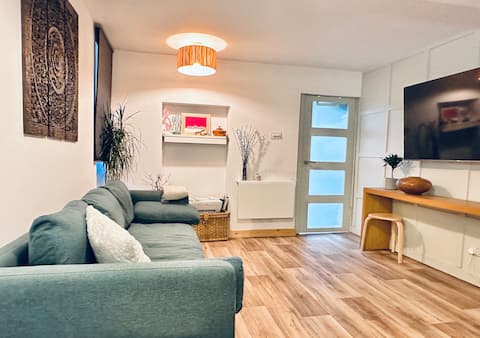
Casa Mia Garden flat Glasgow
Entire Place • 1 bedroom
Kingsbridge Apartment
Entire Place • 3 bedrooms
Entire Charming 2 Double Bedroom Flat with Parking
Entire Place • 2 bedrooms
Note: Performance varies based on location, size, amenities, seasonality, and management quality. Data reflects the past 12 months.
Top Performing Airbnb Hosts in Rutherglen (2025)
Learn from the best! This table showcases top-performing Airbnb hosts in Rutherglen based on the number of properties managed and estimated total revenue over the past year. Analyze their scale and performance metrics.
| Host Name | Properties | Grossing Revenue | Stay Reviews | Avg Rating |
|---|---|---|---|---|
| Laura | 1 | $58,683 | 82 | 4.93/5.0 |
| Marion | 1 | $42,007 | 115 | 4.87/5.0 |
| Rajesh | 5 | $40,561 | 58 | 4.20/5.0 |
| Akash | 1 | $24,934 | 23 | 4.17/5.0 |
| Pam | 2 | $23,930 | 72 | 4.91/5.0 |
| Shannon | 1 | $23,144 | 6 | 4.83/5.0 |
| Host #17145557 | 1 | $22,861 | 7 | 3.86/5.0 |
| Elsa | 3 | $19,667 | 22 | 4.78/5.0 |
| Carolina Isabel | 1 | $13,955 | 153 | 4.72/5.0 |
| Sandy Short For Alexander | 1 | $8,583 | 99 | 4.92/5.0 |
Analyzing the strategies of top hosts, such as their property selection, pricing, and guest communication, can offer valuable lessons for optimizing your own Airbnb operations in Rutherglen.
Dive Deeper: Advanced Rutherglen STR Market Data (2025)
Ready to unlock more insights? AirROI provides access to advanced metrics and comprehensive Airbnb data for Rutherglen. Explore detailed analytics beyond this report to refine your investment strategy, optimize pricing, and maximize your vacation rental profits.
Explore Advanced MetricsRutherglen Short-Term Rental Market Composition (2025): Property & Room Types
Room Type Distribution
Property Type Distribution
Market Composition Insights for Rutherglen
- The Rutherglen Airbnb market composition is heavily skewed towards Private Room listings, which make up 57.1% of the 21 active rentals. This indicates strong guest preference for privacy and space.
- Looking at the property type distribution in Rutherglen, Apartment/Condo properties are the most common (47.6%), reflecting the local real estate landscape.
- Houses represent a significant 23.8% portion, catering likely to families or larger groups.
- The presence of 23.8% Hotel/Boutique listings indicates integration with traditional hospitality.
- Smaller segments like others (combined 4.8%) offer potential for unique stay experiences.
Rutherglen Airbnb Room Capacity Analysis (2025): Bedroom Distribution
Distribution of Listings by Number of Bedrooms
Room Capacity Insights for Rutherglen
- The dominant room capacity in Rutherglen is 1 bedroom listings, making up 38.1% of the market. This suggests a strong demand for properties suitable for couples or solo travelers.
- Together, 1 bedroom and 2 bedrooms properties represent 61.9% of the active Airbnb listings in Rutherglen, indicating a high concentration in these sizes.
- Listings with 3+ bedrooms (4.8%) represent a smaller niche, potentially indicating an underserved market for larger group accommodations in Rutherglen.
Rutherglen Vacation Rental Guest Capacity Trends (2025)
Distribution of Listings by Guest Capacity
Guest Capacity Insights for Rutherglen
- The most common guest capacity trend in Rutherglen vacation rentals is listings accommodating 4 guests (23.8%). This suggests the primary traveler segment is likely small families or groups.
- Properties designed for 4 guests and 2 guests dominate the Rutherglen STR market, accounting for 47.6% of listings.
- On average, properties in Rutherglen are equipped to host 2.2 guests.
Rutherglen Airbnb Booking Patterns (2025): Available vs. Booked Days
Available Days Distribution
Booked Days Distribution
Booking Pattern Insights for Rutherglen
- The most common availability pattern in Rutherglen falls within the 271-366 days range, representing 61.9% of listings. This suggests many properties have significant open periods on their calendars.
- Approximately 80.9% of listings show high availability (181+ days open annually), indicating potential for increased bookings or specific owner usage patterns.
- For booked days, the 31-90 days range is most frequent in Rutherglen (33.3%), reflecting common guest stay durations or potential owner blocking patterns.
- A notable 19.0% of properties secure long booking periods (181+ days booked per year), highlighting successful long-term rental strategies or significant owner usage.
Rutherglen Airbnb Minimum Stay Requirements Analysis
Distribution of Listings by Minimum Night Requirement
1 Night
15 listings
75% of total
2 Nights
3 listings
15% of total
3 Nights
1 listings
5% of total
7-29 Nights
1 listings
5% of total
Key Insights
- The most prevalent minimum stay requirement in Rutherglen is 1 Night, adopted by 75% of listings. This highlights the market's preference for shorter, flexible bookings.
- A strong majority (90.0%) of the Rutherglen Airbnb data shows acceptance of very short stays (1-2 nights), indicating a dynamic, high-turnover market.
Recommendations
- Align with the market by considering a 1 Night minimum stay, as 75% of Rutherglen hosts use this setting.
- Adjust minimum nights based on seasonality – potentially shorter during low season and longer during peak demand periods in Rutherglen.
Rutherglen Airbnb Cancellation Policy Trends Analysis (2025)
Non-refundable
2 listings
10.5% of total
Refundable
3 listings
15.8% of total
Flexible
5 listings
26.3% of total
Moderate
3 listings
15.8% of total
Firm
4 listings
21.1% of total
Strict
2 listings
10.5% of total
Cancellation Policy Insights for Rutherglen
- The prevailing Airbnb cancellation policy trend in Rutherglen is Flexible, used by 26.3% of listings.
- There's a relatively balanced mix between guest-friendly (42.1%) and stricter (31.6%) policies, offering choices for different guest needs.
Recommendations for Hosts
- Consider adopting a Flexible policy to align with the 26.3% market standard in Rutherglen.
- Using a Strict policy might deter some guests, as only 10.5% of listings use it. Evaluate if potential revenue protection outweighs possible lower booking rates.
- Regularly review your cancellation policy against competitors and market demand shifts in Rutherglen.
Rutherglen STR Booking Lead Time Analysis (2025)
Average Booking Lead Time by Month
Booking Lead Time Insights for Rutherglen
- The overall average booking lead time for vacation rentals in Rutherglen is 29 days.
- Guests book furthest in advance for stays during July (average 90 days), likely coinciding with peak travel demand or local events.
- The shortest booking windows occur for stays in November (average 19 days), indicating more last-minute travel plans during this time.
- Seasonally, Summer (67 days avg.) sees the longest lead times, while Fall (25 days avg.) has the shortest, reflecting typical travel planning cycles.
Recommendations for Hosts
- Use the overall average lead time (29 days) as a baseline for your pricing and availability strategy in Rutherglen.
- For July stays, consider implementing length-of-stay discounts or slightly higher rates for bookings made less than 90 days out to capitalize on advance planning.
- Target marketing efforts for the Summer season well in advance (at least 67 days) to capture early planners.
- Monitor your own booking lead times against these Rutherglen averages to identify opportunities for dynamic pricing adjustments.
Popular & Essential Airbnb Amenities in Rutherglen (2025)
Amenity Prevalence
Amenity Insights for Rutherglen
- Essential amenities in Rutherglen that guests expect include: Wifi. Lacking these (this) could significantly impact bookings.
- Popular amenities like Free parking on premises, TV, Dedicated workspace are common but not universal. Offering these can provide a competitive edge.
Recommendations for Hosts
- Ensure your listing includes all essential amenities for Rutherglen: Wifi.
- Consider adding popular differentiators like Free parking on premises or TV to increase appeal.
- Highlight unique or less common amenities you offer (e.g., hot tub, dedicated workspace, EV charger) in your listing description and photos.
- Regularly check competitor amenities in Rutherglen to stay competitive.
Rutherglen Airbnb Guest Demographics & Profile Analysis (2025)
Guest Profile Summary for Rutherglen
- The typical guest profile for Airbnb in Rutherglen consists of a mix of domestic (63%) and international guests, often arriving from nearby England, typically belonging to the Post-2000s (Gen Z/Alpha) group (50%), primarily speaking English or French.
- Domestic travelers account for 62.9% of guests.
- Key international markets include United Kingdom (62.9%) and United States (12.9%).
- Top languages spoken are English (57.8%) followed by French (7.8%).
- A significant demographic segment is the Post-2000s (Gen Z/Alpha) group, representing 50% of guests.
Recommendations for Hosts
- Target domestic marketing efforts towards travelers from England and Glasgow.
- Tailor amenities and listing descriptions to appeal to the dominant Post-2000s (Gen Z/Alpha) demographic (e.g., highlight fast WiFi, smart home features, local guides).
- Highlight unique local experiences or amenities relevant to the primary guest profile.
- Consider seasonal promotions aligned with peak travel times for key origin markets.
Nearby Short-Term Rental Market Comparison
How does the Rutherglen Airbnb market stack up against its neighbors? Compare key performance metrics like average monthly revenue, ADR, and occupancy rates in surrounding areas to understand the broader regional STR landscape.
| Market | Active Properties | Monthly Revenue | Daily Rate | Avg. Occupancy |
|---|---|---|---|---|
| Galston | 11 | $7,951 | $676.77 | 46% |
| Fearnan | 19 | $6,440 | $421.92 | 53% |
| Gorebridge | 12 | $6,209 | $493.62 | 54% |
| Bridge of Cally | 16 | $5,839 | $566.24 | 50% |
| Glenachulish | 33 | $5,609 | $424.51 | 46% |
| Arrochar | 33 | $5,045 | $339.11 | 56% |
| Acharn | 10 | $4,813 | $278.43 | 57% |
| Croftamie | 19 | $4,609 | $267.39 | 52% |
| Carrick Castle | 11 | $4,591 | $586.01 | 42% |
| Corran | 24 | $4,576 | $370.68 | 45% |