Roybridge Airbnb Market Analysis 2025: Short Term Rental Data & Vacation Rental Statistics in Scotland, United Kingdom
Is Airbnb profitable in Roybridge in 2025? Explore comprehensive Airbnb analytics for Roybridge, Scotland, United Kingdom to uncover income potential. This 2025 STR market report for Roybridge, based on AirROI data from April 2024 to March 2025, reveals key trends in the niche market of 27 active listings.
Whether you're considering an Airbnb investment in Roybridge, optimizing your existing vacation rental, or exploring rental arbitrage opportunities, understanding the Roybridge Airbnb data is crucial. Understanding the local regulations is key to maximizing your short term rental income potential. Let's dive into the specifics.
Key Roybridge Airbnb Performance Metrics Overview
Monthly Airbnb Revenue Variations & Income Potential in Roybridge (2025)
Understanding the monthly revenue variations for Airbnb listings in Roybridge is key to maximizing your short term rental income potential. Seasonality significantly impacts earnings. Our analysis, based on data from the past 12 months, shows that the peak revenue month for STRs in Roybridge is typically August, while March often presents the lowest earnings, highlighting opportunities for strategic pricing adjustments during shoulder and low seasons. Explore the typical Airbnb income in Roybridge across different performance tiers:
- Best-in-class properties (Top 10%) achieve $4,226+ monthly, often utilizing dynamic pricing and superior guest experiences.
- Strong performing properties (Top 25%) earn $3,032 or more, indicating effective management and desirable locations/amenities.
- Typical properties (Median) generate around $1,872 per month, representing the average market performance.
- Entry-level properties (Bottom 25%) see earnings around $1,138, often with potential for optimization.
Average Monthly Airbnb Earnings Trend in Roybridge
Roybridge Airbnb Occupancy Rate Trends (2025)
Maximize your bookings by understanding the Roybridge STR occupancy trends. Seasonal demand shifts significantly influence how often properties are booked. Typically, Augustsees the highest demand (peak season occupancy), while January experiences the lowest (low season). Effective strategies, like adjusting minimum stays or offering promotions, can boost occupancy during slower periods. Here's how different property tiers perform in Roybridge:
- Best-in-class properties (Top 10%) achieve 75%+ occupancy, indicating high desirability and potentially optimized availability.
- Strong performing properties (Top 25%) maintain 61% or higher occupancy, suggesting good market fit and guest satisfaction.
- Typical properties (Median) have an occupancy rate around 40%.
- Entry-level properties (Bottom 25%) average 23% occupancy, potentially facing higher vacancy.
Average Monthly Occupancy Rate Trend in Roybridge
Average Daily Rate (ADR) Airbnb Trends in Roybridge (2025)
Effective short term rental pricing strategy in Roybridge involves understanding monthly ADR fluctuations. The Average Daily Rate (ADR) for Airbnb in Roybridge typically peaks in July and dips lowest during November. Leveraging Airbnb dynamic pricing tools or strategies based on this seasonality can significantly boost revenue. Here's a look at the typical nightly rates achieved:
- Best-in-class properties (Top 10%) command rates of $300+ per night, often due to premium features or locations.
- Strong performing properties (Top 25%) achieve nightly rates of $232 or more.
- Typical properties (Median) charge around $189 per night.
- Entry-level properties (Bottom 25%) earn around $116 per night.
Average Daily Rate (ADR) Trend by Month in Roybridge
Get Live Roybridge Market Intelligence 👇

Explore Real-time Analytics
Airbnb Seasonality Analysis & Trends in Roybridge (2025)
Peak Season (August, May, July)
- Revenue averages $3,078 per month
- Occupancy rates average 61.0%
- Daily rates average $220
Shoulder Season
- Revenue averages $2,229 per month
- Occupancy maintains around 39.7%
- Daily rates hold near $194
Low Season (March, April, November)
- Revenue drops to average $1,613 per month
- Occupancy decreases to average 33.0%
- Daily rates adjust to average $181
Seasonality Insights for Roybridge
- The Airbnb seasonality in Roybridge shows highly seasonal trends requiring careful strategy. While the sections above show seasonal averages, it's also insightful to look at the extremes:
- During the high season, the absolute peak month showcases Roybridge's highest earning potential, with monthly revenues capable of climbing to $3,503, occupancy reaching a high of 66.9%, and ADRs peaking at $224.
- Conversely, the slowest single month of the year, typically falling within the low season, marks the market's lowest point. In this month, revenue might dip to $1,315, occupancy could drop to 24.1%, and ADRs may adjust down to $172.
- Understanding both the seasonal averages and these monthly peaks and troughs in revenue, occupancy, and ADR is crucial for maximizing your Airbnb profit potential in Roybridge.
Seasonal Strategies for Maximizing Profit
- Peak Season: Maximize revenue through premium pricing and potentially longer minimum stays. Ensure high availability.
- Low Season: Offer competitive pricing, special promotions (e.g., extended stay discounts), and flexible cancellation policies. Target off-season travelers like remote workers or budget-conscious guests.
- Shoulder Seasons: Implement dynamic pricing that balances peak and low rates. Target weekend travelers or specific events. Offer slightly more flexible terms than peak season.
- Regularly analyze your own performance against these Roybridge seasonality benchmarks and adjust your pricing and availability strategy accordingly.
Best Areas for Airbnb Investment in Roybridge (2025)
Exploring the top neighborhoods for short-term rentals in Roybridge? This section highlights key areas, outlining why they are attractive for hosts and guests, along with notable local attractions. Consider these locations based on your target guest profile and investment strategy.
| Neighborhood / Area | Why Host Here? (Target Guests & Appeal) | Key Attractions & Landmarks |
|---|---|---|
| Fort Augustus | Picturesque village at the southern end of Loch Ness, famous for its stunning views and access to outdoor activities. A great base for tourists exploring the Highlands and Loch Ness. | Loch Ness, Caledonian Canal, Fort Augustus Abbey, Great Glen Way, Boat tours on Loch Ness |
| Inverness | The capital of the Highlands, offering a blend of city amenities and access to natural beauty. Popular for its historic sites and as a gateway to other attractions in the region. | Inverness Castle, Loch Ness Centre and Exhibition, Culloden Battlefield, River Ness, Inverness Museum and Art Gallery |
| Glenfinnan | Known for its majestic viaduct and scenic landscapes, Glenfinnan attracts fans of the Harry Potter series and nature lovers alike. A prime location for scenic views and historic sites. | Glenfinnan Viaduct, Glenfinnan Monument, Loch Shiel, Hiking trails, Jacobite Steam Train |
| Spean Bridge | A charming village near the Nevis Range, offering access to skiing and hiking. Great for outdoor enthusiasts and those seeking tranquility in the Highlands. | Nevis Range Mountain Resort, Commando Memorial, Great Glen Way, Fishing spots, Beautiful scenic walks |
| Aviemore | A bustling resort town in the Cairngorms National Park, popular for skiing in the winter and hiking in the summer. A year-round destination for outdoor activities. | Cairngorm Mountain, Aviemore Railway Station, Highland Wildlife Park, Loch Morlich, Adventure sports |
| Mallaig | A small fishing village known for its ferry connections to the Isle of Skye and beautiful coastal scenery. Ideal for tourists exploring the West Highland area. | Mallaig Harbour, Ferry to Isle of Skye, West Highland Line, Nearby beaches, Local seafood restaurants |
| Kinlochleven | A scenic village on the West Highland Way, attracting hikers and nature lovers. Offers stunning views and access to a range of outdoor activities. | West Highland Way, Blackwater Reservoir, Local waterfalls, Hiking paths, Outdoor adventure |
| Lochailort | A remote village on the coast of Loch Ailort, known for its beautiful landscapes and tranquility. Great for guests looking for a peaceful retreat in the Highlands. | Loch Ailort, Scenic coastal paths, Local wildlife, Fishing, Stunning views of the surrounding hills |
Understanding Airbnb License Requirements & STR Laws in Roybridge (2025)
With 11% of listings showing registration in 2025, understanding potential Airbnb license requirements is crucial in Roybridge. Always verify the latest short term rental regulations and Airbnb license requirements directly with local government authorities for Roybridge to ensure full compliance before hosting.
(Source: AirROI data, 2025, based on 11% licensed listings)
Top Performing Airbnb Properties in Roybridge (2025)
Benchmark your potential! Explore examples of top-performing Airbnb properties in Roybridgebased on Trailing Twelve Month (TTM) revenue. Analyze their characteristics, revenue, occupancy rate, and ADR to understand what drives success in this market.
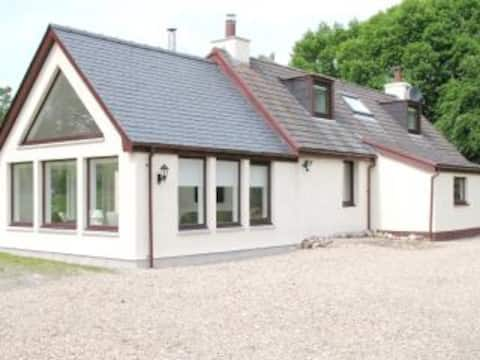
Fabulous cottage on nine acres of private land
Entire Place • 4 bedrooms

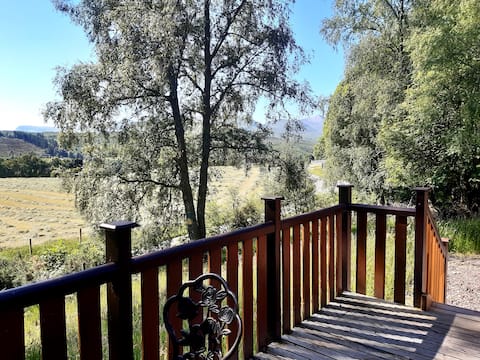
Cosy croft cottage with mountain views
Entire Place • 2 bedrooms
Cul Darach Lodge in Glen Roy Nature Reserve
Entire Place • 1 bedroom
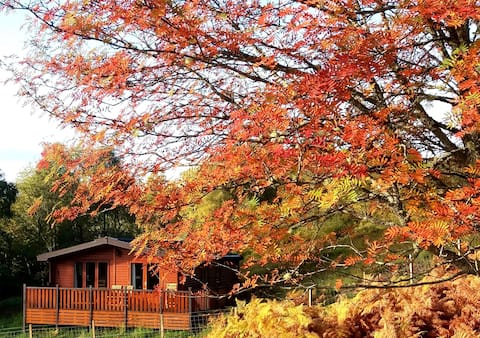
Glas Doire Lodge in Glen Roy Nature Reserve
Entire Place • 2 bedrooms
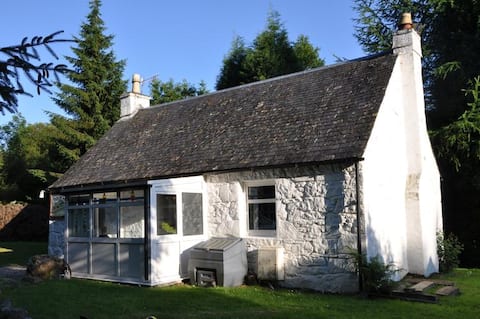
"Tigh Mo Mhiann", Roybridge, Highlands
Entire Place • 2 bedrooms
Lochy Timber Lodge in The Highlands
Entire Place • 1 bedroom
Note: Performance varies based on location, size, amenities, seasonality, and management quality. Data reflects the past 12 months.
Top Performing Airbnb Hosts in Roybridge (2025)
Learn from the best! This table showcases top-performing Airbnb hosts in Roybridge based on the number of properties managed and estimated total revenue over the past year. Analyze their scale and performance metrics.
| Host Name | Properties | Grossing Revenue | Stay Reviews | Avg Rating |
|---|---|---|---|---|
| David | 12 | $172,608 | 608 | 4.49/5.0 |
| Alin | 6 | $67,825 | 121 | 4.66/5.0 |
| Catherine | 2 | $59,613 | 97 | 4.87/5.0 |
| Ruaridh | 1 | $46,647 | 104 | 4.94/5.0 |
| Anna | 1 | $36,305 | 173 | 4.91/5.0 |
| Margo | 2 | $33,482 | 233 | 4.84/5.0 |
| Amanda | 1 | $27,167 | 23 | 4.65/5.0 |
| Karen | 1 | $19,803 | 61 | 4.95/5.0 |
| Mylene | 1 | $14,610 | 357 | 4.98/5.0 |
Analyzing the strategies of top hosts, such as their property selection, pricing, and guest communication, can offer valuable lessons for optimizing your own Airbnb operations in Roybridge.
Dive Deeper: Advanced Roybridge STR Market Data (2025)
Ready to unlock more insights? AirROI provides access to advanced metrics and comprehensive Airbnb data for Roybridge. Explore detailed analytics beyond this report to refine your investment strategy, optimize pricing, and maximize your vacation rental profits.
Explore Advanced MetricsRoybridge Short-Term Rental Market Composition (2025): Property & Room Types
Room Type Distribution
Property Type Distribution
Market Composition Insights for Roybridge
- The Roybridge Airbnb market composition is heavily skewed towards Entire Home/Apt listings, which make up 81.5% of the 27 active rentals. This indicates strong guest preference for privacy and space.
- Looking at the property type distribution in Roybridge, House properties are the most common (66.7%), reflecting the local real estate landscape.
- Houses represent a significant 66.7% portion, catering likely to families or larger groups.
- Smaller segments like hotel/boutique, others (combined 7.4%) offer potential for unique stay experiences.
Roybridge Airbnb Room Capacity Analysis (2025): Bedroom Distribution
Distribution of Listings by Number of Bedrooms
Room Capacity Insights for Roybridge
- The dominant room capacity in Roybridge is 2 bedrooms listings, making up 37% of the market. This suggests a strong demand for properties suitable for couples or solo travelers.
- Together, 2 bedrooms and 1 bedroom properties represent 70.3% of the active Airbnb listings in Roybridge, indicating a high concentration in these sizes.
- Listings with 3+ bedrooms (3.7%) represent a smaller niche, potentially indicating an underserved market for larger group accommodations in Roybridge.
Roybridge Vacation Rental Guest Capacity Trends (2025)
Distribution of Listings by Guest Capacity
Guest Capacity Insights for Roybridge
- The most common guest capacity trend in Roybridge vacation rentals is listings accommodating 2 guests (48.1%). This suggests the primary traveler segment is likely couples or solo travelers.
- Properties designed for 2 guests and 4 guests dominate the Roybridge STR market, accounting for 74.0% of listings.
- A significant 48.1% of listings cater specifically to 1-2 guests, highlighting strong demand from couples and solo travelers in Roybridge.
- On average, properties in Roybridge are equipped to host 2.9 guests.
Roybridge Airbnb Booking Patterns (2025): Available vs. Booked Days
Available Days Distribution
Booked Days Distribution
Booking Pattern Insights for Roybridge
- The most common availability pattern in Roybridge falls within the 271-366 days range, representing 48.1% of listings. This suggests many properties have significant open periods on their calendars.
- Approximately 92.5% of listings show high availability (181+ days open annually), indicating potential for increased bookings or specific owner usage patterns.
- For booked days, the 31-90 days range is most frequent in Roybridge (44.4%), reflecting common guest stay durations or potential owner blocking patterns.
- A notable 11.1% of properties secure long booking periods (181+ days booked per year), highlighting successful long-term rental strategies or significant owner usage.
Roybridge Airbnb Minimum Stay Requirements Analysis
Distribution of Listings by Minimum Night Requirement
1 Night
11 listings
40.7% of total
2 Nights
1 listings
3.7% of total
3 Nights
13 listings
48.1% of total
4-6 Nights
1 listings
3.7% of total
30+ Nights
1 listings
3.7% of total
Key Insights
- The most prevalent minimum stay requirement in Roybridge is 3 Nights, adopted by 48.1% of listings. This highlights the market's preference for longer commitments.
Recommendations
- Align with the market by considering a 3 Nights minimum stay, as 48.1% of Roybridge hosts use this setting.
- Adjust minimum nights based on seasonality – potentially shorter during low season and longer during peak demand periods in Roybridge.
Roybridge Airbnb Cancellation Policy Trends Analysis (2025)
Flexible
2 listings
7.4% of total
Moderate
9 listings
33.3% of total
Strict
16 listings
59.3% of total
Cancellation Policy Insights for Roybridge
- The prevailing Airbnb cancellation policy trend in Roybridge is Strict, used by 59.3% of listings.
- A majority (59.3%) of hosts in Roybridge utilize Firm or Strict policies, indicating a market where hosts prioritize booking security.
Recommendations for Hosts
- Consider adopting a Strict policy to align with the 59.3% market standard in Roybridge.
- With 59.3% using Strict terms, this is a viable option in Roybridge, particularly for high-value properties or during peak demand periods.
- Regularly review your cancellation policy against competitors and market demand shifts in Roybridge.
Roybridge STR Booking Lead Time Analysis (2025)
Average Booking Lead Time by Month
Booking Lead Time Insights for Roybridge
- The overall average booking lead time for vacation rentals in Roybridge is 94 days.
- Guests book furthest in advance for stays during October (average 195 days), likely coinciding with peak travel demand or local events.
- The shortest booking windows occur for stays in January (average 36 days), indicating more last-minute travel plans during this time.
- Seasonally, Fall (111 days avg.) sees the longest lead times, while Winter (43 days avg.) has the shortest, reflecting typical travel planning cycles.
Recommendations for Hosts
- Use the overall average lead time (94 days) as a baseline for your pricing and availability strategy in Roybridge.
- For October stays, consider implementing length-of-stay discounts or slightly higher rates for bookings made less than 195 days out to capitalize on advance planning.
- Target marketing efforts for the Fall season well in advance (at least 111 days) to capture early planners.
- Monitor your own booking lead times against these Roybridge averages to identify opportunities for dynamic pricing adjustments.
Popular & Essential Airbnb Amenities in Roybridge (2025)
Amenity Prevalence
Amenity Insights for Roybridge
- Essential amenities in Roybridge that guests expect include: Wifi, Heating, Free parking on premises. Lacking these (any) could significantly impact bookings.
- Popular amenities like Hair dryer, Fire extinguisher, Essentials are common but not universal. Offering these can provide a competitive edge.
Recommendations for Hosts
- Ensure your listing includes all essential amenities for Roybridge: Wifi, Heating, Free parking on premises.
- Prioritize adding missing essentials: Free parking on premises.
- Consider adding popular differentiators like Hair dryer or Fire extinguisher to increase appeal.
- Highlight unique or less common amenities you offer (e.g., hot tub, dedicated workspace, EV charger) in your listing description and photos.
- Regularly check competitor amenities in Roybridge to stay competitive.
Roybridge Airbnb Guest Demographics & Profile Analysis (2025)
Guest Profile Summary for Roybridge
- The typical guest profile for Airbnb in Roybridge consists of a mix of domestic (46%) and international guests, with top international origins including Germany, typically belonging to the Post-2000s (Gen Z/Alpha) group (50%), primarily speaking English or French.
- Domestic travelers account for 45.7% of guests.
- Key international markets include United Kingdom (45.7%) and Germany (10.5%).
- Top languages spoken are English (50.2%) followed by French (15.5%).
- A significant demographic segment is the Post-2000s (Gen Z/Alpha) group, representing 50% of guests.
Recommendations for Hosts
- Balance marketing efforts between domestic and international channels based on the guest mix.
- Tailor amenities and listing descriptions to appeal to the dominant Post-2000s (Gen Z/Alpha) demographic (e.g., highlight fast WiFi, smart home features, local guides).
- Highlight unique local experiences or amenities relevant to the primary guest profile.
- Consider seasonal promotions aligned with peak travel times for key origin markets.
Nearby Short-Term Rental Market Comparison
How does the Roybridge Airbnb market stack up against its neighbors? Compare key performance metrics like average monthly revenue, ADR, and occupancy rates in surrounding areas to understand the broader regional STR landscape.
| Market | Active Properties | Monthly Revenue | Daily Rate | Avg. Occupancy |
|---|---|---|---|---|
| Galston | 11 | $7,951 | $676.77 | 46% |
| Fearnan | 19 | $6,440 | $421.92 | 53% |
| Gorebridge | 12 | $6,209 | $493.62 | 54% |
| Bridge of Cally | 16 | $5,839 | $566.24 | 50% |
| Kirkhill | 10 | $5,719 | $700.26 | 44% |
| Glenachulish | 33 | $5,609 | $424.51 | 46% |
| North Kessock | 10 | $5,421 | $380.62 | 58% |
| Foyers | 14 | $5,076 | $274.52 | 64% |
| Arrochar | 33 | $5,045 | $339.11 | 56% |
| Whitebridge | 10 | $4,907 | $417.35 | 42% |