Roag Airbnb Market Analysis 2025: Short Term Rental Data & Vacation Rental Statistics in Scotland, United Kingdom
Is Airbnb profitable in Roag in 2025? Explore comprehensive Airbnb analytics for Roag, Scotland, United Kingdom to uncover income potential. This 2025 STR market report for Roag, based on AirROI data from April 2024 to March 2025, reveals key trends in the niche market of 38 active listings.
Whether you're considering an Airbnb investment in Roag, optimizing your existing vacation rental, or exploring rental arbitrage opportunities, understanding the Roag Airbnb data is crucial. Navigating the high regulation landscape is key to maximizing your short term rental income potential. Let's dive into the specifics.
Key Roag Airbnb Performance Metrics Overview
Monthly Airbnb Revenue Variations & Income Potential in Roag (2025)
Understanding the monthly revenue variations for Airbnb listings in Roag is key to maximizing your short term rental income potential. Seasonality significantly impacts earnings. Our analysis, based on data from the past 12 months, shows that the peak revenue month for STRs in Roag is typically August, while January often presents the lowest earnings, highlighting opportunities for strategic pricing adjustments during shoulder and low seasons. Explore the typical Airbnb income in Roag across different performance tiers:
- Best-in-class properties (Top 10%) achieve $6,295+ monthly, often utilizing dynamic pricing and superior guest experiences.
- Strong performing properties (Top 25%) earn $4,221 or more, indicating effective management and desirable locations/amenities.
- Typical properties (Median) generate around $3,026 per month, representing the average market performance.
- Entry-level properties (Bottom 25%) see earnings around $2,118, often with potential for optimization.
Average Monthly Airbnb Earnings Trend in Roag
Roag Airbnb Occupancy Rate Trends (2025)
Maximize your bookings by understanding the Roag STR occupancy trends. Seasonal demand shifts significantly influence how often properties are booked. Typically, Septembersees the highest demand (peak season occupancy), while January experiences the lowest (low season). Effective strategies, like adjusting minimum stays or offering promotions, can boost occupancy during slower periods. Here's how different property tiers perform in Roag:
- Best-in-class properties (Top 10%) achieve 82%+ occupancy, indicating high desirability and potentially optimized availability.
- Strong performing properties (Top 25%) maintain 72% or higher occupancy, suggesting good market fit and guest satisfaction.
- Typical properties (Median) have an occupancy rate around 58%.
- Entry-level properties (Bottom 25%) average 41% occupancy, potentially facing higher vacancy.
Average Monthly Occupancy Rate Trend in Roag
Average Daily Rate (ADR) Airbnb Trends in Roag (2025)
Effective short term rental pricing strategy in Roag involves understanding monthly ADR fluctuations. The Average Daily Rate (ADR) for Airbnb in Roag typically peaks in July and dips lowest during February. Leveraging Airbnb dynamic pricing tools or strategies based on this seasonality can significantly boost revenue. Here's a look at the typical nightly rates achieved:
- Best-in-class properties (Top 10%) command rates of $351+ per night, often due to premium features or locations.
- Strong performing properties (Top 25%) achieve nightly rates of $223 or more.
- Typical properties (Median) charge around $175 per night.
- Entry-level properties (Bottom 25%) earn around $145 per night.
Average Daily Rate (ADR) Trend by Month in Roag
Get Live Roag Market Intelligence 👇

Explore Real-time Analytics
Airbnb Seasonality Analysis & Trends in Roag (2025)
Peak Season (August, June, May)
- Revenue averages $5,755 per month
- Occupancy rates average 73.6%
- Daily rates average $230
Shoulder Season
- Revenue averages $3,795 per month
- Occupancy maintains around 59.3%
- Daily rates hold near $212
Low Season (January, February, March)
- Revenue drops to average $1,241 per month
- Occupancy decreases to average 26.3%
- Daily rates adjust to average $187
Seasonality Insights for Roag
- The Airbnb seasonality in Roag shows highly seasonal trends requiring careful strategy. While the sections above show seasonal averages, it's also insightful to look at the extremes:
- During the high season, the absolute peak month showcases Roag's highest earning potential, with monthly revenues capable of climbing to $5,936, occupancy reaching a high of 78.5%, and ADRs peaking at $235.
- Conversely, the slowest single month of the year, typically falling within the low season, marks the market's lowest point. In this month, revenue might dip to $691, occupancy could drop to 14.1%, and ADRs may adjust down to $183.
- Understanding both the seasonal averages and these monthly peaks and troughs in revenue, occupancy, and ADR is crucial for maximizing your Airbnb profit potential in Roag.
Seasonal Strategies for Maximizing Profit
- Peak Season: Maximize revenue through premium pricing and potentially longer minimum stays. Ensure high availability.
- Low Season: Offer competitive pricing, special promotions (e.g., extended stay discounts), and flexible cancellation policies. Target off-season travelers like remote workers or budget-conscious guests.
- Shoulder Seasons: Implement dynamic pricing that balances peak and low rates. Target weekend travelers or specific events. Offer slightly more flexible terms than peak season.
- Regularly analyze your own performance against these Roag seasonality benchmarks and adjust your pricing and availability strategy accordingly.
Best Areas for Airbnb Investment in Roag (2025)
Exploring the top neighborhoods for short-term rentals in Roag? This section highlights key areas, outlining why they are attractive for hosts and guests, along with notable local attractions. Consider these locations based on your target guest profile and investment strategy.
| Neighborhood / Area | Why Host Here? (Target Guests & Appeal) | Key Attractions & Landmarks |
|---|---|---|
| Stirling | A historic city with a rich heritage, Stirling is known for its castle and battlefield history. It's a great location for those interested in Scottish history and culture, attracting many tourists year-round. | Stirling Castle, The Wallace Monument, Battle of Bannockburn, The Stirling Smith Art Gallery and Museum, Old Town Jail |
| Edinburgh | The capital city of Scotland, known for its festivals, historic sites, and vibrant culture. Edinburgh attracts millions of visitors annually, making it a prime spot for short-term rentals. | Edinburgh Castle, Royal Mile, Arthur's Seat, Holyrood Palace, Scotch Whisky Experience |
| Glasgow | Scotland's largest city, Glasgow is known for its cultural scene, shopping, and nightlife. It offers great opportunities for hosting Airbnb due to its diverse attractions and events. | Kelvingrove Art Gallery and Museum, Glasgow Science Centre, Buchanan Street shopping, Riverside Museum, The Glasgow Royal Concert Hall |
| Perth | The 'Gateway to the Highlands', Perth is a picturesque city that serves as a hub for exploring the surrounding natural beauty and attractions, ideal for nature lovers. | Scone Palace, Perth Museum and Art Gallery, The Black Watch Castle and Museum, Giuseppe Garibaldi's Statue, The River Tay |
| Inverness | Known as the capital of the Highlands, Inverness is popular with visitors exploring the lochs and castles of the area, famous for Loch Ness tourism. | Loch Ness, Inverness Castle, Culloden Battlefield, Clava Cairns, Inverness Museum and Art Gallery |
| Oban | A charming seaside town known as the 'Gateway to the Isles', Oban is ideal for tourists wanting to explore the west coast of Scotland and the surrounding islands. | Oban Distillery, McCaig's Tower, Ganavan Sands, Dunollie Castle, The Scottish Sea Life Sanctuary |
| St Andrews | Famous for its university and as the home of golf, St Andrews attracts tourists and golfers alike, making it a great spot for Airbnb hosting. | St Andrews Castle, St Andrews Links, University of St Andrews, West Sands Beach, St Andrews Cathedral |
| Falkirk | Rich in history and cultural attractions, Falkirk is also close to the national parks and serves as a good base for exploring central Scotland. | The Kelpies, Falkirk Wheel, Callendar House, Falkirk Golf Club, The Antonine Wall |
Understanding Airbnb License Requirements & STR Laws in Roag (2025)
Yes, Roag, Scotland, United Kingdom enforces high STR regulations. Obtaining a license and ensuring compliance is almost certainly required according to current 2025 STR laws. Always verify the latest short term rental regulations and Airbnb license requirements directly with local government authorities for Roag to ensure full compliance before hosting.
(Source: AirROI data, 2025, based on 34% licensed listings)
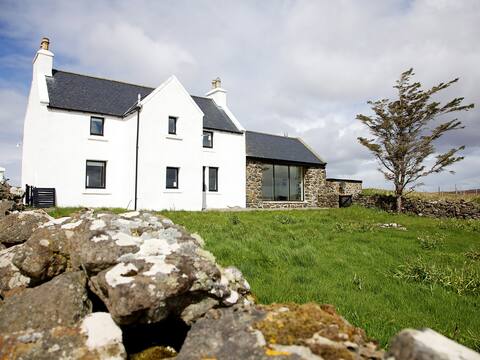
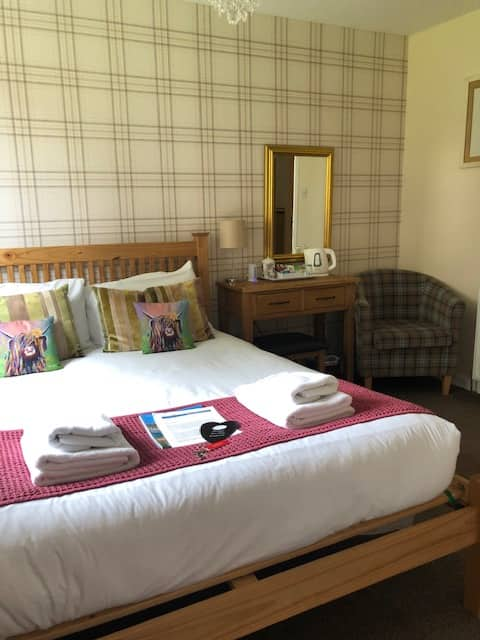
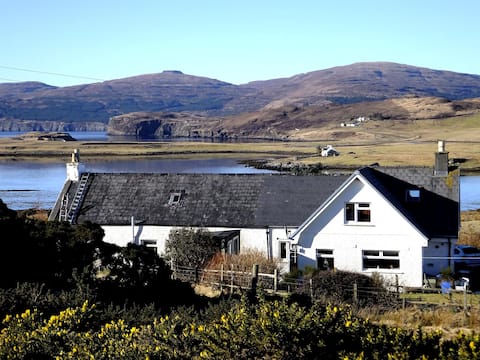
Top Performing Airbnb Properties in Roag (2025)
Benchmark your potential! Explore examples of top-performing Airbnb properties in Roagbased on Trailing Twelve Month (TTM) revenue. Analyze their characteristics, revenue, occupancy rate, and ADR to understand what drives success in this market.
7 Greep
Entire Place • 3 bedrooms
B&B with 3 en-suite rooms with breakfast
Private Room • 3 bedrooms

Cosy home with stunning views
Entire Place • 3 bedrooms

Luxury Cottage with Sauna, Hot Tub and Sea Views
Entire Place • 2 bedrooms

Little House The Sea Self Catering
Entire Place • 1 bedroom
Loch Bracadale Cottage
Entire Place • 2 bedrooms
Note: Performance varies based on location, size, amenities, seasonality, and management quality. Data reflects the past 12 months.
Top Performing Airbnb Hosts in Roag (2025)
Learn from the best! This table showcases top-performing Airbnb hosts in Roag based on the number of properties managed and estimated total revenue over the past year. Analyze their scale and performance metrics.
| Host Name | Properties | Grossing Revenue | Stay Reviews | Avg Rating |
|---|---|---|---|---|
| Rebecca | 4 | $181,546 | 526 | 4.97/5.0 |
| Cottages | 1 | $142,227 | 14 | 5.00/5.0 |
| Keith, Kati, Ashton & Luca | 5 | $122,742 | 308 | 4.95/5.0 |
| Alistair | 2 | $103,551 | 501 | 4.92/5.0 |
| Flora | 1 | $88,418 | 133 | 4.78/5.0 |
| Skye Eco Bells | 4 | $85,064 | 934 | 4.85/5.0 |
| Chris And Caroline | 2 | $60,337 | 294 | 4.95/5.0 |
| Vivienne | 1 | $56,335 | 10 | 5.00/5.0 |
| Margaret | 1 | $56,270 | 41 | 5.00/5.0 |
| Rosie | 1 | $53,093 | 297 | 5.00/5.0 |
Analyzing the strategies of top hosts, such as their property selection, pricing, and guest communication, can offer valuable lessons for optimizing your own Airbnb operations in Roag.
Dive Deeper: Advanced Roag STR Market Data (2025)
Ready to unlock more insights? AirROI provides access to advanced metrics and comprehensive Airbnb data for Roag. Explore detailed analytics beyond this report to refine your investment strategy, optimize pricing, and maximize your vacation rental profits.
Explore Advanced MetricsRoag Short-Term Rental Market Composition (2025): Property & Room Types
Room Type Distribution
Property Type Distribution
Market Composition Insights for Roag
- The Roag Airbnb market composition is heavily skewed towards Entire Home/Apt listings, which make up 76.3% of the 38 active rentals. This indicates strong guest preference for privacy and space.
- Looking at the property type distribution in Roag, House properties are the most common (71.1%), reflecting the local real estate landscape.
- Houses represent a significant 71.1% portion, catering likely to families or larger groups.
- The presence of 10.5% Hotel/Boutique listings indicates integration with traditional hospitality.
Roag Airbnb Room Capacity Analysis (2025): Bedroom Distribution
Distribution of Listings by Number of Bedrooms
Room Capacity Insights for Roag
- The dominant room capacity in Roag is 1 bedroom listings, making up 42.1% of the market. This suggests a strong demand for properties suitable for couples or solo travelers.
- Together, 1 bedroom and 2 bedrooms properties represent 71.0% of the active Airbnb listings in Roag, indicating a high concentration in these sizes.
Roag Vacation Rental Guest Capacity Trends (2025)
Distribution of Listings by Guest Capacity
Guest Capacity Insights for Roag
- The most common guest capacity trend in Roag vacation rentals is listings accommodating 2 guests (42.1%). This suggests the primary traveler segment is likely couples or solo travelers.
- Properties designed for 2 guests and 4 guests dominate the Roag STR market, accounting for 76.3% of listings.
- A significant 42.1% of listings cater specifically to 1-2 guests, highlighting strong demand from couples and solo travelers in Roag.
- On average, properties in Roag are equipped to host 2.7 guests.
Roag Airbnb Booking Patterns (2025): Available vs. Booked Days
Available Days Distribution
Booked Days Distribution
Booking Pattern Insights for Roag
- The most common availability pattern in Roag falls within the 91-180 days range, representing 39.5% of listings. This suggests many properties have significant open periods on their calendars.
- Approximately 57.9% of listings show high availability (181+ days open annually), indicating potential for increased bookings or specific owner usage patterns.
- For booked days, the 181-270 days range is most frequent in Roag (42.1%), reflecting common guest stay durations or potential owner blocking patterns.
- A notable 44.7% of properties secure long booking periods (181+ days booked per year), highlighting successful long-term rental strategies or significant owner usage.
Roag Airbnb Minimum Stay Requirements Analysis
Distribution of Listings by Minimum Night Requirement
1 Night
6 listings
16.7% of total
2 Nights
9 listings
25% of total
3 Nights
5 listings
13.9% of total
4-6 Nights
3 listings
8.3% of total
7-29 Nights
2 listings
5.6% of total
30+ Nights
11 listings
30.6% of total
Key Insights
- The most prevalent minimum stay requirement in Roag is 30+ Nights, adopted by 30.6% of listings. This highlights the market's preference for longer commitments.
- A significant segment (30.6%) caters to monthly stays (30+ nights) in Roag, pointing to opportunities in the extended-stay market.
Recommendations
- Align with the market by considering a 30+ Nights minimum stay, as 30.6% of Roag hosts use this setting.
- If feasible, allowing 1-night stays, especially midweek or during low season, could capture last-minute bookings, as only 16.7% currently do.
- Explore offering discounts for stays of 30+ nights to attract the 30.6% of the market seeking extended stays.
- Adjust minimum nights based on seasonality – potentially shorter during low season and longer during peak demand periods in Roag.
Roag Airbnb Cancellation Policy Trends Analysis (2025)
Super Strict 30 Days
1 listings
2.8% of total
Super Strict 60 Days
4 listings
11.1% of total
Flexible
3 listings
8.3% of total
Moderate
14 listings
38.9% of total
Firm
5 listings
13.9% of total
Strict
9 listings
25% of total
Cancellation Policy Insights for Roag
- The prevailing Airbnb cancellation policy trend in Roag is Moderate, used by 38.9% of listings.
- There's a relatively balanced mix between guest-friendly (47.2%) and stricter (38.9%) policies, offering choices for different guest needs.
Recommendations for Hosts
- Consider adopting a Moderate policy to align with the 38.9% market standard in Roag.
- Regularly review your cancellation policy against competitors and market demand shifts in Roag.
Roag STR Booking Lead Time Analysis (2025)
Average Booking Lead Time by Month
Booking Lead Time Insights for Roag
- The overall average booking lead time for vacation rentals in Roag is 84 days.
- Guests book furthest in advance for stays during May (average 119 days), likely coinciding with peak travel demand or local events.
- The shortest booking windows occur for stays in January (average 27 days), indicating more last-minute travel plans during this time.
- Seasonally, Summer (109 days avg.) sees the longest lead times, while Winter (45 days avg.) has the shortest, reflecting typical travel planning cycles.
Recommendations for Hosts
- Use the overall average lead time (84 days) as a baseline for your pricing and availability strategy in Roag.
- For May stays, consider implementing length-of-stay discounts or slightly higher rates for bookings made less than 119 days out to capitalize on advance planning.
- Target marketing efforts for the Summer season well in advance (at least 109 days) to capture early planners.
- Monitor your own booking lead times against these Roag averages to identify opportunities for dynamic pricing adjustments.
Popular & Essential Airbnb Amenities in Roag (2025)
Amenity Prevalence
Amenity Insights for Roag
- Essential amenities in Roag that guests expect include: Smoke alarm, Free parking on premises, Essentials. Lacking these (any) could significantly impact bookings.
- Popular amenities like Heating, Hot water, Fire extinguisher are common but not universal. Offering these can provide a competitive edge.
Recommendations for Hosts
- Ensure your listing includes all essential amenities for Roag: Smoke alarm, Free parking on premises, Essentials.
- Prioritize adding missing essentials: Essentials.
- Consider adding popular differentiators like Heating or Hot water to increase appeal.
- Highlight unique or less common amenities you offer (e.g., hot tub, dedicated workspace, EV charger) in your listing description and photos.
- Regularly check competitor amenities in Roag to stay competitive.
Roag Airbnb Guest Demographics & Profile Analysis (2025)
Guest Profile Summary for Roag
- The typical guest profile for Airbnb in Roag consists of predominantly international visitors (74%), with top international origins including United States, typically belonging to the Post-2000s (Gen Z/Alpha) group (50%), primarily speaking English or French.
- Domestic travelers account for 26.5% of guests.
- Key international markets include United Kingdom (26.5%) and United States (25.2%).
- Top languages spoken are English (51.9%) followed by French (12.9%).
- A significant demographic segment is the Post-2000s (Gen Z/Alpha) group, representing 50% of guests.
Recommendations for Hosts
- Focus marketing internationally, particularly towards travelers from United States.
- Tailor amenities and listing descriptions to appeal to the dominant Post-2000s (Gen Z/Alpha) demographic (e.g., highlight fast WiFi, smart home features, local guides).
- Highlight unique local experiences or amenities relevant to the primary guest profile.
- Consider seasonal promotions aligned with peak travel times for key origin markets.
Nearby Short-Term Rental Market Comparison
How does the Roag Airbnb market stack up against its neighbors? Compare key performance metrics like average monthly revenue, ADR, and occupancy rates in surrounding areas to understand the broader regional STR landscape.
| Market | Active Properties | Monthly Revenue | Daily Rate | Avg. Occupancy |
|---|---|---|---|---|
| Glenachulish | 33 | $5,609 | $424.51 | 46% |
| Carbost | 26 | $5,209 | $324.31 | 62% |
| Port Failthe | 14 | $4,832 | $301.12 | 57% |
| Camuscross | 11 | $4,649 | $300.59 | 61% |
| Culnacnoc | 16 | $4,576 | $299.16 | 60% |
| Corran | 24 | $4,576 | $370.68 | 45% |
| Portree | 190 | $4,227 | $258.97 | 60% |
| Benderloch | 14 | $4,218 | $364.53 | 55% |
| Stein | 14 | $4,160 | $249.21 | 72% |
| North Ballachulish | 34 | $4,144 | $288.28 | 47% |