Plockton Airbnb Market Analysis 2025: Short Term Rental Data & Vacation Rental Statistics in Scotland, United Kingdom
Is Airbnb profitable in Plockton in 2025? Explore comprehensive Airbnb analytics for Plockton, Scotland, United Kingdom to uncover income potential. This 2025 STR market report for Plockton, based on AirROI data from April 2024 to March 2025, reveals key trends in the niche market of 39 active listings.
Whether you're considering an Airbnb investment in Plockton, optimizing your existing vacation rental, or exploring rental arbitrage opportunities, understanding the Plockton Airbnb data is crucial. Leveraging the low regulation environment is key to maximizing your short term rental income potential. Let's dive into the specifics.
Key Plockton Airbnb Performance Metrics Overview
Monthly Airbnb Revenue Variations & Income Potential in Plockton (2025)
Understanding the monthly revenue variations for Airbnb listings in Plockton is key to maximizing your short term rental income potential. Seasonality significantly impacts earnings. Our analysis, based on data from the past 12 months, shows that the peak revenue month for STRs in Plockton is typically August, while March often presents the lowest earnings, highlighting opportunities for strategic pricing adjustments during shoulder and low seasons. Explore the typical Airbnb income in Plockton across different performance tiers:
- Best-in-class properties (Top 10%) achieve $4,944+ monthly, often utilizing dynamic pricing and superior guest experiences.
- Strong performing properties (Top 25%) earn $3,769 or more, indicating effective management and desirable locations/amenities.
- Typical properties (Median) generate around $2,548 per month, representing the average market performance.
- Entry-level properties (Bottom 25%) see earnings around $1,461, often with potential for optimization.
Average Monthly Airbnb Earnings Trend in Plockton
Plockton Airbnb Occupancy Rate Trends (2025)
Maximize your bookings by understanding the Plockton STR occupancy trends. Seasonal demand shifts significantly influence how often properties are booked. Typically, Augustsees the highest demand (peak season occupancy), while March experiences the lowest (low season). Effective strategies, like adjusting minimum stays or offering promotions, can boost occupancy during slower periods. Here's how different property tiers perform in Plockton:
- Best-in-class properties (Top 10%) achieve 86%+ occupancy, indicating high desirability and potentially optimized availability.
- Strong performing properties (Top 25%) maintain 77% or higher occupancy, suggesting good market fit and guest satisfaction.
- Typical properties (Median) have an occupancy rate around 59%.
- Entry-level properties (Bottom 25%) average 37% occupancy, potentially facing higher vacancy.
Average Monthly Occupancy Rate Trend in Plockton
Average Daily Rate (ADR) Airbnb Trends in Plockton (2025)
Effective short term rental pricing strategy in Plockton involves understanding monthly ADR fluctuations. The Average Daily Rate (ADR) for Airbnb in Plockton typically peaks in August and dips lowest during November. Leveraging Airbnb dynamic pricing tools or strategies based on this seasonality can significantly boost revenue. Here's a look at the typical nightly rates achieved:
- Best-in-class properties (Top 10%) command rates of $272+ per night, often due to premium features or locations.
- Strong performing properties (Top 25%) achieve nightly rates of $197 or more.
- Typical properties (Median) charge around $153 per night.
- Entry-level properties (Bottom 25%) earn around $105 per night.
Average Daily Rate (ADR) Trend by Month in Plockton
Get Live Plockton Market Intelligence 👇

Explore Real-time Analytics
Airbnb Seasonality Analysis & Trends in Plockton (2025)
Peak Season (August, July, September)
- Revenue averages $4,404 per month
- Occupancy rates average 76.0%
- Daily rates average $197
Shoulder Season
- Revenue averages $2,973 per month
- Occupancy maintains around 56.4%
- Daily rates hold near $184
Low Season (January, February, March)
- Revenue drops to average $1,495 per month
- Occupancy decreases to average 32.3%
- Daily rates adjust to average $165
Seasonality Insights for Plockton
- The Airbnb seasonality in Plockton shows highly seasonal trends requiring careful strategy. While the sections above show seasonal averages, it's also insightful to look at the extremes:
- During the high season, the absolute peak month showcases Plockton's highest earning potential, with monthly revenues capable of climbing to $4,680, occupancy reaching a high of 79.1%, and ADRs peaking at $204.
- Conversely, the slowest single month of the year, typically falling within the low season, marks the market's lowest point. In this month, revenue might dip to $1,381, occupancy could drop to 27.9%, and ADRs may adjust down to $163.
- Understanding both the seasonal averages and these monthly peaks and troughs in revenue, occupancy, and ADR is crucial for maximizing your Airbnb profit potential in Plockton.
Seasonal Strategies for Maximizing Profit
- Peak Season: Maximize revenue through premium pricing and potentially longer minimum stays. Ensure high availability.
- Low Season: Offer competitive pricing, special promotions (e.g., extended stay discounts), and flexible cancellation policies. Target off-season travelers like remote workers or budget-conscious guests.
- Shoulder Seasons: Implement dynamic pricing that balances peak and low rates. Target weekend travelers or specific events. Offer slightly more flexible terms than peak season.
- Regularly analyze your own performance against these Plockton seasonality benchmarks and adjust your pricing and availability strategy accordingly.
Best Areas for Airbnb Investment in Plockton (2025)
Exploring the top neighborhoods for short-term rentals in Plockton? This section highlights key areas, outlining why they are attractive for hosts and guests, along with notable local attractions. Consider these locations based on your target guest profile and investment strategy.
| Neighborhood / Area | Why Host Here? (Target Guests & Appeal) | Key Attractions & Landmarks |
|---|---|---|
| Plockton Village | Charming coastal village known for its picturesque scenery and boat trips to the nearby islands. A great base for tourists looking to explore the Scottish Highlands and enjoy local seafood dining. | Plockton Harbour, Plockton Inn, Boat trips to the Isle of Skye, Local seafood restaurants, Kintail and Morvich, Bealach na Ba |
| Duncraig Castle | Historic castle with beautiful grounds, perfect for guests looking for a unique and enchanting stay. The castle is popular for weddings and special events, attracting visitors year-round. | Duncraig Castle grounds, Plockton's famous palm trees, Scenic walking paths, Castle-inspired accommodations |
| Loch Carron | A beautiful loch surrounded by stunning landscapes, ideal for those looking for tranquility and nature. Attracts hikers and outdoor enthusiasts with various walking trails and water-based activities. | Loch Carron viewpoint, Walking routes, Wildlife spotting, Kayaking and fishing opportunities |
| Isle of Skye Access Point | Plockton serves as a gateway to the Isle of Skye, making it an ideal location for Airbnb hosts catering to visitors planning to explore the iconic island's attractions. | Fairy Pools, Old Man of Storr, Dunvegan Castle, Neist Point, Portree |
| Plockton Golf Club | For golf enthusiasts, Plockton Golf Club offers stunning views and a unique golfing experience. It attracts both golfers and tourists looking for leisure activities in a beautiful setting. | Plockton Golf Club, Golf courses with sea views, Local wildlife, Tranquil environment |
| Plockton's Beaches | The nearby beaches are perfect for families and beach lovers, providing opportunities for relaxation and water sports. Visitors enjoy sunbathing, swimming, and beachcombing during the warmer months. | Plockton Beach, Swimming spots, Water sports, Picnic areas, Seaside walks |
| Local Art Galleries | Plockton is home to several local art galleries showcasing Scottish artists. It's a cultural hub for visitors interested in art and creativity, attracting art enthusiasts and collectors. | Plockton Art Gallery, Arts and crafts events, Local artist exhibitions |
| Food and Drink Experiences | Plockton boasts several excellent restaurants and cafes offering local cuisine, which appeals to foodies and those wanting to experience authentic Scottish tastes during their stay. | Local seafood restaurants, Cafes with local produce, Traditional Scottish fare |
Understanding Airbnb License Requirements & STR Laws in Plockton (2025)
While Plockton, Scotland, United Kingdom currently shows low STR regulations, specific Airbnb license requirements might still exist or change. Always verify the latest short term rental regulations and Airbnb license requirements directly with local government authorities for Plockton to ensure full compliance before hosting.
(Source: AirROI data, 2025, based on 8% licensed listings)
Top Performing Airbnb Properties in Plockton (2025)
Benchmark your potential! Explore examples of top-performing Airbnb properties in Plocktonbased on Trailing Twelve Month (TTM) revenue. Analyze their characteristics, revenue, occupancy rate, and ADR to understand what drives success in this market.
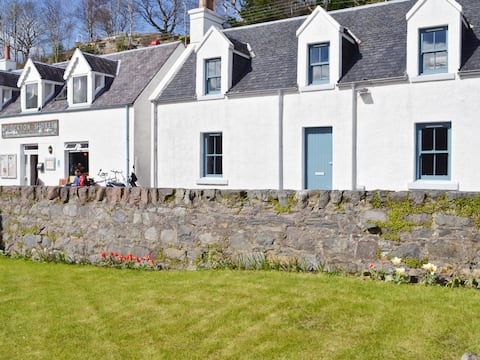
Bayview Cottage
Entire Place • 4 bedrooms
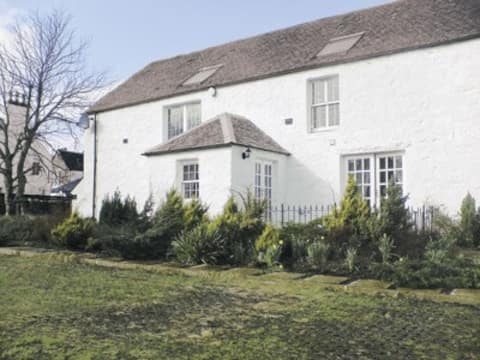
Hirta
Entire Place • 1 bedroom
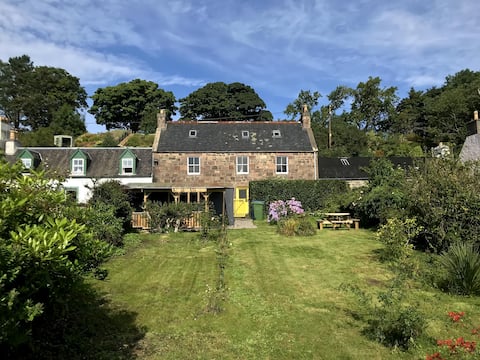
Peaceful Private House & Garden. Gorgeous Sea View
Entire Place • 2 bedrooms

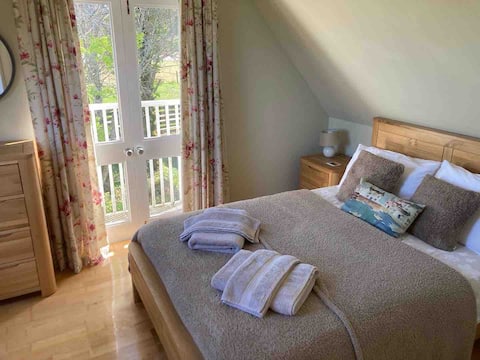
Cladaich Lodge, Plockton, Near Isle of Skye
Entire Place • 1 bedroom
Plockton, Camus Fearn Barn
Entire Place • 1 bedroom

Captain's Croft
Entire Place • 1 bedroom
Note: Performance varies based on location, size, amenities, seasonality, and management quality. Data reflects the past 12 months.
Top Performing Airbnb Hosts in Plockton (2025)
Learn from the best! This table showcases top-performing Airbnb hosts in Plockton based on the number of properties managed and estimated total revenue over the past year. Analyze their scale and performance metrics.
| Host Name | Properties | Grossing Revenue | Stay Reviews | Avg Rating |
|---|---|---|---|---|
| Patti | 11 | $190,535 | 3159 | 4.67/5.0 |
| Cottages | 2 | $183,063 | 25 | 4.76/5.0 |
| Alec | 5 | $132,152 | 54 | 4.88/5.0 |
| Donald | 4 | $91,385 | 177 | 4.79/5.0 |
| Angie | 1 | $53,782 | 59 | 4.95/5.0 |
| Bob | 3 | $51,675 | 390 | 4.85/5.0 |
| Ian | 1 | $51,173 | 164 | 4.99/5.0 |
| Aileen | 1 | $43,126 | 92 | 4.96/5.0 |
| Julia | 1 | $42,673 | 310 | 4.83/5.0 |
| Guillaume | 1 | $41,490 | 42 | 5.00/5.0 |
Analyzing the strategies of top hosts, such as their property selection, pricing, and guest communication, can offer valuable lessons for optimizing your own Airbnb operations in Plockton.
Dive Deeper: Advanced Plockton STR Market Data (2025)
Ready to unlock more insights? AirROI provides access to advanced metrics and comprehensive Airbnb data for Plockton. Explore detailed analytics beyond this report to refine your investment strategy, optimize pricing, and maximize your vacation rental profits.
Explore Advanced MetricsPlockton Short-Term Rental Market Composition (2025): Property & Room Types
Room Type Distribution
Property Type Distribution
Market Composition Insights for Plockton
- The Plockton Airbnb market composition is heavily skewed towards Entire Home/Apt listings, which make up 87.2% of the 39 active rentals. This indicates strong guest preference for privacy and space.
- Looking at the property type distribution in Plockton, House properties are the most common (56.4%), reflecting the local real estate landscape.
- Houses represent a significant 56.4% portion, catering likely to families or larger groups.
- Smaller segments like unique stays, hotel/boutique (combined 5.2%) offer potential for unique stay experiences.
Plockton Airbnb Room Capacity Analysis (2025): Bedroom Distribution
Distribution of Listings by Number of Bedrooms
Room Capacity Insights for Plockton
- The dominant room capacity in Plockton is 1 bedroom listings, making up 35.9% of the market. This suggests a strong demand for properties suitable for couples or solo travelers.
- Together, 1 bedroom and 2 bedrooms properties represent 69.2% of the active Airbnb listings in Plockton, indicating a high concentration in these sizes.
Plockton Vacation Rental Guest Capacity Trends (2025)
Distribution of Listings by Guest Capacity
Guest Capacity Insights for Plockton
- The most common guest capacity trend in Plockton vacation rentals is listings accommodating 2 guests (38.5%). This suggests the primary traveler segment is likely couples or solo travelers.
- Properties designed for 2 guests and 4 guests dominate the Plockton STR market, accounting for 66.7% of listings.
- 12.9% of properties accommodate 6+ guests, serving the market segment for larger families or group travel in Plockton.
- On average, properties in Plockton are equipped to host 2.9 guests.
Plockton Airbnb Booking Patterns (2025): Available vs. Booked Days
Available Days Distribution
Booked Days Distribution
Booking Pattern Insights for Plockton
- The most common availability pattern in Plockton falls within the 181-270 days range, representing 56.4% of listings. This suggests many properties have significant open periods on their calendars.
- Approximately 61.5% of listings show high availability (181+ days open annually), indicating potential for increased bookings or specific owner usage patterns.
- For booked days, the 91-180 days range is most frequent in Plockton (51.3%), reflecting common guest stay durations or potential owner blocking patterns.
- A notable 43.6% of properties secure long booking periods (181+ days booked per year), highlighting successful long-term rental strategies or significant owner usage.
Plockton Airbnb Minimum Stay Requirements Analysis
Distribution of Listings by Minimum Night Requirement
1 Night
12 listings
30.8% of total
2 Nights
5 listings
12.8% of total
3 Nights
14 listings
35.9% of total
4-6 Nights
2 listings
5.1% of total
7-29 Nights
1 listings
2.6% of total
30+ Nights
5 listings
12.8% of total
Key Insights
- The most prevalent minimum stay requirement in Plockton is 3 Nights, adopted by 35.9% of listings. This highlights the market's preference for longer commitments.
- A significant segment (12.8%) caters to monthly stays (30+ nights) in Plockton, pointing to opportunities in the extended-stay market.
Recommendations
- Align with the market by considering a 3 Nights minimum stay, as 35.9% of Plockton hosts use this setting.
- Explore offering discounts for stays of 30+ nights to attract the 12.8% of the market seeking extended stays.
- Adjust minimum nights based on seasonality – potentially shorter during low season and longer during peak demand periods in Plockton.
Plockton Airbnb Cancellation Policy Trends Analysis (2025)
Super Strict 30 Days
5 listings
12.8% of total
Super Strict 60 Days
2 listings
5.1% of total
Flexible
5 listings
12.8% of total
Moderate
3 listings
7.7% of total
Firm
5 listings
12.8% of total
Strict
19 listings
48.7% of total
Cancellation Policy Insights for Plockton
- The prevailing Airbnb cancellation policy trend in Plockton is Strict, used by 48.7% of listings.
- A majority (61.5%) of hosts in Plockton utilize Firm or Strict policies, indicating a market where hosts prioritize booking security.
Recommendations for Hosts
- Consider adopting a Strict policy to align with the 48.7% market standard in Plockton.
- With 48.7% using Strict terms, this is a viable option in Plockton, particularly for high-value properties or during peak demand periods.
- Regularly review your cancellation policy against competitors and market demand shifts in Plockton.
Plockton STR Booking Lead Time Analysis (2025)
Average Booking Lead Time by Month
Booking Lead Time Insights for Plockton
- The overall average booking lead time for vacation rentals in Plockton is 105 days.
- Guests book furthest in advance for stays during August (average 144 days), likely coinciding with peak travel demand or local events.
- The shortest booking windows occur for stays in March (average 53 days), indicating more last-minute travel plans during this time.
- Seasonally, Summer (124 days avg.) sees the longest lead times, while Winter (83 days avg.) has the shortest, reflecting typical travel planning cycles.
Recommendations for Hosts
- Use the overall average lead time (105 days) as a baseline for your pricing and availability strategy in Plockton.
- For August stays, consider implementing length-of-stay discounts or slightly higher rates for bookings made less than 144 days out to capitalize on advance planning.
- Target marketing efforts for the Summer season well in advance (at least 124 days) to capture early planners.
- Monitor your own booking lead times against these Plockton averages to identify opportunities for dynamic pricing adjustments.
Popular & Essential Airbnb Amenities in Plockton (2025)
Amenity Prevalence
Amenity Insights for Plockton
- Popular amenities like Smoke alarm, Hot water, Heating are common but not universal. Offering these can provide a competitive edge.
- Warning: Wifi is not universally provided but is considered essential globally. Ensure reliable Wifi is offered.
Recommendations for Hosts
- Consider adding popular differentiators like Smoke alarm or Hot water to increase appeal.
- Highlight unique or less common amenities you offer (e.g., hot tub, dedicated workspace, EV charger) in your listing description and photos.
- Regularly check competitor amenities in Plockton to stay competitive.
Plockton Airbnb Guest Demographics & Profile Analysis (2025)
Guest Profile Summary for Plockton
- The typical guest profile for Airbnb in Plockton consists of a mix of domestic (51%) and international guests, often arriving from nearby England, typically belonging to the Post-2000s (Gen Z/Alpha) group (50%), primarily speaking English or French.
- Domestic travelers account for 50.5% of guests.
- Key international markets include United Kingdom (50.5%) and United States (10.5%).
- Top languages spoken are English (57.1%) followed by French (10.3%).
- A significant demographic segment is the Post-2000s (Gen Z/Alpha) group, representing 50% of guests.
Recommendations for Hosts
- Balance marketing efforts between domestic and international channels based on the guest mix.
- Tailor amenities and listing descriptions to appeal to the dominant Post-2000s (Gen Z/Alpha) demographic (e.g., highlight fast WiFi, smart home features, local guides).
- Highlight unique local experiences or amenities relevant to the primary guest profile.
- Consider seasonal promotions aligned with peak travel times for key origin markets.
Nearby Short-Term Rental Market Comparison
How does the Plockton Airbnb market stack up against its neighbors? Compare key performance metrics like average monthly revenue, ADR, and occupancy rates in surrounding areas to understand the broader regional STR landscape.
| Market | Active Properties | Monthly Revenue | Daily Rate | Avg. Occupancy |
|---|---|---|---|---|
| Fearnan | 19 | $6,440 | $421.92 | 53% |
| Kirkhill | 10 | $5,719 | $700.26 | 44% |
| Glenachulish | 33 | $5,609 | $424.51 | 46% |
| North Kessock | 10 | $5,421 | $380.62 | 58% |
| Carbost | 26 | $5,209 | $324.31 | 62% |
| Foyers | 14 | $5,076 | $274.52 | 64% |
| Arrochar | 33 | $5,045 | $339.11 | 56% |
| Whitebridge | 10 | $4,907 | $417.35 | 42% |
| Port Failthe | 14 | $4,832 | $301.12 | 57% |
| Acharn | 10 | $4,813 | $278.43 | 57% |