Pitlochry Airbnb Market Analysis 2025: Short Term Rental Data & Vacation Rental Statistics in Scotland, United Kingdom
Is Airbnb profitable in Pitlochry in 2025? Explore comprehensive Airbnb analytics for Pitlochry, Scotland, United Kingdom to uncover income potential. This 2025 STR market report for Pitlochry, based on AirROI data from April 2024 to March 2025, reveals key trends in the niche market of 81 active listings.
Whether you're considering an Airbnb investment in Pitlochry, optimizing your existing vacation rental, or exploring rental arbitrage opportunities, understanding the Pitlochry Airbnb data is crucial. Navigating the high regulation landscape is key to maximizing your short term rental income potential. Let's dive into the specifics.
Key Pitlochry Airbnb Performance Metrics Overview
Monthly Airbnb Revenue Variations & Income Potential in Pitlochry (2025)
Understanding the monthly revenue variations for Airbnb listings in Pitlochry is key to maximizing your short term rental income potential. Seasonality significantly impacts earnings. Our analysis, based on data from the past 12 months, shows that the peak revenue month for STRs in Pitlochry is typically August, while February often presents the lowest earnings, highlighting opportunities for strategic pricing adjustments during shoulder and low seasons. Explore the typical Airbnb income in Pitlochry across different performance tiers:
- Best-in-class properties (Top 10%) achieve $5,476+ monthly, often utilizing dynamic pricing and superior guest experiences.
- Strong performing properties (Top 25%) earn $4,085 or more, indicating effective management and desirable locations/amenities.
- Typical properties (Median) generate around $2,726 per month, representing the average market performance.
- Entry-level properties (Bottom 25%) see earnings around $1,369, often with potential for optimization.
Average Monthly Airbnb Earnings Trend in Pitlochry
Pitlochry Airbnb Occupancy Rate Trends (2025)
Maximize your bookings by understanding the Pitlochry STR occupancy trends. Seasonal demand shifts significantly influence how often properties are booked. Typically, Augustsees the highest demand (peak season occupancy), while January experiences the lowest (low season). Effective strategies, like adjusting minimum stays or offering promotions, can boost occupancy during slower periods. Here's how different property tiers perform in Pitlochry:
- Best-in-class properties (Top 10%) achieve 84%+ occupancy, indicating high desirability and potentially optimized availability.
- Strong performing properties (Top 25%) maintain 67% or higher occupancy, suggesting good market fit and guest satisfaction.
- Typical properties (Median) have an occupancy rate around 50%.
- Entry-level properties (Bottom 25%) average 24% occupancy, potentially facing higher vacancy.
Average Monthly Occupancy Rate Trend in Pitlochry
Average Daily Rate (ADR) Airbnb Trends in Pitlochry (2025)
Effective short term rental pricing strategy in Pitlochry involves understanding monthly ADR fluctuations. The Average Daily Rate (ADR) for Airbnb in Pitlochry typically peaks in August and dips lowest during February. Leveraging Airbnb dynamic pricing tools or strategies based on this seasonality can significantly boost revenue. Here's a look at the typical nightly rates achieved:
- Best-in-class properties (Top 10%) command rates of $340+ per night, often due to premium features or locations.
- Strong performing properties (Top 25%) achieve nightly rates of $236 or more.
- Typical properties (Median) charge around $188 per night.
- Entry-level properties (Bottom 25%) earn around $138 per night.
Average Daily Rate (ADR) Trend by Month in Pitlochry
Get Live Pitlochry Market Intelligence 👇

Explore Real-time Analytics
Airbnb Seasonality Analysis & Trends in Pitlochry (2025)
Peak Season (August, July, September)
- Revenue averages $3,782 per month
- Occupancy rates average 61.5%
- Daily rates average $229
Shoulder Season
- Revenue averages $2,992 per month
- Occupancy maintains around 47.6%
- Daily rates hold near $222
Low Season (January, February, March)
- Revenue drops to average $2,071 per month
- Occupancy decreases to average 32.7%
- Daily rates adjust to average $207
Seasonality Insights for Pitlochry
- The Airbnb seasonality in Pitlochry shows moderate seasonality with distinct peak and low periods. While the sections above show seasonal averages, it's also insightful to look at the extremes:
- During the high season, the absolute peak month showcases Pitlochry's highest earning potential, with monthly revenues capable of climbing to $4,007, occupancy reaching a high of 63.4%, and ADRs peaking at $230.
- Conversely, the slowest single month of the year, typically falling within the low season, marks the market's lowest point. In this month, revenue might dip to $1,954, occupancy could drop to 31.3%, and ADRs may adjust down to $205.
- Understanding both the seasonal averages and these monthly peaks and troughs in revenue, occupancy, and ADR is crucial for maximizing your Airbnb profit potential in Pitlochry.
Seasonal Strategies for Maximizing Profit
- Peak Season: Maximize revenue through premium pricing and potentially longer minimum stays. Ensure high availability.
- Low Season: Offer competitive pricing, special promotions (e.g., extended stay discounts), and flexible cancellation policies. Target off-season travelers like remote workers or budget-conscious guests.
- Shoulder Seasons: Implement dynamic pricing that balances peak and low rates. Target weekend travelers or specific events. Offer slightly more flexible terms than peak season.
- Regularly analyze your own performance against these Pitlochry seasonality benchmarks and adjust your pricing and availability strategy accordingly.
Best Areas for Airbnb Investment in Pitlochry (2025)
Exploring the top neighborhoods for short-term rentals in Pitlochry? This section highlights key areas, outlining why they are attractive for hosts and guests, along with notable local attractions. Consider these locations based on your target guest profile and investment strategy.
| Neighborhood / Area | Why Host Here? (Target Guests & Appeal) | Key Attractions & Landmarks |
|---|---|---|
| Atholl Road | The main street of Pitlochry, lined with charming shops and eateries. A bustling area that attracts tourists for both shopping and dining, making it ideal for Airbnb hosts. | The Pitlochry Festival Theatre, Fish Ladder, Pitlochry Dam, Local shops and boutiques, Cafés and restaurants |
| Sully's Brae | A scenic viewpoint area that offers stunning views over Pitlochry and the surrounding hills. Popular for scenic walks and outdoor activities, attracting nature lovers. | Viewpoints for photography, Picnic spots, Nearby hiking trails, Nature walks |
| Port-na-Craig | A picturesque area along the banks of the River Tummel, featuring walks and access to local attractions. Close to nature yet within reach of the town amenities. | River Tummel, Faskally Forest, Walking and cycling paths, Kayaking and fishing |
| Dunkeld Road | A quieter area that is still close to the town center, providing a peaceful retreat for guests. Attracts visitors who prefer a more tranquil atmosphere while being near attractions. | Nearby ancient woodlands, Access to the River Tay, Historic sites such as Dunkeld |
| Loch Faskally | Surrounded by nature, Loch Faskally offers stunning scenery and a range of outdoor activities. Ideal for guests looking to unwind in a serene environment. | Loch Faskally, Water sports, Picnic areas, Walking trails |
| Pitlochry Train Station Area | Conveniently located for travelers arriving via train. This area is perfect for easy access to Pitlochry’s main attractions and further connections across Scotland. | Pitlochry Railway Station, Local transport options, Proximity to festival events |
| Craigrownie Hill | Offers beautiful hiking opportunities and panoramic views of the town and nearby landscapes. Very appealing to hiking enthusiasts and nature lovers. | Hiking trails, Views of the surrounding countryside, Wildlife watching |
| Balnain Farmstead | A rural area that provides a cozy, countryside experience for visitors looking for an escape from urban life. Popular for its tranquillity and nature. | Farm experiences, Local produce, Countryside walks |
Understanding Airbnb License Requirements & STR Laws in Pitlochry (2025)
Yes, Pitlochry, Scotland, United Kingdom enforces high STR regulations. Obtaining a license and ensuring compliance is almost certainly required according to current 2025 STR laws. Always verify the latest short term rental regulations and Airbnb license requirements directly with local government authorities for Pitlochry to ensure full compliance before hosting.
(Source: AirROI data, 2025, based on 43% licensed listings)
Top Performing Airbnb Properties in Pitlochry (2025)
Benchmark your potential! Explore examples of top-performing Airbnb properties in Pitlochrybased on Trailing Twelve Month (TTM) revenue. Analyze their characteristics, revenue, occupancy rate, and ADR to understand what drives success in this market.
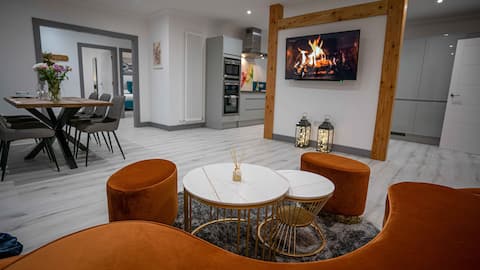
Heather House , luxury holiday house in Pitlochry
Entire Place • 3 bedrooms
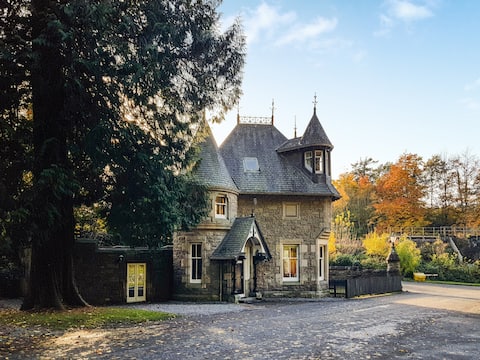
Gatehouse Lodge
Entire Place • 3 bedrooms
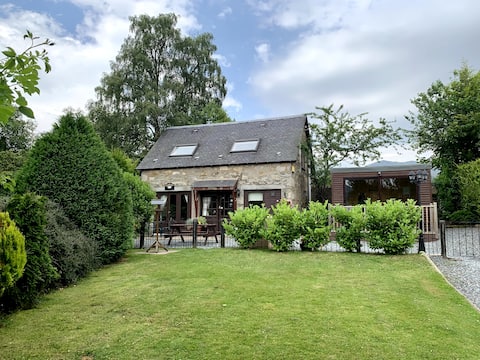
The Old Coach House Pitlochry
Entire Place • 2 bedrooms
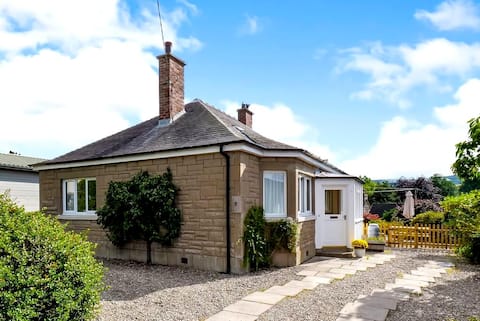
Drumwin Holiday home with stunning views & gardens
Entire Place • 2 bedrooms
Adorable 2 Bedroom Eco-Friendly Character Cottage
Entire Place • 2 bedrooms
4 Bedroom Holiday Home in Pitlochry
Entire Place • 4 bedrooms
Note: Performance varies based on location, size, amenities, seasonality, and management quality. Data reflects the past 12 months.
Top Performing Airbnb Hosts in Pitlochry (2025)
Learn from the best! This table showcases top-performing Airbnb hosts in Pitlochry based on the number of properties managed and estimated total revenue over the past year. Analyze their scale and performance metrics.
| Host Name | Properties | Grossing Revenue | Stay Reviews | Avg Rating |
|---|---|---|---|---|
| Cottages | 8 | $213,436 | 11 | 1.20/5.0 |
| Gerry And Karen | 4 | $124,635 | 73 | 4.92/5.0 |
| Steven | 9 | $122,248 | 88 | 3.77/5.0 |
| Agnes & Kate | 2 | $118,012 | 93 | 5.00/5.0 |
| Home From Home Perthshire | 5 | $116,923 | 59 | 2.93/5.0 |
| Mairi | 3 | $77,703 | 567 | 4.95/5.0 |
| Daniel And Leeanne | 1 | $75,683 | 198 | 4.94/5.0 |
| Atholl Centre | 2 | $72,909 | 29 | 4.41/5.0 |
| Jane | 1 | $71,976 | 56 | 5.00/5.0 |
| Andreas | 1 | $68,180 | 64 | 5.00/5.0 |
Analyzing the strategies of top hosts, such as their property selection, pricing, and guest communication, can offer valuable lessons for optimizing your own Airbnb operations in Pitlochry.
Dive Deeper: Advanced Pitlochry STR Market Data (2025)
Ready to unlock more insights? AirROI provides access to advanced metrics and comprehensive Airbnb data for Pitlochry. Explore detailed analytics beyond this report to refine your investment strategy, optimize pricing, and maximize your vacation rental profits.
Explore Advanced MetricsPitlochry Short-Term Rental Market Composition (2025): Property & Room Types
Room Type Distribution
Property Type Distribution
Market Composition Insights for Pitlochry
- The Pitlochry Airbnb market composition is heavily skewed towards Entire Home/Apt listings, which make up 71.6% of the 81 active rentals. This indicates strong guest preference for privacy and space.
- Looking at the property type distribution in Pitlochry, House properties are the most common (59.3%), reflecting the local real estate landscape.
- Houses represent a significant 59.3% portion, catering likely to families or larger groups.
- The presence of 12.3% Hotel/Boutique listings indicates integration with traditional hospitality.
- Smaller segments like others, outdoor/unique (combined 6.2%) offer potential for unique stay experiences.
Pitlochry Airbnb Room Capacity Analysis (2025): Bedroom Distribution
Distribution of Listings by Number of Bedrooms
Room Capacity Insights for Pitlochry
- The dominant room capacity in Pitlochry is 1 bedroom listings, making up 44.4% of the market. This suggests a strong demand for properties suitable for couples or solo travelers.
- Together, 1 bedroom and 2 bedrooms properties represent 71.6% of the active Airbnb listings in Pitlochry, indicating a high concentration in these sizes.
- A significant 21.0% of listings offer 3+ bedrooms, catering to larger groups and families seeking more space in Pitlochry.
Pitlochry Vacation Rental Guest Capacity Trends (2025)
Distribution of Listings by Guest Capacity
Guest Capacity Insights for Pitlochry
- The most common guest capacity trend in Pitlochry vacation rentals is listings accommodating 2 guests (40.7%). This suggests the primary traveler segment is likely couples or solo travelers.
- Properties designed for 2 guests and 4 guests dominate the Pitlochry STR market, accounting for 64.2% of listings.
- A significant 40.7% of listings cater specifically to 1-2 guests, highlighting strong demand from couples and solo travelers in Pitlochry.
- 18.5% of properties accommodate 6+ guests, serving the market segment for larger families or group travel in Pitlochry.
- On average, properties in Pitlochry are equipped to host 3.2 guests.
Pitlochry Airbnb Booking Patterns (2025): Available vs. Booked Days
Available Days Distribution
Booked Days Distribution
Booking Pattern Insights for Pitlochry
- The most common availability pattern in Pitlochry falls within the 271-366 days range, representing 34.6% of listings. This suggests many properties have significant open periods on their calendars.
- Approximately 59.3% of listings show high availability (181+ days open annually), indicating potential for increased bookings or specific owner usage patterns.
- For booked days, the 181-270 days range is most frequent in Pitlochry (34.6%), reflecting common guest stay durations or potential owner blocking patterns.
- A notable 42.0% of properties secure long booking periods (181+ days booked per year), highlighting successful long-term rental strategies or significant owner usage.
Pitlochry Airbnb Minimum Stay Requirements Analysis
Distribution of Listings by Minimum Night Requirement
1 Night
18 listings
24% of total
2 Nights
17 listings
22.7% of total
3 Nights
13 listings
17.3% of total
4-6 Nights
5 listings
6.7% of total
7-29 Nights
1 listings
1.3% of total
30+ Nights
21 listings
28% of total
Key Insights
- The most prevalent minimum stay requirement in Pitlochry is 30+ Nights, adopted by 28% of listings. This highlights the market's preference for longer commitments.
- A significant segment (28%) caters to monthly stays (30+ nights) in Pitlochry, pointing to opportunities in the extended-stay market.
Recommendations
- Align with the market by considering a 30+ Nights minimum stay, as 28% of Pitlochry hosts use this setting.
- If feasible, allowing 1-night stays, especially midweek or during low season, could capture last-minute bookings, as only 24% currently do.
- Explore offering discounts for stays of 30+ nights to attract the 28% of the market seeking extended stays.
- Adjust minimum nights based on seasonality – potentially shorter during low season and longer during peak demand periods in Pitlochry.
Pitlochry Airbnb Cancellation Policy Trends Analysis (2025)
Super Strict 60 Days
2 listings
2.8% of total
Super Strict 30 Days
1 listings
1.4% of total
Flexible
14 listings
19.4% of total
Moderate
19 listings
26.4% of total
Firm
12 listings
16.7% of total
Strict
24 listings
33.3% of total
Cancellation Policy Insights for Pitlochry
- The prevailing Airbnb cancellation policy trend in Pitlochry is Strict, used by 33.3% of listings.
- There's a relatively balanced mix between guest-friendly (45.8%) and stricter (50.0%) policies, offering choices for different guest needs.
Recommendations for Hosts
- Consider adopting a Strict policy to align with the 33.3% market standard in Pitlochry.
- With 33.3% using Strict terms, this is a viable option in Pitlochry, particularly for high-value properties or during peak demand periods.
- Regularly review your cancellation policy against competitors and market demand shifts in Pitlochry.
Pitlochry STR Booking Lead Time Analysis (2025)
Average Booking Lead Time by Month
Booking Lead Time Insights for Pitlochry
- The overall average booking lead time for vacation rentals in Pitlochry is 94 days.
- Guests book furthest in advance for stays during May (average 125 days), likely coinciding with peak travel demand or local events.
- The shortest booking windows occur for stays in February (average 52 days), indicating more last-minute travel plans during this time.
- Seasonally, Summer (123 days avg.) sees the longest lead times, while Winter (75 days avg.) has the shortest, reflecting typical travel planning cycles.
Recommendations for Hosts
- Use the overall average lead time (94 days) as a baseline for your pricing and availability strategy in Pitlochry.
- For May stays, consider implementing length-of-stay discounts or slightly higher rates for bookings made less than 125 days out to capitalize on advance planning.
- Target marketing efforts for the Summer season well in advance (at least 123 days) to capture early planners.
- Monitor your own booking lead times against these Pitlochry averages to identify opportunities for dynamic pricing adjustments.
Popular & Essential Airbnb Amenities in Pitlochry (2025)
Amenity Prevalence
Amenity Insights for Pitlochry
- Essential amenities in Pitlochry that guests expect include: Heating, Smoke alarm, Wifi, TV, Essentials. Lacking these (any) could significantly impact bookings.
- Popular amenities like Hangers, Iron, Fire extinguisher are common but not universal. Offering these can provide a competitive edge.
Recommendations for Hosts
- Ensure your listing includes all essential amenities for Pitlochry: Heating, Smoke alarm, Wifi, TV, Essentials.
- Prioritize adding missing essentials: Smoke alarm, Wifi, TV, Essentials.
- Consider adding popular differentiators like Hangers or Iron to increase appeal.
- Highlight unique or less common amenities you offer (e.g., hot tub, dedicated workspace, EV charger) in your listing description and photos.
- Regularly check competitor amenities in Pitlochry to stay competitive.
Pitlochry Airbnb Guest Demographics & Profile Analysis (2025)
Guest Profile Summary for Pitlochry
- The typical guest profile for Airbnb in Pitlochry consists of a mix of domestic (60%) and international guests, often arriving from nearby Scotland, typically belonging to the Post-2000s (Gen Z/Alpha) group (50%), primarily speaking English or German.
- Domestic travelers account for 59.6% of guests.
- Key international markets include United Kingdom (59.6%) and United States (12.9%).
- Top languages spoken are English (59.2%) followed by German (9.7%).
- A significant demographic segment is the Post-2000s (Gen Z/Alpha) group, representing 50% of guests.
Recommendations for Hosts
- Balance marketing efforts between domestic and international channels based on the guest mix.
- Tailor amenities and listing descriptions to appeal to the dominant Post-2000s (Gen Z/Alpha) demographic (e.g., highlight fast WiFi, smart home features, local guides).
- Highlight unique local experiences or amenities relevant to the primary guest profile.
- Consider seasonal promotions aligned with peak travel times for key origin markets.
Nearby Short-Term Rental Market Comparison
How does the Pitlochry Airbnb market stack up against its neighbors? Compare key performance metrics like average monthly revenue, ADR, and occupancy rates in surrounding areas to understand the broader regional STR landscape.
| Market | Active Properties | Monthly Revenue | Daily Rate | Avg. Occupancy |
|---|---|---|---|---|
| Galston | 11 | $7,951 | $676.77 | 46% |
| Fearnan | 19 | $6,440 | $421.92 | 53% |
| Gorebridge | 12 | $6,209 | $493.62 | 54% |
| Bridge of Cally | 16 | $5,839 | $566.24 | 50% |
| Kirkhill | 10 | $5,719 | $700.26 | 44% |
| North Kessock | 10 | $5,421 | $380.62 | 58% |
| Foyers | 14 | $5,076 | $274.52 | 64% |
| Arrochar | 33 | $5,045 | $339.11 | 56% |
| Whitebridge | 10 | $4,907 | $417.35 | 42% |
| Acharn | 10 | $4,813 | $278.43 | 57% |