Peterhead Airbnb Market Analysis 2025: Short Term Rental Data & Vacation Rental Statistics in Scotland, United Kingdom
Is Airbnb profitable in Peterhead in 2025? Explore comprehensive Airbnb analytics for Peterhead, Scotland, United Kingdom to uncover income potential. This 2025 STR market report for Peterhead, based on AirROI data from April 2024 to March 2025, reveals key trends in the niche market of 23 active listings.
Whether you're considering an Airbnb investment in Peterhead, optimizing your existing vacation rental, or exploring rental arbitrage opportunities, understanding the Peterhead Airbnb data is crucial. Understanding the local regulations is key to maximizing your short term rental income potential. Let's dive into the specifics.
Key Peterhead Airbnb Performance Metrics Overview
Monthly Airbnb Revenue Variations & Income Potential in Peterhead (2025)
Understanding the monthly revenue variations for Airbnb listings in Peterhead is key to maximizing your short term rental income potential. Seasonality significantly impacts earnings. Our analysis, based on data from the past 12 months, shows that the peak revenue month for STRs in Peterhead is typically August, while February often presents the lowest earnings, highlighting opportunities for strategic pricing adjustments during shoulder and low seasons. Explore the typical Airbnb income in Peterhead across different performance tiers:
- Best-in-class properties (Top 10%) achieve $3,180+ monthly, often utilizing dynamic pricing and superior guest experiences.
- Strong performing properties (Top 25%) earn $2,366 or more, indicating effective management and desirable locations/amenities.
- Typical properties (Median) generate around $1,692 per month, representing the average market performance.
- Entry-level properties (Bottom 25%) see earnings around $812, often with potential for optimization.
Average Monthly Airbnb Earnings Trend in Peterhead
Peterhead Airbnb Occupancy Rate Trends (2025)
Maximize your bookings by understanding the Peterhead STR occupancy trends. Seasonal demand shifts significantly influence how often properties are booked. Typically, Augustsees the highest demand (peak season occupancy), while March experiences the lowest (low season). Effective strategies, like adjusting minimum stays or offering promotions, can boost occupancy during slower periods. Here's how different property tiers perform in Peterhead:
- Best-in-class properties (Top 10%) achieve 79%+ occupancy, indicating high desirability and potentially optimized availability.
- Strong performing properties (Top 25%) maintain 67% or higher occupancy, suggesting good market fit and guest satisfaction.
- Typical properties (Median) have an occupancy rate around 46%.
- Entry-level properties (Bottom 25%) average 23% occupancy, potentially facing higher vacancy.
Average Monthly Occupancy Rate Trend in Peterhead
Average Daily Rate (ADR) Airbnb Trends in Peterhead (2025)
Effective short term rental pricing strategy in Peterhead involves understanding monthly ADR fluctuations. The Average Daily Rate (ADR) for Airbnb in Peterhead typically peaks in December and dips lowest during August. Leveraging Airbnb dynamic pricing tools or strategies based on this seasonality can significantly boost revenue. Here's a look at the typical nightly rates achieved:
- Best-in-class properties (Top 10%) command rates of $166+ per night, often due to premium features or locations.
- Strong performing properties (Top 25%) achieve nightly rates of $136 or more.
- Typical properties (Median) charge around $100 per night.
- Entry-level properties (Bottom 25%) earn around $75 per night.
Average Daily Rate (ADR) Trend by Month in Peterhead
Get Live Peterhead Market Intelligence 👇

Explore Real-time Analytics
Airbnb Seasonality Analysis & Trends in Peterhead (2025)
Peak Season (August, May, July)
- Revenue averages $2,389 per month
- Occupancy rates average 61.1%
- Daily rates average $100
Shoulder Season
- Revenue averages $1,751 per month
- Occupancy maintains around 44.9%
- Daily rates hold near $106
Low Season (February, March, December)
- Revenue drops to average $1,100 per month
- Occupancy decreases to average 32.8%
- Daily rates adjust to average $119
Seasonality Insights for Peterhead
- The Airbnb seasonality in Peterhead shows highly seasonal trends requiring careful strategy. While the sections above show seasonal averages, it's also insightful to look at the extremes:
- During the high season, the absolute peak month showcases Peterhead's highest earning potential, with monthly revenues capable of climbing to $2,639, occupancy reaching a high of 77.4%, and ADRs peaking at $120.
- Conversely, the slowest single month of the year, typically falling within the low season, marks the market's lowest point. In this month, revenue might dip to $987, occupancy could drop to 29.5%, and ADRs may adjust down to $100.
- Understanding both the seasonal averages and these monthly peaks and troughs in revenue, occupancy, and ADR is crucial for maximizing your Airbnb profit potential in Peterhead.
Seasonal Strategies for Maximizing Profit
- Peak Season: Maximize revenue through premium pricing and potentially longer minimum stays. Ensure high availability.
- Low Season: Offer competitive pricing, special promotions (e.g., extended stay discounts), and flexible cancellation policies. Target off-season travelers like remote workers or budget-conscious guests.
- Shoulder Seasons: Implement dynamic pricing that balances peak and low rates. Target weekend travelers or specific events. Offer slightly more flexible terms than peak season.
- Regularly analyze your own performance against these Peterhead seasonality benchmarks and adjust your pricing and availability strategy accordingly.
Best Areas for Airbnb Investment in Peterhead (2025)
Exploring the top neighborhoods for short-term rentals in Peterhead? This section highlights key areas, outlining why they are attractive for hosts and guests, along with notable local attractions. Consider these locations based on your target guest profile and investment strategy.
| Neighborhood / Area | Why Host Here? (Target Guests & Appeal) | Key Attractions & Landmarks |
|---|---|---|
| Peterhead Harbour | A focal point for tourism and local culture, Peterhead Harbour attracts visitors interested in maritime activities, fishing trips, and beautiful coastal scenery. | Peterhead Maritime Heritage, Lighthouse Museum, Fishing Tours, Harbour Views, Restaurants with Seafood Specialties |
| Buchan Ness Lighthouse | This iconic lighthouse is a significant landmark in Peterhead and is popular among tourists looking for scenic views and photographic opportunities. | Buchan Ness Lighthouse, Coastal Walks, Beach Access, Wildlife Watching |
| Peterhead Prison Museum | An intriguing museum set in the former prison, offering insights into local history and prison life, appealing to tourists with an interest in heritage. | Prison Exhibitions, Guided Tours, Local History Displays |
| Rattray Head Lighthouse | Located just outside Peterhead, this historical lighthouse is a must-visit for those interested in marine history and stunning coastal landscapes. | Rattray Head Beach, Scenic Views, Historical Tours |
| Cruden Bay | A charming village near Peterhead, known for its beautiful beach and golf course, popular among visitors seeking recreation and relaxation. | Cruden Bay Beach, Cruden Bay Golf Club, Nearby Castle of Slains |
| Fraserburgh | A nearby town with its own attractions, Fraserburgh offers a mix of fishing heritage and coastal scenery, making it an appealing destination for day trips. | Fraserburgh Lighthouse, Museum of Scottish Lighthouses, Aberdeenshire Coastline |
| Peterhead Town Centre | The town center features shops, eateries, and local markets, providing a taste of the local culture and community life. | Local Shops, Cafes and Restaurants, Community Events |
| Longhaven Cliffs | A natural attraction with stunning views of the cliffs and ocean, ideal for hiking and nature walks, attracting those who enjoy outdoor activities. | Hiking Trails, Bird Watching, Natural Beauty |
Understanding Airbnb License Requirements & STR Laws in Peterhead (2025)
With 13% of listings showing registration in 2025, understanding potential Airbnb license requirements is crucial in Peterhead. Always verify the latest short term rental regulations and Airbnb license requirements directly with local government authorities for Peterhead to ensure full compliance before hosting.
(Source: AirROI data, 2025, based on 13% licensed listings)
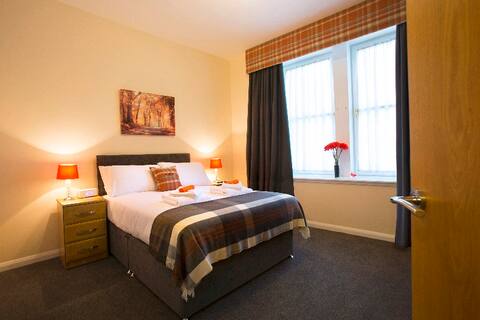
Top Performing Airbnb Properties in Peterhead (2025)
Benchmark your potential! Explore examples of top-performing Airbnb properties in Peterheadbased on Trailing Twelve Month (TTM) revenue. Analyze their characteristics, revenue, occupancy rate, and ADR to understand what drives success in this market.

Homely 3 bed town centre flat
Entire Place • 3 bedrooms

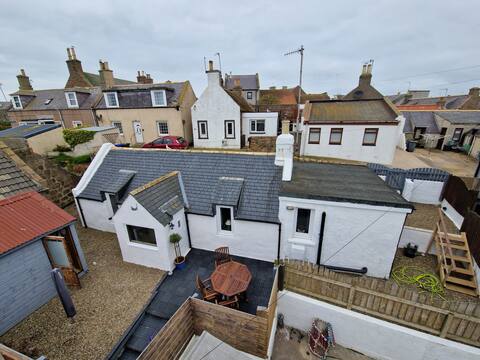
Cottage near Cruden Bay, Aberdeenshire
Entire Place • 2 bedrooms
Superior 2 bedroom 2 bthroom apt
Entire Place • 2 bedrooms
Coopers Cottage
Entire Place • 1 bedroom
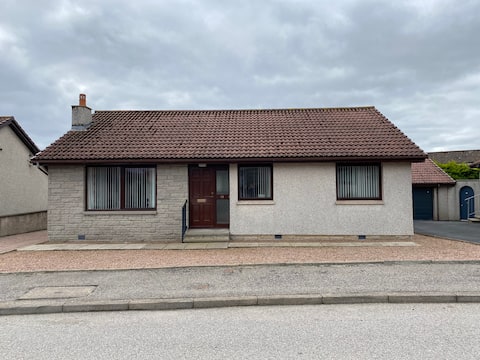
Quiet and Comfortable Bungalow in Peterhead
Entire Place • 3 bedrooms

Three bed apartment in historic town, Peterhead
Entire Place • 3 bedrooms
Note: Performance varies based on location, size, amenities, seasonality, and management quality. Data reflects the past 12 months.
Top Performing Airbnb Hosts in Peterhead (2025)
Learn from the best! This table showcases top-performing Airbnb hosts in Peterhead based on the number of properties managed and estimated total revenue over the past year. Analyze their scale and performance metrics.
| Host Name | Properties | Grossing Revenue | Stay Reviews | Avg Rating |
|---|---|---|---|---|
| Stephen | 2 | $44,074 | 18 | 5.00/5.0 |
| Julianna | 3 | $43,091 | 47 | 4.84/5.0 |
| Siobhan | 2 | $41,817 | 159 | 4.86/5.0 |
| Tyrique | 2 | $38,401 | 21 | 4.90/5.0 |
| Susan | 1 | $25,364 | 47 | 4.98/5.0 |
| Philip | 1 | $22,875 | 29 | 5.00/5.0 |
| Richard | 1 | $22,766 | 66 | 5.00/5.0 |
| Cottages | 1 | $20,917 | 6 | 5.00/5.0 |
| Host #31517231 | 1 | $19,989 | 1 | 0.00/5.0 |
| Kristofor | 1 | $18,383 | 4 | 5.00/5.0 |
Analyzing the strategies of top hosts, such as their property selection, pricing, and guest communication, can offer valuable lessons for optimizing your own Airbnb operations in Peterhead.
Dive Deeper: Advanced Peterhead STR Market Data (2025)
Ready to unlock more insights? AirROI provides access to advanced metrics and comprehensive Airbnb data for Peterhead. Explore detailed analytics beyond this report to refine your investment strategy, optimize pricing, and maximize your vacation rental profits.
Explore Advanced MetricsPeterhead Short-Term Rental Market Composition (2025): Property & Room Types
Room Type Distribution
Property Type Distribution
Market Composition Insights for Peterhead
- The Peterhead Airbnb market composition is heavily skewed towards Entire Home/Apt listings, which make up 82.6% of the 23 active rentals. This indicates strong guest preference for privacy and space.
- Looking at the property type distribution in Peterhead, Apartment/Condo properties are the most common (73.9%), reflecting the local real estate landscape.
- Houses represent a significant 26.1% portion, catering likely to families or larger groups.
Peterhead Airbnb Room Capacity Analysis (2025): Bedroom Distribution
Distribution of Listings by Number of Bedrooms
Room Capacity Insights for Peterhead
- The dominant room capacity in Peterhead is 2 bedrooms listings, making up 47.8% of the market. This suggests a strong demand for properties suitable for couples or solo travelers.
- Together, 2 bedrooms and 1 bedroom properties represent 69.5% of the active Airbnb listings in Peterhead, indicating a high concentration in these sizes.
- A significant 21.7% of listings offer 3+ bedrooms, catering to larger groups and families seeking more space in Peterhead.
Peterhead Vacation Rental Guest Capacity Trends (2025)
Distribution of Listings by Guest Capacity
Guest Capacity Insights for Peterhead
- The most common guest capacity trend in Peterhead vacation rentals is listings accommodating 4 guests (43.5%). This suggests the primary traveler segment is likely small families or groups.
- Properties designed for 4 guests and 2 guests dominate the Peterhead STR market, accounting for 60.9% of listings.
- 17.3% of properties accommodate 6+ guests, serving the market segment for larger families or group travel in Peterhead.
- On average, properties in Peterhead are equipped to host 3.7 guests.
Peterhead Airbnb Booking Patterns (2025): Available vs. Booked Days
Available Days Distribution
Booked Days Distribution
Booking Pattern Insights for Peterhead
- The most common availability pattern in Peterhead falls within the 181-270 days range, representing 39.1% of listings. This suggests many properties have significant open periods on their calendars.
- Approximately 69.5% of listings show high availability (181+ days open annually), indicating potential for increased bookings or specific owner usage patterns.
- For booked days, the 91-180 days range is most frequent in Peterhead (39.1%), reflecting common guest stay durations or potential owner blocking patterns.
- A notable 30.4% of properties secure long booking periods (181+ days booked per year), highlighting successful long-term rental strategies or significant owner usage.
Peterhead Airbnb Minimum Stay Requirements Analysis
Distribution of Listings by Minimum Night Requirement
1 Night
3 listings
13.6% of total
2 Nights
9 listings
40.9% of total
3 Nights
5 listings
22.7% of total
7-29 Nights
3 listings
13.6% of total
30+ Nights
2 listings
9.1% of total
Key Insights
- The most prevalent minimum stay requirement in Peterhead is 2 Nights, adopted by 40.9% of listings. This highlights the market's preference for shorter, flexible bookings.
Recommendations
- Align with the market by considering a 2 Nights minimum stay, as 40.9% of Peterhead hosts use this setting.
- If feasible, allowing 1-night stays, especially midweek or during low season, could capture last-minute bookings, as only 13.6% currently do.
- A 2-night minimum appears standard (40.9%). Consider this for weekends or peak periods.
- Explore offering discounts for stays of 30+ nights to attract the 9.1% of the market seeking extended stays.
- Adjust minimum nights based on seasonality – potentially shorter during low season and longer during peak demand periods in Peterhead.
Peterhead Airbnb Cancellation Policy Trends Analysis (2025)
Super Strict 60 Days
1 listings
5.3% of total
Flexible
9 listings
47.4% of total
Moderate
7 listings
36.8% of total
Firm
2 listings
10.5% of total
Cancellation Policy Insights for Peterhead
- The prevailing Airbnb cancellation policy trend in Peterhead is Flexible, used by 47.4% of listings.
- The market strongly favors guest-friendly terms, with 84.2% of listings offering Flexible or Moderate policies. This suggests guests in Peterhead may expect booking flexibility.
Recommendations for Hosts
- Consider adopting a Flexible policy to align with the 47.4% market standard in Peterhead.
- Regularly review your cancellation policy against competitors and market demand shifts in Peterhead.
Peterhead STR Booking Lead Time Analysis (2025)
Average Booking Lead Time by Month
Booking Lead Time Insights for Peterhead
- The overall average booking lead time for vacation rentals in Peterhead is 37 days.
- Guests book furthest in advance for stays during October (average 53 days), likely coinciding with peak travel demand or local events.
- The shortest booking windows occur for stays in January (average 21 days), indicating more last-minute travel plans during this time.
- Seasonally, Spring (43 days avg.) sees the longest lead times, while Winter (28 days avg.) has the shortest, reflecting typical travel planning cycles.
Recommendations for Hosts
- Use the overall average lead time (37 days) as a baseline for your pricing and availability strategy in Peterhead.
- For October stays, consider implementing length-of-stay discounts or slightly higher rates for bookings made less than 53 days out to capitalize on advance planning.
- Target marketing efforts for the Spring season well in advance (at least 43 days) to capture early planners.
- Monitor your own booking lead times against these Peterhead averages to identify opportunities for dynamic pricing adjustments.
Popular & Essential Airbnb Amenities in Peterhead (2025)
Amenity Prevalence
Amenity Insights for Peterhead
- Essential amenities in Peterhead that guests expect include: Kitchen, TV, Smoke alarm, Wifi, Heating. Lacking these (any) could significantly impact bookings.
- Popular amenities like Iron, Washer, Carbon monoxide alarm are common but not universal. Offering these can provide a competitive edge.
Recommendations for Hosts
- Ensure your listing includes all essential amenities for Peterhead: Kitchen, TV, Smoke alarm, Wifi, Heating.
- Prioritize adding missing essentials: Heating.
- Consider adding popular differentiators like Iron or Washer to increase appeal.
- Highlight unique or less common amenities you offer (e.g., hot tub, dedicated workspace, EV charger) in your listing description and photos.
- Regularly check competitor amenities in Peterhead to stay competitive.
Peterhead Airbnb Guest Demographics & Profile Analysis (2025)
Guest Profile Summary for Peterhead
- The typical guest profile for Airbnb in Peterhead consists of primarily domestic travelers (73%), often arriving from nearby Glasgow, typically belonging to the Post-2000s (Gen Z/Alpha) group (50%), primarily speaking English or French.
- Domestic travelers account for 73.4% of guests.
- Key international markets include United Kingdom (73.4%) and United States (4.9%).
- Top languages spoken are English (66.3%) followed by French (12.9%).
- A significant demographic segment is the Post-2000s (Gen Z/Alpha) group, representing 50% of guests.
Recommendations for Hosts
- Target domestic marketing efforts towards travelers from Glasgow and England.
- Tailor amenities and listing descriptions to appeal to the dominant Post-2000s (Gen Z/Alpha) demographic (e.g., highlight fast WiFi, smart home features, local guides).
- Highlight unique local experiences or amenities relevant to the primary guest profile.
- Consider seasonal promotions aligned with peak travel times for key origin markets.
Nearby Short-Term Rental Market Comparison
How does the Peterhead Airbnb market stack up against its neighbors? Compare key performance metrics like average monthly revenue, ADR, and occupancy rates in surrounding areas to understand the broader regional STR landscape.
| Market | Active Properties | Monthly Revenue | Daily Rate | Avg. Occupancy |
|---|---|---|---|---|
| Leuchars | 16 | $3,949 | $400.90 | 43% |
| St Andrews | 359 | $3,908 | $373.13 | 50% |
| North Berwick | 94 | $3,893 | $330.02 | 52% |
| Mount Melville | 15 | $3,842 | $264.66 | 46% |
| Guardbridge | 10 | $3,618 | $431.50 | 41% |
| Colinsburgh | 15 | $3,594 | $245.58 | 50% |
| Gullane | 29 | $3,508 | $270.21 | 51% |
| East Lothian Council | 11 | $3,084 | $192.65 | 51% |
| Banchory | 19 | $3,054 | $266.20 | 48% |
| Inchmarlo | 10 | $3,047 | $210.64 | 46% |