Perth Airbnb Market Analysis 2025: Short Term Rental Data & Vacation Rental Statistics in Scotland, United Kingdom
Is Airbnb profitable in Perth in 2025? Explore comprehensive Airbnb analytics for Perth, Scotland, United Kingdom to uncover income potential. This 2025 STR market report for Perth, based on AirROI data from April 2024 to March 2025, reveals key trends in the niche market of 129 active listings.
Whether you're considering an Airbnb investment in Perth, optimizing your existing vacation rental, or exploring rental arbitrage opportunities, understanding the Perth Airbnb data is crucial. Navigating the high regulation landscape is key to maximizing your short term rental income potential. Let's dive into the specifics.
Key Perth Airbnb Performance Metrics Overview
Monthly Airbnb Revenue Variations & Income Potential in Perth (2025)
Understanding the monthly revenue variations for Airbnb listings in Perth is key to maximizing your short term rental income potential. Seasonality significantly impacts earnings. Our analysis, based on data from the past 12 months, shows that the peak revenue month for STRs in Perth is typically August, while March often presents the lowest earnings, highlighting opportunities for strategic pricing adjustments during shoulder and low seasons. Explore the typical Airbnb income in Perth across different performance tiers:
- Best-in-class properties (Top 10%) achieve $5,162+ monthly, often utilizing dynamic pricing and superior guest experiences.
- Strong performing properties (Top 25%) earn $3,475 or more, indicating effective management and desirable locations/amenities.
- Typical properties (Median) generate around $2,187 per month, representing the average market performance.
- Entry-level properties (Bottom 25%) see earnings around $1,277, often with potential for optimization.
Average Monthly Airbnb Earnings Trend in Perth
Perth Airbnb Occupancy Rate Trends (2025)
Maximize your bookings by understanding the Perth STR occupancy trends. Seasonal demand shifts significantly influence how often properties are booked. Typically, Augustsees the highest demand (peak season occupancy), while March experiences the lowest (low season). Effective strategies, like adjusting minimum stays or offering promotions, can boost occupancy during slower periods. Here's how different property tiers perform in Perth:
- Best-in-class properties (Top 10%) achieve 84%+ occupancy, indicating high desirability and potentially optimized availability.
- Strong performing properties (Top 25%) maintain 67% or higher occupancy, suggesting good market fit and guest satisfaction.
- Typical properties (Median) have an occupancy rate around 49%.
- Entry-level properties (Bottom 25%) average 27% occupancy, potentially facing higher vacancy.
Average Monthly Occupancy Rate Trend in Perth
Average Daily Rate (ADR) Airbnb Trends in Perth (2025)
Effective short term rental pricing strategy in Perth involves understanding monthly ADR fluctuations. The Average Daily Rate (ADR) for Airbnb in Perth typically peaks in December and dips lowest during April. Leveraging Airbnb dynamic pricing tools or strategies based on this seasonality can significantly boost revenue. Here's a look at the typical nightly rates achieved:
- Best-in-class properties (Top 10%) command rates of $328+ per night, often due to premium features or locations.
- Strong performing properties (Top 25%) achieve nightly rates of $225 or more.
- Typical properties (Median) charge around $154 per night.
- Entry-level properties (Bottom 25%) earn around $109 per night.
Average Daily Rate (ADR) Trend by Month in Perth
Get Live Perth Market Intelligence 👇

Explore Real-time Analytics
Airbnb Seasonality Analysis & Trends in Perth (2025)
Peak Season (August, July, June)
- Revenue averages $3,602 per month
- Occupancy rates average 60.9%
- Daily rates average $187
Shoulder Season
- Revenue averages $2,674 per month
- Occupancy maintains around 46.6%
- Daily rates hold near $188
Low Season (January, February, March)
- Revenue drops to average $1,813 per month
- Occupancy decreases to average 37.1%
- Daily rates adjust to average $189
Seasonality Insights for Perth
- The Airbnb seasonality in Perth shows highly seasonal trends requiring careful strategy. While the sections above show seasonal averages, it's also insightful to look at the extremes:
- During the high season, the absolute peak month showcases Perth's highest earning potential, with monthly revenues capable of climbing to $3,883, occupancy reaching a high of 67.3%, and ADRs peaking at $199.
- Conversely, the slowest single month of the year, typically falling within the low season, marks the market's lowest point. In this month, revenue might dip to $1,645, occupancy could drop to 33.0%, and ADRs may adjust down to $182.
- Understanding both the seasonal averages and these monthly peaks and troughs in revenue, occupancy, and ADR is crucial for maximizing your Airbnb profit potential in Perth.
Seasonal Strategies for Maximizing Profit
- Peak Season: Maximize revenue through premium pricing and potentially longer minimum stays. Ensure high availability.
- Low Season: Offer competitive pricing, special promotions (e.g., extended stay discounts), and flexible cancellation policies. Target off-season travelers like remote workers or budget-conscious guests.
- Shoulder Seasons: Implement dynamic pricing that balances peak and low rates. Target weekend travelers or specific events. Offer slightly more flexible terms than peak season.
- Regularly analyze your own performance against these Perth seasonality benchmarks and adjust your pricing and availability strategy accordingly.
Best Areas for Airbnb Investment in Perth (2025)
Exploring the top neighborhoods for short-term rentals in Perth? This section highlights key areas, outlining why they are attractive for hosts and guests, along with notable local attractions. Consider these locations based on your target guest profile and investment strategy.
| Neighborhood / Area | Why Host Here? (Target Guests & Appeal) | Key Attractions & Landmarks |
|---|---|---|
| City Centre | The vibrant heart of Perth, offering a mix of cultural attractions, shopping, and dining. It's ideal for tourists looking to explore the city on foot. | Perth Concert Hall, Perth Museum and Art Gallery, The St. John’s Kirk, Shopping at St. Johns Shopping Centre, KP – Kinnoull Hill, The Black Watch Castle and Museum |
| South Perth | A picturesque area across the river from the city centre, perfect for those looking for scenic views of the Perth skyline, parks, and beautiful beaches. | Perth Zoo, South Perth Foreshore, Sir James Mitchell Park, Civic Centre, The Old Mill |
| Northbridge | Known for its lively atmosphere and nightlife, this area is home to many bars, restaurants, and cultural venues, appealing to younger travelers. | Northbridge Piazza, Museum of Contemporary Art, Perth Cultural Centre, The State Theatre Centre of Western Australia |
| Scarborough Beach | Famous for its beautiful beaches and surf culture, this area attracts beach lovers and holiday-makers looking for a relaxed seaside experience. | Scarborough Beach Foreshore, Cottesloe Beach, Scarborough Surf Life Saving Club, Water sports and activities |
| Fremantle | A historical coastal town with vibrant markets, rich maritime history, and a thriving arts scene, attracting visitors looking for unique experiences. | Fremantle Markets, Fremantle Prison, The Roundhouse, Little Creatures Brewery, Fremantle Fishing Boat Harbour |
| Cottesloe | An upscale coastal suburb known for its stunning beaches, relaxed lifestyle, and vibrant dining scene, appealing to both tourists and locals. | Cottesloe Beach, Cottesloe Hotel, John Street Cafe, Cottesloe Sculpture by the Sea |
| Subiaco | A trendy suburb with a boutique shopping scene, cafes, and parks, popular among those looking for a charming residential vibe with close proximity to the city. | Subiaco Oval, Markets at Subiaco, The Regal Theatre, Lake Kings Park |
| Mount Hawthorn | An up-and-coming area with a vibrant arts scene, boutique shops, and local cafes, appealing to those seeking a hip and local experience. | The Mezz Shopping Centre, Mount Hawthorn Hub, Local art galleries, Cafes and restaurants |
Understanding Airbnb License Requirements & STR Laws in Perth (2025)
Yes, Perth, Scotland, United Kingdom enforces high STR regulations. Obtaining a license and ensuring compliance is almost certainly required according to current 2025 STR laws. Always verify the latest short term rental regulations and Airbnb license requirements directly with local government authorities for Perth to ensure full compliance before hosting.
(Source: AirROI data, 2025, based on 40% licensed listings)
Top Performing Airbnb Properties in Perth (2025)
Benchmark your potential! Explore examples of top-performing Airbnb properties in Perthbased on Trailing Twelve Month (TTM) revenue. Analyze their characteristics, revenue, occupancy rate, and ADR to understand what drives success in this market.
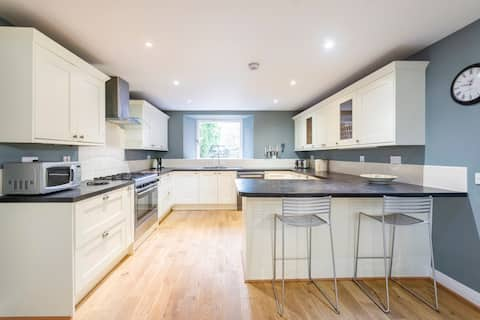
Fully restored Georgian townhouse in Perth
Entire Place • 6 bedrooms
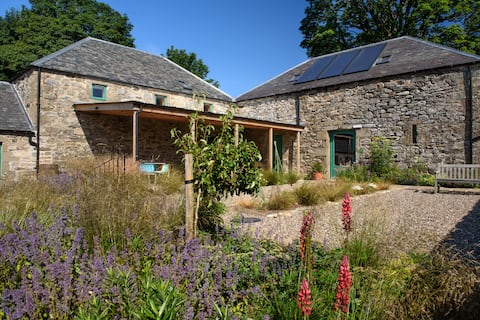
Burmieston Steading, eco retreat in Perthshire
Entire Place • 5 bedrooms
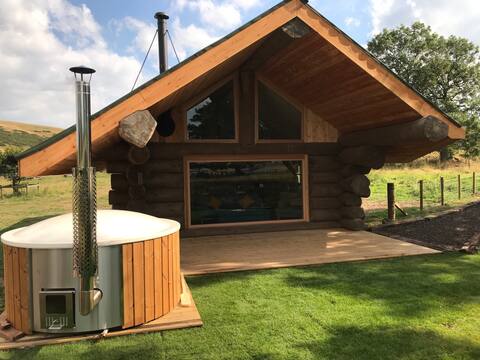
Hobbit log cabin, Eco, beautiful views, hot tub
Entire Place • 2 bedrooms

Chic Apartment with Hot Tub
Entire Place • 2 bedrooms

Luxury Lodge with steam room in Perth
Entire Place • 3 bedrooms
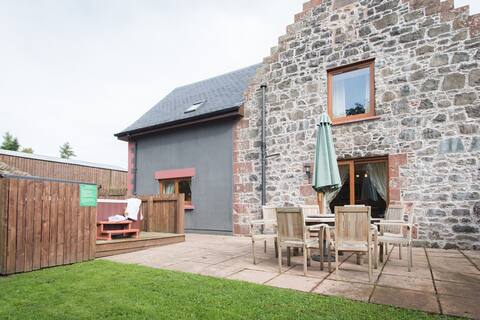
The Granary with Hot Tub
Entire Place • 4 bedrooms
Note: Performance varies based on location, size, amenities, seasonality, and management quality. Data reflects the past 12 months.
Top Performing Airbnb Hosts in Perth (2025)
Learn from the best! This table showcases top-performing Airbnb hosts in Perth based on the number of properties managed and estimated total revenue over the past year. Analyze their scale and performance metrics.
| Host Name | Properties | Grossing Revenue | Stay Reviews | Avg Rating |
|---|---|---|---|---|
| Lee | 7 | $253,917 | 638 | 4.08/5.0 |
| Bartek | 5 | $180,912 | 134 | 4.94/5.0 |
| Nick | 1 | $149,999 | 77 | 4.90/5.0 |
| Sarah | 5 | $126,207 | 859 | 4.88/5.0 |
| Solid | 5 | $113,118 | 22 | 2.89/5.0 |
| Donna | 2 | $109,656 | 57 | 4.98/5.0 |
| Keesje And Olly | 1 | $89,891 | 89 | 4.96/5.0 |
| Cottages | 3 | $79,193 | 22 | 4.94/5.0 |
| Antonia | 1 | $78,882 | 222 | 4.92/5.0 |
| Deborah | 1 | $61,628 | 286 | 4.99/5.0 |
Analyzing the strategies of top hosts, such as their property selection, pricing, and guest communication, can offer valuable lessons for optimizing your own Airbnb operations in Perth.
Dive Deeper: Advanced Perth STR Market Data (2025)
Ready to unlock more insights? AirROI provides access to advanced metrics and comprehensive Airbnb data for Perth. Explore detailed analytics beyond this report to refine your investment strategy, optimize pricing, and maximize your vacation rental profits.
Explore Advanced MetricsPerth Short-Term Rental Market Composition (2025): Property & Room Types
Room Type Distribution
Property Type Distribution
Market Composition Insights for Perth
- The Perth Airbnb market composition is heavily skewed towards Entire Home/Apt listings, which make up 89.1% of the 129 active rentals. This indicates strong guest preference for privacy and space.
- Looking at the property type distribution in Perth, Apartment/Condo properties are the most common (56.6%), reflecting the local real estate landscape.
- Houses represent a significant 28.7% portion, catering likely to families or larger groups.
- Smaller segments like others, hotel/boutique, unique stays (combined 8.5%) offer potential for unique stay experiences.
Perth Airbnb Room Capacity Analysis (2025): Bedroom Distribution
Distribution of Listings by Number of Bedrooms
Room Capacity Insights for Perth
- The dominant room capacity in Perth is 1 bedroom listings, making up 35.7% of the market. This suggests a strong demand for properties suitable for couples or solo travelers.
- Together, 1 bedroom and 2 bedrooms properties represent 68.3% of the active Airbnb listings in Perth, indicating a high concentration in these sizes.
- A significant 22.5% of listings offer 3+ bedrooms, catering to larger groups and families seeking more space in Perth.
Perth Vacation Rental Guest Capacity Trends (2025)
Distribution of Listings by Guest Capacity
Guest Capacity Insights for Perth
- The most common guest capacity trend in Perth vacation rentals is listings accommodating 2 guests (31%). This suggests the primary traveler segment is likely couples or solo travelers.
- Properties designed for 2 guests and 4 guests dominate the Perth STR market, accounting for 57.4% of listings.
- 24.8% of properties accommodate 6+ guests, serving the market segment for larger families or group travel in Perth.
- On average, properties in Perth are equipped to host 3.7 guests.
Perth Airbnb Booking Patterns (2025): Available vs. Booked Days
Available Days Distribution
Booked Days Distribution
Booking Pattern Insights for Perth
- The most common availability pattern in Perth falls within the 181-270 days range, representing 33.3% of listings. This suggests many properties have significant open periods on their calendars.
- Approximately 62.8% of listings show high availability (181+ days open annually), indicating potential for increased bookings or specific owner usage patterns.
- For booked days, the 91-180 days range is most frequent in Perth (34.9%), reflecting common guest stay durations or potential owner blocking patterns.
- A notable 37.2% of properties secure long booking periods (181+ days booked per year), highlighting successful long-term rental strategies or significant owner usage.
Perth Airbnb Minimum Stay Requirements Analysis
Distribution of Listings by Minimum Night Requirement
1 Night
38 listings
31.1% of total
2 Nights
41 listings
33.6% of total
3 Nights
17 listings
13.9% of total
4-6 Nights
9 listings
7.4% of total
7-29 Nights
5 listings
4.1% of total
30+ Nights
12 listings
9.8% of total
Key Insights
- The most prevalent minimum stay requirement in Perth is 2 Nights, adopted by 33.6% of listings. This highlights the market's preference for shorter, flexible bookings.
- A strong majority (64.7%) of the Perth Airbnb data shows acceptance of very short stays (1-2 nights), indicating a dynamic, high-turnover market.
Recommendations
- Align with the market by considering a 2 Nights minimum stay, as 33.6% of Perth hosts use this setting.
- Explore offering discounts for stays of 30+ nights to attract the 9.8% of the market seeking extended stays.
- Adjust minimum nights based on seasonality – potentially shorter during low season and longer during peak demand periods in Perth.
Perth Airbnb Cancellation Policy Trends Analysis (2025)
Super Strict 60 Days
5 listings
4.3% of total
Flexible
38 listings
32.5% of total
Moderate
31 listings
26.5% of total
Firm
25 listings
21.4% of total
Strict
18 listings
15.4% of total
Cancellation Policy Insights for Perth
- The prevailing Airbnb cancellation policy trend in Perth is Flexible, used by 32.5% of listings.
- There's a relatively balanced mix between guest-friendly (59.0%) and stricter (36.8%) policies, offering choices for different guest needs.
Recommendations for Hosts
- Consider adopting a Flexible policy to align with the 32.5% market standard in Perth.
- Regularly review your cancellation policy against competitors and market demand shifts in Perth.
Perth STR Booking Lead Time Analysis (2025)
Average Booking Lead Time by Month
Booking Lead Time Insights for Perth
- The overall average booking lead time for vacation rentals in Perth is 55 days.
- Guests book furthest in advance for stays during July (average 95 days), likely coinciding with peak travel demand or local events.
- The shortest booking windows occur for stays in March (average 38 days), indicating more last-minute travel plans during this time.
- Seasonally, Summer (80 days avg.) sees the longest lead times, while Winter (48 days avg.) has the shortest, reflecting typical travel planning cycles.
Recommendations for Hosts
- Use the overall average lead time (55 days) as a baseline for your pricing and availability strategy in Perth.
- For July stays, consider implementing length-of-stay discounts or slightly higher rates for bookings made less than 95 days out to capitalize on advance planning.
- Target marketing efforts for the Summer season well in advance (at least 80 days) to capture early planners.
- Monitor your own booking lead times against these Perth averages to identify opportunities for dynamic pricing adjustments.
Popular & Essential Airbnb Amenities in Perth (2025)
Amenity Prevalence
Amenity Insights for Perth
- Essential amenities in Perth that guests expect include: Smoke alarm, Wifi. Lacking these (any) could significantly impact bookings.
- Popular amenities like Heating, TV, Hangers are common but not universal. Offering these can provide a competitive edge.
Recommendations for Hosts
- Ensure your listing includes all essential amenities for Perth: Smoke alarm, Wifi.
- Prioritize adding missing essentials: Wifi.
- Consider adding popular differentiators like Heating or TV to increase appeal.
- Highlight unique or less common amenities you offer (e.g., hot tub, dedicated workspace, EV charger) in your listing description and photos.
- Regularly check competitor amenities in Perth to stay competitive.
Perth Airbnb Guest Demographics & Profile Analysis (2025)
Guest Profile Summary for Perth
- The typical guest profile for Airbnb in Perth consists of a mix of domestic (65%) and international guests, often arriving from nearby Scotland, typically belonging to the Post-2000s (Gen Z/Alpha) group (50%), primarily speaking English or French.
- Domestic travelers account for 64.6% of guests.
- Key international markets include United Kingdom (64.6%) and United States (11.6%).
- Top languages spoken are English (63.3%) followed by French (8.6%).
- A significant demographic segment is the Post-2000s (Gen Z/Alpha) group, representing 50% of guests.
Recommendations for Hosts
- Target domestic marketing efforts towards travelers from Scotland and England.
- Tailor amenities and listing descriptions to appeal to the dominant Post-2000s (Gen Z/Alpha) demographic (e.g., highlight fast WiFi, smart home features, local guides).
- Highlight unique local experiences or amenities relevant to the primary guest profile.
- Consider seasonal promotions aligned with peak travel times for key origin markets.
Nearby Short-Term Rental Market Comparison
How does the Perth Airbnb market stack up against its neighbors? Compare key performance metrics like average monthly revenue, ADR, and occupancy rates in surrounding areas to understand the broader regional STR landscape.
| Market | Active Properties | Monthly Revenue | Daily Rate | Avg. Occupancy |
|---|---|---|---|---|
| Galston | 11 | $7,951 | $676.77 | 46% |
| Fearnan | 19 | $6,440 | $421.92 | 53% |
| Gorebridge | 12 | $6,209 | $493.62 | 54% |
| Bridge of Cally | 16 | $5,839 | $566.24 | 50% |
| Kirkhill | 10 | $5,719 | $700.26 | 44% |
| North Kessock | 10 | $5,421 | $380.62 | 58% |
| Foyers | 14 | $5,076 | $274.52 | 64% |
| Arrochar | 33 | $5,045 | $339.11 | 56% |
| Whitebridge | 10 | $4,907 | $417.35 | 42% |
| Acharn | 10 | $4,813 | $278.43 | 57% |