New Galloway Airbnb Market Analysis 2025: Short Term Rental Data & Vacation Rental Statistics in Scotland, United Kingdom
Is Airbnb profitable in New Galloway in 2025? Explore comprehensive Airbnb analytics for New Galloway, Scotland, United Kingdom to uncover income potential. This 2025 STR market report for New Galloway, based on AirROI data from April 2024 to March 2025, reveals key trends in the niche market of 18 active listings.
Whether you're considering an Airbnb investment in New Galloway, optimizing your existing vacation rental, or exploring rental arbitrage opportunities, understanding the New Galloway Airbnb data is crucial. Navigating the high regulation landscape is key to maximizing your short term rental income potential. Let's dive into the specifics.
Key New Galloway Airbnb Performance Metrics Overview
Monthly Airbnb Revenue Variations & Income Potential in New Galloway (2025)
Understanding the monthly revenue variations for Airbnb listings in New Galloway is key to maximizing your short term rental income potential. Seasonality significantly impacts earnings. Our analysis, based on data from the past 12 months, shows that the peak revenue month for STRs in New Galloway is typically May, while November often presents the lowest earnings, highlighting opportunities for strategic pricing adjustments during shoulder and low seasons. Explore the typical Airbnb income in New Galloway across different performance tiers:
- Best-in-class properties (Top 10%) achieve $4,406+ monthly, often utilizing dynamic pricing and superior guest experiences.
- Strong performing properties (Top 25%) earn $3,098 or more, indicating effective management and desirable locations/amenities.
- Typical properties (Median) generate around $1,863 per month, representing the average market performance.
- Entry-level properties (Bottom 25%) see earnings around $1,213, often with potential for optimization.
Average Monthly Airbnb Earnings Trend in New Galloway
New Galloway Airbnb Occupancy Rate Trends (2025)
Maximize your bookings by understanding the New Galloway STR occupancy trends. Seasonal demand shifts significantly influence how often properties are booked. Typically, Augustsees the highest demand (peak season occupancy), while January experiences the lowest (low season). Effective strategies, like adjusting minimum stays or offering promotions, can boost occupancy during slower periods. Here's how different property tiers perform in New Galloway:
- Best-in-class properties (Top 10%) achieve 77%+ occupancy, indicating high desirability and potentially optimized availability.
- Strong performing properties (Top 25%) maintain 67% or higher occupancy, suggesting good market fit and guest satisfaction.
- Typical properties (Median) have an occupancy rate around 48%.
- Entry-level properties (Bottom 25%) average 28% occupancy, potentially facing higher vacancy.
Average Monthly Occupancy Rate Trend in New Galloway
Average Daily Rate (ADR) Airbnb Trends in New Galloway (2025)
Effective short term rental pricing strategy in New Galloway involves understanding monthly ADR fluctuations. The Average Daily Rate (ADR) for Airbnb in New Galloway typically peaks in July and dips lowest during March. Leveraging Airbnb dynamic pricing tools or strategies based on this seasonality can significantly boost revenue. Here's a look at the typical nightly rates achieved:
- Best-in-class properties (Top 10%) command rates of $323+ per night, often due to premium features or locations.
- Strong performing properties (Top 25%) achieve nightly rates of $206 or more.
- Typical properties (Median) charge around $155 per night.
- Entry-level properties (Bottom 25%) earn around $112 per night.
Average Daily Rate (ADR) Trend by Month in New Galloway
Get Live New Galloway Market Intelligence 👇

Explore Real-time Analytics
Airbnb Seasonality Analysis & Trends in New Galloway (2025)
Peak Season (May, August, September)
- Revenue averages $3,359 per month
- Occupancy rates average 67.5%
- Daily rates average $223
Shoulder Season
- Revenue averages $2,300 per month
- Occupancy maintains around 46.7%
- Daily rates hold near $222
Low Season (January, March, November)
- Revenue drops to average $1,537 per month
- Occupancy decreases to average 32.4%
- Daily rates adjust to average $209
Seasonality Insights for New Galloway
- The Airbnb seasonality in New Galloway shows highly seasonal trends requiring careful strategy. While the sections above show seasonal averages, it's also insightful to look at the extremes:
- During the high season, the absolute peak month showcases New Galloway's highest earning potential, with monthly revenues capable of climbing to $3,645, occupancy reaching a high of 77.7%, and ADRs peaking at $251.
- Conversely, the slowest single month of the year, typically falling within the low season, marks the market's lowest point. In this month, revenue might dip to $1,363, occupancy could drop to 22.2%, and ADRs may adjust down to $198.
- Understanding both the seasonal averages and these monthly peaks and troughs in revenue, occupancy, and ADR is crucial for maximizing your Airbnb profit potential in New Galloway.
Seasonal Strategies for Maximizing Profit
- Peak Season: Maximize revenue through premium pricing and potentially longer minimum stays. Ensure high availability.
- Low Season: Offer competitive pricing, special promotions (e.g., extended stay discounts), and flexible cancellation policies. Target off-season travelers like remote workers or budget-conscious guests.
- Shoulder Seasons: Implement dynamic pricing that balances peak and low rates. Target weekend travelers or specific events. Offer slightly more flexible terms than peak season.
- Regularly analyze your own performance against these New Galloway seasonality benchmarks and adjust your pricing and availability strategy accordingly.
Best Areas for Airbnb Investment in New Galloway (2025)
Exploring the top neighborhoods for short-term rentals in New Galloway? This section highlights key areas, outlining why they are attractive for hosts and guests, along with notable local attractions. Consider these locations based on your target guest profile and investment strategy.
| Neighborhood / Area | Why Host Here? (Target Guests & Appeal) | Key Attractions & Landmarks |
|---|---|---|
| Waterloo | A scenic spot near the River Ken, known for its picturesque views and tranquility. Ideal for those looking to escape into nature while being close to local attractions. | Galloway Forest Park, Loch Ken, Threave Garden, Broughton House, Castle Douglas |
| Castle Douglas | A charming market town known for its local produce and vibrant community events. Attracts visitors interested in dining, shopping, and exploring local culture. | Castle Douglas Golf Club, Stewartry Museum, Gordon Memorial Library, Local Art Galleries, Threave Estate |
| Laurel Bank | A peaceful residential area that offers easy access to the surrounding countryside and local attractions. Great for families and nature lovers looking for a quiet retreat. | Galloway Wildlife Conservation Park, The Crichton, Dumfries and Galloway Aviation Museum, Sulwath Brewery, Local walking trails |
| Carsethorn | A quaint coastal village known for its stunning sunsets and quaint beach houses. Popular with those seeking a relaxing seaside getaway. | Carsethorn Beach, The Old Kirk, Coastal walking paths, Local seafood restaurants, Water sports activities |
| Dalbeattie | A vibrant small town surrounded by forest and farmland. Great for outdoor activities and exploring the rugged beauty of Scotland. | Dalbeattie Forest, Woodland trails, Dalbeattie Museum, Local craft shops, Adventure activities |
| Glenlochar | A rural area offering true Scottish countryside charm, perfect for those looking to immerse themselves in nature and outdoor activities. | Glenlochar Loch, Walking and cycling paths, Nature watching, Historic sites nearby, Peaceful surroundings |
| Kirkcudbright | Known as the 'Artists' Town', this area attracts those interested in art, history, and the charming coastal lifestyle. | Kirkcudbright Galleries, Broughton House, St. Cuthbert's Church, Local art festivals, Coastal walks |
| Whithorn | Steeped in history as the site of Scotland's first Christian settlement, it attracts visitors interested in history and culture. | Whithorn Priory, Museum of Whithorn, Historic trails, Local artisan shops, Countryside walks |
Understanding Airbnb License Requirements & STR Laws in New Galloway (2025)
Yes, New Galloway, Scotland, United Kingdom enforces high STR regulations. Obtaining a license and ensuring compliance is almost certainly required according to current 2025 STR laws. Always verify the latest short term rental regulations and Airbnb license requirements directly with local government authorities for New Galloway to ensure full compliance before hosting.
(Source: AirROI data, 2025, based on 33% licensed listings)
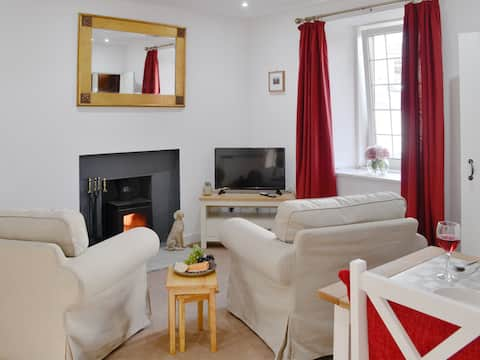
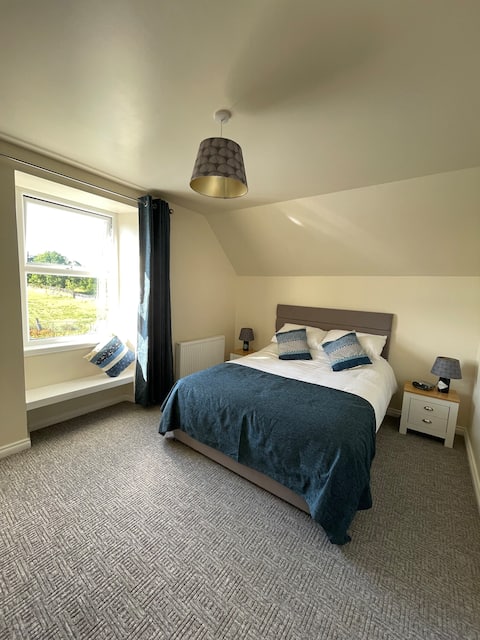
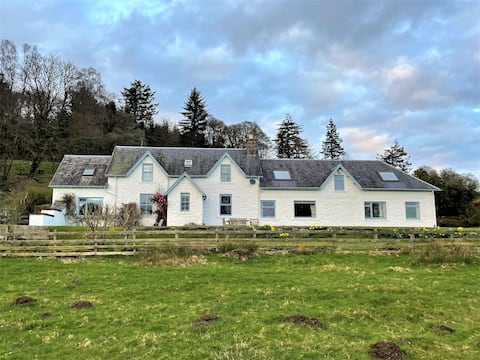
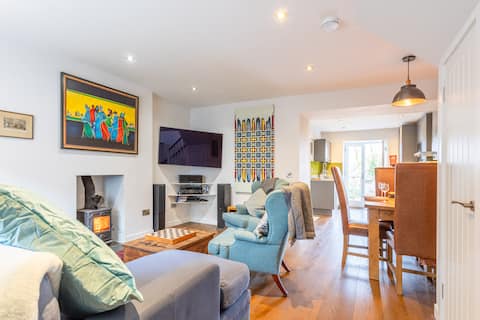
Top Performing Airbnb Properties in New Galloway (2025)
Benchmark your potential! Explore examples of top-performing Airbnb properties in New Gallowaybased on Trailing Twelve Month (TTM) revenue. Analyze their characteristics, revenue, occupancy rate, and ADR to understand what drives success in this market.
Wylies Brae
Entire Place • 1 bedroom
Cozy 2 bed cottage with log burner close to Loch
Entire Place • 2 bedrooms

Sunnyside
Entire Place • 2 bedrooms
Kenmure Kennels
Entire Place • 8 bedrooms
Quirky & Cosy Village Home in New Galloway
Entire Place • 2 bedrooms

Fauld O Wheat Shepherds Hut , Loch Ken ,Off Grid
Entire Place • 1 bedroom
Note: Performance varies based on location, size, amenities, seasonality, and management quality. Data reflects the past 12 months.
Top Performing Airbnb Hosts in New Galloway (2025)
Learn from the best! This table showcases top-performing Airbnb hosts in New Galloway based on the number of properties managed and estimated total revenue over the past year. Analyze their scale and performance metrics.
| Host Name | Properties | Grossing Revenue | Stay Reviews | Avg Rating |
|---|---|---|---|---|
| Cottages | 3 | $84,791 | 20 | 3.13/5.0 |
| Debbie | 2 | $62,467 | 194 | 5.00/5.0 |
| Kate | 3 | $43,786 | 150 | 4.72/5.0 |
| Discover Scotland | 1 | $27,419 | 14 | 4.71/5.0 |
| Christine | 1 | $20,770 | 7 | 4.57/5.0 |
| Maybelle | 2 | $20,504 | 4 | 2.50/5.0 |
| Chris | 1 | $20,055 | 39 | 4.95/5.0 |
| Richard | 1 | $19,668 | 16 | 4.88/5.0 |
| Adrian | 1 | $18,062 | 236 | 4.79/5.0 |
| Katy | 1 | $15,120 | 216 | 4.95/5.0 |
Analyzing the strategies of top hosts, such as their property selection, pricing, and guest communication, can offer valuable lessons for optimizing your own Airbnb operations in New Galloway.
Dive Deeper: Advanced New Galloway STR Market Data (2025)
Ready to unlock more insights? AirROI provides access to advanced metrics and comprehensive Airbnb data for New Galloway. Explore detailed analytics beyond this report to refine your investment strategy, optimize pricing, and maximize your vacation rental profits.
Explore Advanced MetricsNew Galloway Short-Term Rental Market Composition (2025): Property & Room Types
Room Type Distribution
Property Type Distribution
Market Composition Insights for New Galloway
- The New Galloway Airbnb market composition is heavily skewed towards Entire Home/Apt listings, which make up 100% of the 18 active rentals. This indicates strong guest preference for privacy and space.
- Looking at the property type distribution in New Galloway, House properties are the most common (61.1%), reflecting the local real estate landscape.
- Houses represent a significant 61.1% portion, catering likely to families or larger groups.
New Galloway Airbnb Room Capacity Analysis (2025): Bedroom Distribution
Distribution of Listings by Number of Bedrooms
Room Capacity Insights for New Galloway
- The dominant room capacity in New Galloway is 2 bedrooms listings, making up 38.9% of the market. This suggests a strong demand for properties suitable for couples or solo travelers.
- Together, 2 bedrooms and 1 bedroom properties represent 72.2% of the active Airbnb listings in New Galloway, indicating a high concentration in these sizes.
- A significant 27.8% of listings offer 3+ bedrooms, catering to larger groups and families seeking more space in New Galloway.
New Galloway Vacation Rental Guest Capacity Trends (2025)
Distribution of Listings by Guest Capacity
Guest Capacity Insights for New Galloway
- The most common guest capacity trend in New Galloway vacation rentals is listings accommodating 6 guests (38.9%). This suggests the primary traveler segment is likely larger groups.
- Properties designed for 6 guests and 4 guests dominate the New Galloway STR market, accounting for 66.7% of listings.
- 44.5% of properties accommodate 6+ guests, serving the market segment for larger families or group travel in New Galloway.
- On average, properties in New Galloway are equipped to host 4.5 guests.
New Galloway Airbnb Booking Patterns (2025): Available vs. Booked Days
Available Days Distribution
Booked Days Distribution
Booking Pattern Insights for New Galloway
- The most common availability pattern in New Galloway falls within the 271-366 days range, representing 38.9% of listings. This suggests many properties have significant open periods on their calendars.
- Approximately 72.2% of listings show high availability (181+ days open annually), indicating potential for increased bookings or specific owner usage patterns.
- For booked days, the 91-180 days range is most frequent in New Galloway (33.3%), reflecting common guest stay durations or potential owner blocking patterns.
- A notable 33.3% of properties secure long booking periods (181+ days booked per year), highlighting successful long-term rental strategies or significant owner usage.
New Galloway Airbnb Minimum Stay Requirements Analysis
Distribution of Listings by Minimum Night Requirement
1 Night
6 listings
35.3% of total
2 Nights
5 listings
29.4% of total
3 Nights
1 listings
5.9% of total
4-6 Nights
1 listings
5.9% of total
30+ Nights
4 listings
23.5% of total
Key Insights
- The most prevalent minimum stay requirement in New Galloway is 1 Night, adopted by 35.3% of listings. This highlights the market's preference for shorter, flexible bookings.
- A strong majority (64.7%) of the New Galloway Airbnb data shows acceptance of very short stays (1-2 nights), indicating a dynamic, high-turnover market.
- A significant segment (23.5%) caters to monthly stays (30+ nights) in New Galloway, pointing to opportunities in the extended-stay market.
Recommendations
- Align with the market by considering a 1 Night minimum stay, as 35.3% of New Galloway hosts use this setting.
- Explore offering discounts for stays of 30+ nights to attract the 23.5% of the market seeking extended stays.
- Adjust minimum nights based on seasonality – potentially shorter during low season and longer during peak demand periods in New Galloway.
New Galloway Airbnb Cancellation Policy Trends Analysis (2025)
Super Strict 60 Days
2 listings
13.3% of total
Flexible
5 listings
33.3% of total
Moderate
3 listings
20% of total
Firm
4 listings
26.7% of total
Strict
1 listings
6.7% of total
Cancellation Policy Insights for New Galloway
- The prevailing Airbnb cancellation policy trend in New Galloway is Flexible, used by 33.3% of listings.
- There's a relatively balanced mix between guest-friendly (53.3%) and stricter (33.4%) policies, offering choices for different guest needs.
- Strict cancellation policies are quite rare (6.7%), potentially making listings with this policy less competitive unless justified by high demand or property type.
Recommendations for Hosts
- Consider adopting a Flexible policy to align with the 33.3% market standard in New Galloway.
- Using a Strict policy might deter some guests, as only 6.7% of listings use it. Evaluate if potential revenue protection outweighs possible lower booking rates.
- Regularly review your cancellation policy against competitors and market demand shifts in New Galloway.
New Galloway STR Booking Lead Time Analysis (2025)
Average Booking Lead Time by Month
Booking Lead Time Insights for New Galloway
- The overall average booking lead time for vacation rentals in New Galloway is 55 days.
- Guests book furthest in advance for stays during July (average 139 days), likely coinciding with peak travel demand or local events.
- The shortest booking windows occur for stays in March (average 32 days), indicating more last-minute travel plans during this time.
- Seasonally, Summer (95 days avg.) sees the longest lead times, while Winter (48 days avg.) has the shortest, reflecting typical travel planning cycles.
Recommendations for Hosts
- Use the overall average lead time (55 days) as a baseline for your pricing and availability strategy in New Galloway.
- For July stays, consider implementing length-of-stay discounts or slightly higher rates for bookings made less than 139 days out to capitalize on advance planning.
- Target marketing efforts for the Summer season well in advance (at least 95 days) to capture early planners.
- Monitor your own booking lead times against these New Galloway averages to identify opportunities for dynamic pricing adjustments.
Popular & Essential Airbnb Amenities in New Galloway (2025)
Amenity Prevalence
Amenity Insights for New Galloway
- Popular amenities like Bed linens, Smoke alarm, Kitchen are common but not universal. Offering these can provide a competitive edge.
- Warning: Wifi is not universally provided but is considered essential globally. Ensure reliable Wifi is offered.
Recommendations for Hosts
- Consider adding popular differentiators like Bed linens or Smoke alarm to increase appeal.
- Highlight unique or less common amenities you offer (e.g., hot tub, dedicated workspace, EV charger) in your listing description and photos.
- Regularly check competitor amenities in New Galloway to stay competitive.
New Galloway Airbnb Guest Demographics & Profile Analysis (2025)
Guest Profile Summary for New Galloway
- The typical guest profile for Airbnb in New Galloway consists of primarily domestic travelers (89%), often arriving from nearby England, typically belonging to the Post-2000s (Gen Z/Alpha) group (50%), primarily speaking English or German.
- Domestic travelers account for 89.4% of guests.
- Key international markets include United Kingdom (89.4%) and Ireland (1.5%).
- Top languages spoken are English (69%) followed by German (8%).
- A significant demographic segment is the Post-2000s (Gen Z/Alpha) group, representing 50% of guests.
Recommendations for Hosts
- Target domestic marketing efforts towards travelers from England and Glasgow.
- Tailor amenities and listing descriptions to appeal to the dominant Post-2000s (Gen Z/Alpha) demographic (e.g., highlight fast WiFi, smart home features, local guides).
- Highlight unique local experiences or amenities relevant to the primary guest profile.
- Consider seasonal promotions aligned with peak travel times for key origin markets.
Nearby Short-Term Rental Market Comparison
How does the New Galloway Airbnb market stack up against its neighbors? Compare key performance metrics like average monthly revenue, ADR, and occupancy rates in surrounding areas to understand the broader regional STR landscape.
| Market | Active Properties | Monthly Revenue | Daily Rate | Avg. Occupancy |
|---|---|---|---|---|
| Galston | 11 | $7,951 | $676.77 | 46% |
| Fearnan | 19 | $6,440 | $421.92 | 53% |
| Gorebridge | 12 | $6,209 | $493.62 | 54% |
| Bridge of Cally | 16 | $5,839 | $566.24 | 50% |
| Glenachulish | 33 | $5,609 | $424.51 | 46% |
| Arrochar | 33 | $5,045 | $339.11 | 56% |
| Acharn | 10 | $4,813 | $278.43 | 57% |
| Croftamie | 19 | $4,609 | $267.39 | 52% |
| Carrick Castle | 11 | $4,591 | $586.01 | 42% |
| Corran | 24 | $4,576 | $370.68 | 45% |