Musselburgh Airbnb Market Analysis 2025: Short Term Rental Data & Vacation Rental Statistics in Scotland, United Kingdom
Is Airbnb profitable in Musselburgh in 2025? Explore comprehensive Airbnb analytics for Musselburgh, Scotland, United Kingdom to uncover income potential. This 2025 STR market report for Musselburgh, based on AirROI data from April 2024 to March 2025, reveals key trends in the niche market of 27 active listings.
Whether you're considering an Airbnb investment in Musselburgh, optimizing your existing vacation rental, or exploring rental arbitrage opportunities, understanding the Musselburgh Airbnb data is crucial. Understanding the local regulations is key to maximizing your short term rental income potential. Let's dive into the specifics.
Key Musselburgh Airbnb Performance Metrics Overview
Monthly Airbnb Revenue Variations & Income Potential in Musselburgh (2025)
Understanding the monthly revenue variations for Airbnb listings in Musselburgh is key to maximizing your short term rental income potential. Seasonality significantly impacts earnings. Our analysis, based on data from the past 12 months, shows that the peak revenue month for STRs in Musselburgh is typically July, while February often presents the lowest earnings, highlighting opportunities for strategic pricing adjustments during shoulder and low seasons. Explore the typical Airbnb income in Musselburgh across different performance tiers:
- Best-in-class properties (Top 10%) achieve $6,509+ monthly, often utilizing dynamic pricing and superior guest experiences.
- Strong performing properties (Top 25%) earn $4,225 or more, indicating effective management and desirable locations/amenities.
- Typical properties (Median) generate around $3,036 per month, representing the average market performance.
- Entry-level properties (Bottom 25%) see earnings around $2,180, often with potential for optimization.
Average Monthly Airbnb Earnings Trend in Musselburgh
Musselburgh Airbnb Occupancy Rate Trends (2025)
Maximize your bookings by understanding the Musselburgh STR occupancy trends. Seasonal demand shifts significantly influence how often properties are booked. Typically, Julysees the highest demand (peak season occupancy), while January experiences the lowest (low season). Effective strategies, like adjusting minimum stays or offering promotions, can boost occupancy during slower periods. Here's how different property tiers perform in Musselburgh:
- Best-in-class properties (Top 10%) achieve 91%+ occupancy, indicating high desirability and potentially optimized availability.
- Strong performing properties (Top 25%) maintain 85% or higher occupancy, suggesting good market fit and guest satisfaction.
- Typical properties (Median) have an occupancy rate around 67%.
- Entry-level properties (Bottom 25%) average 44% occupancy, potentially facing higher vacancy.
Average Monthly Occupancy Rate Trend in Musselburgh
Average Daily Rate (ADR) Airbnb Trends in Musselburgh (2025)
Effective short term rental pricing strategy in Musselburgh involves understanding monthly ADR fluctuations. The Average Daily Rate (ADR) for Airbnb in Musselburgh typically peaks in August and dips lowest during April. Leveraging Airbnb dynamic pricing tools or strategies based on this seasonality can significantly boost revenue. Here's a look at the typical nightly rates achieved:
- Best-in-class properties (Top 10%) command rates of $450+ per night, often due to premium features or locations.
- Strong performing properties (Top 25%) achieve nightly rates of $215 or more.
- Typical properties (Median) charge around $138 per night.
- Entry-level properties (Bottom 25%) earn around $94 per night.
Average Daily Rate (ADR) Trend by Month in Musselburgh
Get Live Musselburgh Market Intelligence 👇

Explore Real-time Analytics
Airbnb Seasonality Analysis & Trends in Musselburgh (2025)
Peak Season (July, August, June)
- Revenue averages $4,993 per month
- Occupancy rates average 74.9%
- Daily rates average $209
Shoulder Season
- Revenue averages $3,471 per month
- Occupancy maintains around 64.2%
- Daily rates hold near $195
Low Season (January, February, March)
- Revenue drops to average $2,147 per month
- Occupancy decreases to average 51.3%
- Daily rates adjust to average $201
Seasonality Insights for Musselburgh
- The Airbnb seasonality in Musselburgh shows highly seasonal trends requiring careful strategy. While the sections above show seasonal averages, it's also insightful to look at the extremes:
- During the high season, the absolute peak month showcases Musselburgh's highest earning potential, with monthly revenues capable of climbing to $5,725, occupancy reaching a high of 80.1%, and ADRs peaking at $215.
- Conversely, the slowest single month of the year, typically falling within the low season, marks the market's lowest point. In this month, revenue might dip to $1,664, occupancy could drop to 47.0%, and ADRs may adjust down to $186.
- Understanding both the seasonal averages and these monthly peaks and troughs in revenue, occupancy, and ADR is crucial for maximizing your Airbnb profit potential in Musselburgh.
Seasonal Strategies for Maximizing Profit
- Peak Season: Maximize revenue through premium pricing and potentially longer minimum stays. Ensure high availability.
- Low Season: Offer competitive pricing, special promotions (e.g., extended stay discounts), and flexible cancellation policies. Target off-season travelers like remote workers or budget-conscious guests.
- Shoulder Seasons: Implement dynamic pricing that balances peak and low rates. Target weekend travelers or specific events. Offer slightly more flexible terms than peak season.
- Regularly analyze your own performance against these Musselburgh seasonality benchmarks and adjust your pricing and availability strategy accordingly.
Best Areas for Airbnb Investment in Musselburgh (2025)
Exploring the top neighborhoods for short-term rentals in Musselburgh? This section highlights key areas, outlining why they are attractive for hosts and guests, along with notable local attractions. Consider these locations based on your target guest profile and investment strategy.
| Neighborhood / Area | Why Host Here? (Target Guests & Appeal) | Key Attractions & Landmarks |
|---|---|---|
| Musselburgh High Street | The bustling heart of Musselburgh, filled with shops, cafes, and local eateries. A popular choice for tourists looking to experience local life and culture, while being close to transport links. | Musselburgh Museum, Local shops and boutiques, Cafes and restaurants, Bus and train connections |
| Musselburgh Harbour | A picturesque harbour area perfect for visitors seeking scenic views and walking paths along the coast. Attracts guests interested in waterfront activities and local seafood restaurants. | Musselburgh Marina, Fisherrow Beach, Restaurants with views, Scenic walks along the shoreline |
| Newhailes Estate | A beautiful historic estate with gardens and parkland, ideal for visitors interested in history and outdoor activities. Family-friendly with plenty of space for outdoor enjoyment. | Newhailes House, Gardens and parkland, Walking trails, Historical tours |
| Levenhall Links | A natural coastal area popular for golfing and beach activities. Appeals to sports enthusiasts and families looking for a beach experience close to Musselburgh. | Levenhall Links Golf Course, Beach activities, Walking trails, Scenic views |
| Carberry Tower | A stunning historic tower and hotel offering a unique stay with beautiful grounds. Attracts couples and guests looking for a romantic getaway or a wedding venue. | Carberry Tower, Historic architecture, Gardens, Scenic countryside |
| Pinkie Farm | A rural area on the outskirts of Musselburgh, offering a peaceful retreat for guests who wish to stay away from the hustle and bustle of the city. | Countryside views, Walking paths, Local wildlife, Quiet surroundings |
| Boroughmuir Road | A residential area with a local vibe, popular with families and visitors looking for a genuine community experience. | Local parks, Community events, Playgrounds, Nearby amenities |
| Elphinstone | A quaint village nearby that provides a quiet and charming stay while being just a short distance from the historical sites of Musselburgh. | Local history, Scenic countryside, Small village charm, Access to transport links |
Understanding Airbnb License Requirements & STR Laws in Musselburgh (2025)
With 15% of listings showing registration in 2025, understanding potential Airbnb license requirements is crucial in Musselburgh. Always verify the latest short term rental regulations and Airbnb license requirements directly with local government authorities for Musselburgh to ensure full compliance before hosting.
(Source: AirROI data, 2025, based on 15% licensed listings)
Top Performing Airbnb Properties in Musselburgh (2025)
Benchmark your potential! Explore examples of top-performing Airbnb properties in Musselburghbased on Trailing Twelve Month (TTM) revenue. Analyze their characteristics, revenue, occupancy rate, and ADR to understand what drives success in this market.
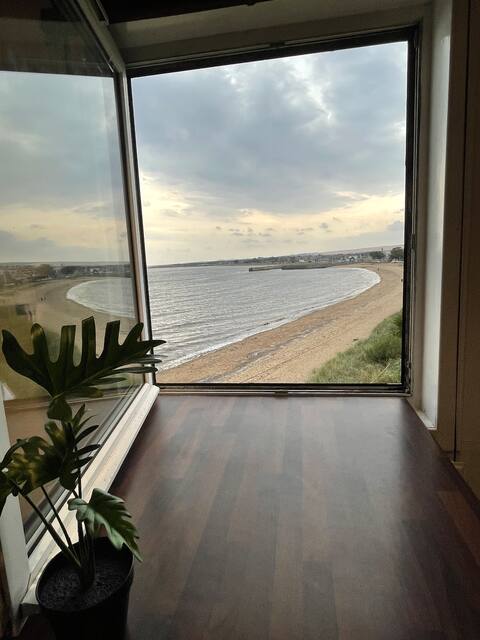
Stunning 3 bed seaview apartment
Entire Place • 3 bedrooms
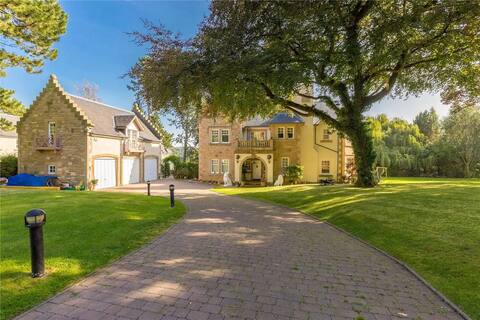
Superb Dream 7 bed Mansion Near Edinburgh
Entire Place • 5 bedrooms
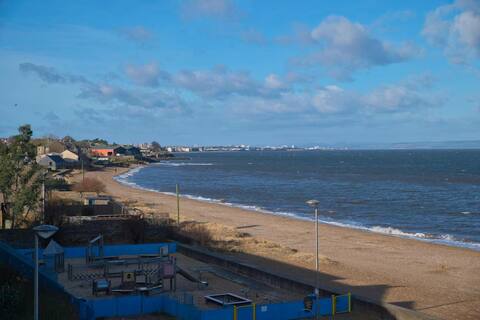
Beachfront Treasure
Entire Place • 3 bedrooms
Modern apt, amazing Harbour views, wifi & Parking
Entire Place • 2 bedrooms

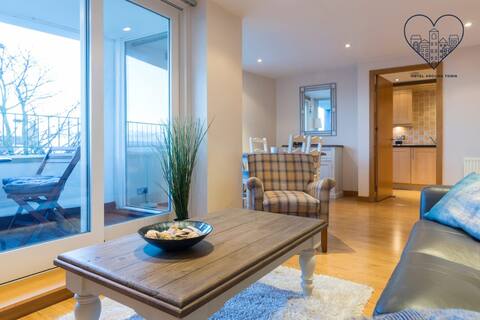
Boutique flat by the sea close to Edinburgh
Entire Place • 1 bedroom
Beach Front Apartment, Stunning Views!
Entire Place • 2 bedrooms
Note: Performance varies based on location, size, amenities, seasonality, and management quality. Data reflects the past 12 months.
Top Performing Airbnb Hosts in Musselburgh (2025)
Learn from the best! This table showcases top-performing Airbnb hosts in Musselburgh based on the number of properties managed and estimated total revenue over the past year. Analyze their scale and performance metrics.
| Host Name | Properties | Grossing Revenue | Stay Reviews | Avg Rating |
|---|---|---|---|---|
| Ruth | 1 | $100,286 | 39 | 4.85/5.0 |
| Craig | 2 | $65,935 | 374 | 4.83/5.0 |
| Maricel | 2 | $65,124 | 214 | 4.84/5.0 |
| Host #343580852 | 1 | $58,272 | 10 | 3.90/5.0 |
| Host #264449323 | 1 | $56,575 | 81 | 4.53/5.0 |
| Rebecca | 1 | $47,084 | 262 | 4.85/5.0 |
| Joe | 1 | $46,081 | 12 | 4.92/5.0 |
| Peter | 1 | $41,453 | 178 | 4.87/5.0 |
| Dawn | 1 | $41,431 | 63 | 4.94/5.0 |
| Nick | 1 | $38,150 | 208 | 4.75/5.0 |
Analyzing the strategies of top hosts, such as their property selection, pricing, and guest communication, can offer valuable lessons for optimizing your own Airbnb operations in Musselburgh.
Dive Deeper: Advanced Musselburgh STR Market Data (2025)
Ready to unlock more insights? AirROI provides access to advanced metrics and comprehensive Airbnb data for Musselburgh. Explore detailed analytics beyond this report to refine your investment strategy, optimize pricing, and maximize your vacation rental profits.
Explore Advanced MetricsMusselburgh Short-Term Rental Market Composition (2025): Property & Room Types
Room Type Distribution
Property Type Distribution
Market Composition Insights for Musselburgh
- The Musselburgh Airbnb market composition is heavily skewed towards Entire Home/Apt listings, which make up 85.2% of the 27 active rentals. This indicates strong guest preference for privacy and space.
- Looking at the property type distribution in Musselburgh, Apartment/Condo properties are the most common (66.7%), reflecting the local real estate landscape.
- Houses represent a significant 29.6% portion, catering likely to families or larger groups.
- Smaller segments like others (combined 3.7%) offer potential for unique stay experiences.
Musselburgh Airbnb Room Capacity Analysis (2025): Bedroom Distribution
Distribution of Listings by Number of Bedrooms
Room Capacity Insights for Musselburgh
- The dominant room capacity in Musselburgh is 2 bedrooms listings, making up 44.4% of the market. This suggests a strong demand for properties suitable for couples or solo travelers.
- Together, 2 bedrooms and 1 bedroom properties represent 70.3% of the active Airbnb listings in Musselburgh, indicating a high concentration in these sizes.
Musselburgh Vacation Rental Guest Capacity Trends (2025)
Distribution of Listings by Guest Capacity
Guest Capacity Insights for Musselburgh
- The most common guest capacity trend in Musselburgh vacation rentals is listings accommodating 4 guests (48.1%). This suggests the primary traveler segment is likely small families or groups.
- Properties designed for 4 guests and 2 guests dominate the Musselburgh STR market, accounting for 62.9% of listings.
- 14.8% of properties accommodate 6+ guests, serving the market segment for larger families or group travel in Musselburgh.
- On average, properties in Musselburgh are equipped to host 3.7 guests.
Musselburgh Airbnb Booking Patterns (2025): Available vs. Booked Days
Available Days Distribution
Booked Days Distribution
Booking Pattern Insights for Musselburgh
- The most common availability pattern in Musselburgh falls within the 91-180 days range, representing 33.3% of listings. This suggests many properties have significant open periods on their calendars.
- Approximately 48.1% of listings show high availability (181+ days open annually), indicating potential for increased bookings or specific owner usage patterns.
- For booked days, the 91-180 days range is most frequent in Musselburgh (33.3%), reflecting common guest stay durations or potential owner blocking patterns.
- A notable 55.5% of properties secure long booking periods (181+ days booked per year), highlighting successful long-term rental strategies or significant owner usage.
Musselburgh Airbnb Minimum Stay Requirements Analysis
Distribution of Listings by Minimum Night Requirement
2 Nights
11 listings
50% of total
3 Nights
3 listings
13.6% of total
4-6 Nights
3 listings
13.6% of total
30+ Nights
5 listings
22.7% of total
Key Insights
- The most prevalent minimum stay requirement in Musselburgh is 2 Nights, adopted by 50% of listings. This highlights the market's preference for shorter, flexible bookings.
- A significant segment (22.7%) caters to monthly stays (30+ nights) in Musselburgh, pointing to opportunities in the extended-stay market.
Recommendations
- Align with the market by considering a 2 Nights minimum stay, as 50% of Musselburgh hosts use this setting.
- A 2-night minimum appears standard (50%). Consider this for weekends or peak periods.
- Explore offering discounts for stays of 30+ nights to attract the 22.7% of the market seeking extended stays.
- Adjust minimum nights based on seasonality – potentially shorter during low season and longer during peak demand periods in Musselburgh.
Musselburgh Airbnb Cancellation Policy Trends Analysis (2025)
Super Strict 30 Days
1 listings
4.5% of total
Flexible
3 listings
13.6% of total
Moderate
5 listings
22.7% of total
Firm
6 listings
27.3% of total
Strict
7 listings
31.8% of total
Cancellation Policy Insights for Musselburgh
- The prevailing Airbnb cancellation policy trend in Musselburgh is Strict, used by 31.8% of listings.
- A majority (59.1%) of hosts in Musselburgh utilize Firm or Strict policies, indicating a market where hosts prioritize booking security.
Recommendations for Hosts
- Consider adopting a Strict policy to align with the 31.8% market standard in Musselburgh.
- With 31.8% using Strict terms, this is a viable option in Musselburgh, particularly for high-value properties or during peak demand periods.
- Regularly review your cancellation policy against competitors and market demand shifts in Musselburgh.
Musselburgh STR Booking Lead Time Analysis (2025)
Average Booking Lead Time by Month
Booking Lead Time Insights for Musselburgh
- The overall average booking lead time for vacation rentals in Musselburgh is 63 days.
- Guests book furthest in advance for stays during July (average 110 days), likely coinciding with peak travel demand or local events.
- The shortest booking windows occur for stays in February (average 40 days), indicating more last-minute travel plans during this time.
- Seasonally, Summer (96 days avg.) sees the longest lead times, while Fall (52 days avg.) has the shortest, reflecting typical travel planning cycles.
Recommendations for Hosts
- Use the overall average lead time (63 days) as a baseline for your pricing and availability strategy in Musselburgh.
- For July stays, consider implementing length-of-stay discounts or slightly higher rates for bookings made less than 110 days out to capitalize on advance planning.
- Target marketing efforts for the Summer season well in advance (at least 96 days) to capture early planners.
- Monitor your own booking lead times against these Musselburgh averages to identify opportunities for dynamic pricing adjustments.
Popular & Essential Airbnb Amenities in Musselburgh (2025)
Amenity Prevalence
Amenity Insights for Musselburgh
- Essential amenities in Musselburgh that guests expect include: Carbon monoxide alarm, Washer, Wifi, Smoke alarm, Kitchen, Heating, Essentials, Hot water. Lacking these (any) could significantly impact bookings.
- Popular amenities like Hangers, TV are common but not universal. Offering these can provide a competitive edge.
Recommendations for Hosts
- Ensure your listing includes all essential amenities for Musselburgh: Carbon monoxide alarm, Washer, Wifi, Smoke alarm, Kitchen, Heating, Essentials, Hot water.
- Prioritize adding missing essentials: Essentials, Hot water.
- Consider adding popular differentiators like Hangers or TV to increase appeal.
- Highlight unique or less common amenities you offer (e.g., hot tub, dedicated workspace, EV charger) in your listing description and photos.
- Regularly check competitor amenities in Musselburgh to stay competitive.
Musselburgh Airbnb Guest Demographics & Profile Analysis (2025)
Guest Profile Summary for Musselburgh
- The typical guest profile for Airbnb in Musselburgh consists of a mix of domestic (55%) and international guests, often arriving from nearby England, typically belonging to the Post-2000s (Gen Z/Alpha) group (50%), primarily speaking English or Spanish.
- Domestic travelers account for 55.3% of guests.
- Key international markets include United Kingdom (55.3%) and United States (10.6%).
- Top languages spoken are English (53.6%) followed by Spanish (8.5%).
- A significant demographic segment is the Post-2000s (Gen Z/Alpha) group, representing 50% of guests.
Recommendations for Hosts
- Balance marketing efforts between domestic and international channels based on the guest mix.
- Tailor amenities and listing descriptions to appeal to the dominant Post-2000s (Gen Z/Alpha) demographic (e.g., highlight fast WiFi, smart home features, local guides).
- Highlight unique local experiences or amenities relevant to the primary guest profile.
- Consider seasonal promotions aligned with peak travel times for key origin markets.
Nearby Short-Term Rental Market Comparison
How does the Musselburgh Airbnb market stack up against its neighbors? Compare key performance metrics like average monthly revenue, ADR, and occupancy rates in surrounding areas to understand the broader regional STR landscape.
| Market | Active Properties | Monthly Revenue | Daily Rate | Avg. Occupancy |
|---|---|---|---|---|
| Galston | 11 | $7,951 | $676.77 | 46% |
| Fearnan | 19 | $6,440 | $421.92 | 53% |
| Gorebridge | 12 | $6,209 | $493.62 | 54% |
| Bridge of Cally | 16 | $5,839 | $566.24 | 50% |
| Arrochar | 33 | $5,045 | $339.11 | 56% |
| Acharn | 10 | $4,813 | $278.43 | 57% |
| Cartmel Fell | 17 | $4,719 | $331.68 | 52% |
| Croftamie | 19 | $4,609 | $267.39 | 52% |
| Carrick Castle | 11 | $4,591 | $586.01 | 42% |
| Casterton | 11 | $4,578 | $300.82 | 51% |