Moscow Airbnb Market Analysis 2025: Short Term Rental Data & Vacation Rental Statistics in Scotland, United Kingdom
Is Airbnb profitable in Moscow in 2025? Explore comprehensive Airbnb analytics for Moscow, Scotland, United Kingdom to uncover income potential. This 2025 STR market report for Moscow, based on AirROI data from April 2024 to March 2025, reveals key trends in the niche market of 20 active listings.
Whether you're considering an Airbnb investment in Moscow, optimizing your existing vacation rental, or exploring rental arbitrage opportunities, understanding the Moscow Airbnb data is crucial. Navigating the high regulation landscape is key to maximizing your short term rental income potential. Let's dive into the specifics.
Key Moscow Airbnb Performance Metrics Overview
Monthly Airbnb Revenue Variations & Income Potential in Moscow (2025)
Understanding the monthly revenue variations for Airbnb listings in Moscow is key to maximizing your short term rental income potential. Seasonality significantly impacts earnings. Our analysis, based on data from the past 12 months, shows that the peak revenue month for STRs in Moscow is typically July, while January often presents the lowest earnings, highlighting opportunities for strategic pricing adjustments during shoulder and low seasons. Explore the typical Airbnb income in Moscow across different performance tiers:
- Best-in-class properties (Top 10%) achieve $5,697+ monthly, often utilizing dynamic pricing and superior guest experiences.
- Strong performing properties (Top 25%) earn $4,627 or more, indicating effective management and desirable locations/amenities.
- Typical properties (Median) generate around $3,480 per month, representing the average market performance.
- Entry-level properties (Bottom 25%) see earnings around $2,048, often with potential for optimization.
Average Monthly Airbnb Earnings Trend in Moscow
Moscow Airbnb Occupancy Rate Trends (2025)
Maximize your bookings by understanding the Moscow STR occupancy trends. Seasonal demand shifts significantly influence how often properties are booked. Typically, Julysees the highest demand (peak season occupancy), while January experiences the lowest (low season). Effective strategies, like adjusting minimum stays or offering promotions, can boost occupancy during slower periods. Here's how different property tiers perform in Moscow:
- Best-in-class properties (Top 10%) achieve 65%+ occupancy, indicating high desirability and potentially optimized availability.
- Strong performing properties (Top 25%) maintain 51% or higher occupancy, suggesting good market fit and guest satisfaction.
- Typical properties (Median) have an occupancy rate around 37%.
- Entry-level properties (Bottom 25%) average 20% occupancy, potentially facing higher vacancy.
Average Monthly Occupancy Rate Trend in Moscow
Average Daily Rate (ADR) Airbnb Trends in Moscow (2025)
Effective short term rental pricing strategy in Moscow involves understanding monthly ADR fluctuations. The Average Daily Rate (ADR) for Airbnb in Moscow typically peaks in July and dips lowest during September. Leveraging Airbnb dynamic pricing tools or strategies based on this seasonality can significantly boost revenue. Here's a look at the typical nightly rates achieved:
- Best-in-class properties (Top 10%) command rates of $372+ per night, often due to premium features or locations.
- Strong performing properties (Top 25%) achieve nightly rates of $356 or more.
- Typical properties (Median) charge around $305 per night.
- Entry-level properties (Bottom 25%) earn around $278 per night.
Average Daily Rate (ADR) Trend by Month in Moscow
Get Live Moscow Market Intelligence 👇

Explore Real-time Analytics
Airbnb Seasonality Analysis & Trends in Moscow (2025)
Peak Season (July, June, August)
- Revenue averages $4,546 per month
- Occupancy rates average 46.1%
- Daily rates average $328
Shoulder Season
- Revenue averages $3,438 per month
- Occupancy maintains around 37.7%
- Daily rates hold near $319
Low Season (January, February, November)
- Revenue drops to average $2,532 per month
- Occupancy decreases to average 27.9%
- Daily rates adjust to average $317
Seasonality Insights for Moscow
- The Airbnb seasonality in Moscow shows highly seasonal trends requiring careful strategy. While the sections above show seasonal averages, it's also insightful to look at the extremes:
- During the high season, the absolute peak month showcases Moscow's highest earning potential, with monthly revenues capable of climbing to $5,207, occupancy reaching a high of 47.3%, and ADRs peaking at $345.
- Conversely, the slowest single month of the year, typically falling within the low season, marks the market's lowest point. In this month, revenue might dip to $2,357, occupancy could drop to 24.9%, and ADRs may adjust down to $314.
- Understanding both the seasonal averages and these monthly peaks and troughs in revenue, occupancy, and ADR is crucial for maximizing your Airbnb profit potential in Moscow.
Seasonal Strategies for Maximizing Profit
- Peak Season: Maximize revenue through premium pricing and potentially longer minimum stays. Ensure high availability.
- Low Season: Offer competitive pricing, special promotions (e.g., extended stay discounts), and flexible cancellation policies. Target off-season travelers like remote workers or budget-conscious guests.
- Shoulder Seasons: Implement dynamic pricing that balances peak and low rates. Target weekend travelers or specific events. Offer slightly more flexible terms than peak season.
- Regularly analyze your own performance against these Moscow seasonality benchmarks and adjust your pricing and availability strategy accordingly.
Best Areas for Airbnb Investment in Moscow (2025)
Exploring the top neighborhoods for short-term rentals in Moscow? This section highlights key areas, outlining why they are attractive for hosts and guests, along with notable local attractions. Consider these locations based on your target guest profile and investment strategy.
| Neighborhood / Area | Why Host Here? (Target Guests & Appeal) | Key Attractions & Landmarks |
|---|---|---|
| Arbat | Famous pedestrian street lined with shops, restaurants, and cultural sites. It's a hub for tourists seeking a lively atmosphere and proximity to attractions like the Kremlin and Red Square. | St. Vasily's Cathedral, Kremlin, State Historical Museum, Novy Arbat Street, Pushkin State Museum of Fine Arts |
| Kremlin District | The heart of Moscow, home to the Kremlin, Red Square, and significant historical landmarks. Ideal for travelers wanting to stay near the city's most famous sites. | Red Square, St. Basil's Cathedral, GUM, Bolshoi Theatre, Kremlin |
| Tverskaya Street | Major thoroughfare known for its shopping, dining, and entertainment options. Offers a central location for both business and leisure travelers in Moscow. | Bolshoi Theatre, Moscow City Hall, Russian State Library, Various shops and cafés, Pushkin Square |
| Zamoskvorechye | Historic district with charming architecture and a relaxed vibe, located near the river. Attracts visitors looking for a quieter experience while still being close to major attractions. | Tretyakov Gallery, Christ the Savior Cathedral, Gorky Park, Andronikov Monastery |
| Khamovniki | Trendy area known for its mix of leisure and culture with parks and museums. Great for families and travelers interested in the local lifestyle. | Gorky Park, Museum of Modern Art, Victory Park, New Tretyakov Gallery |
| Kitai-Gorod | Historic area of Moscow located near many landmarks, offering a unique blend of culture and modernity. Attractive to history enthusiasts and urban explorers. | Christ the Savior Cathedral, Street art, Varvarka Street, Topographical Map of Moscow |
| Moscow City | Modern business district featuring stunning skyscrapers. Ideal for business travelers and those seeking a contemporary urban experience. | Federation Towers, Vostok Tower, Skyscraper views, Various international restaurants |
| Sokolniki | Known for its large park, Sokolniki is perfect for outdoor lovers and families. Offers a different, more suburban feel within the metropolitan area. | Sokolniki Park, Sokolniki Exhibition and Convention Centre, Ice cream and café spots in the park |
Understanding Airbnb License Requirements & STR Laws in Moscow (2025)
Yes, Moscow, Scotland, United Kingdom enforces high STR regulations. Obtaining a license and ensuring compliance is almost certainly required according to current 2025 STR laws. Always verify the latest short term rental regulations and Airbnb license requirements directly with local government authorities for Moscow to ensure full compliance before hosting.
(Source: AirROI data, 2025, based on 65% licensed listings)
Top Performing Airbnb Properties in Moscow (2025)
Benchmark your potential! Explore examples of top-performing Airbnb properties in Moscowbased on Trailing Twelve Month (TTM) revenue. Analyze their characteristics, revenue, occupancy rate, and ADR to understand what drives success in this market.
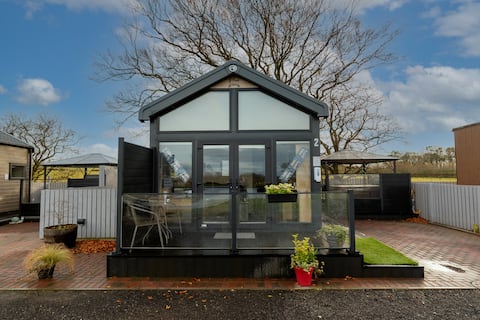
Pod 2-Luxury Lakeside Glamping Pod With Hot Tub.
Entire Place • 1 bedroom

Pod 1-Luxury Lakeside Glamping Pod With Hot Tub.
Entire Place • 1 bedroom
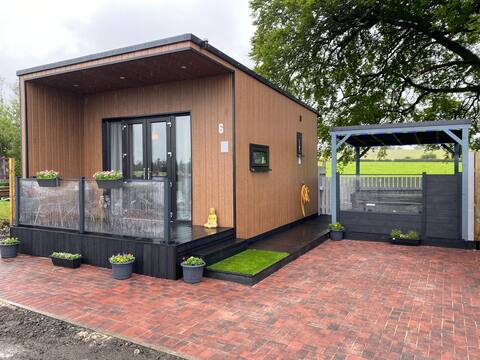
Pod 6-Luxury Lakeside Glamping Pod With Hot Tub.
Entire Place • 1 bedroom

Lakeside Luxury Lodge 11 with Hot Tub
Entire Place • 2 bedrooms
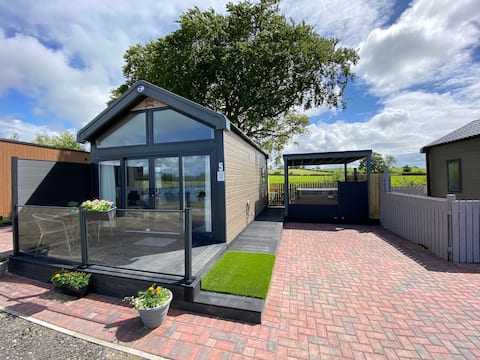
Pod 5-Luxury Lakeside Glamping Pod With Hot Tub.
Entire Place • 1 bedroom

Lakeside Luxury Lodge 7 with Hot Tub
Entire Place • 2 bedrooms
Note: Performance varies based on location, size, amenities, seasonality, and management quality. Data reflects the past 12 months.
Top Performing Airbnb Hosts in Moscow (2025)
Learn from the best! This table showcases top-performing Airbnb hosts in Moscow based on the number of properties managed and estimated total revenue over the past year. Analyze their scale and performance metrics.
| Host Name | Properties | Grossing Revenue | Stay Reviews | Avg Rating |
|---|---|---|---|---|
| Graham | 19 | $687,955 | 1162 | 3.39/5.0 |
| Host #187608057 | 1 | $21,953 | 39 | 5.00/5.0 |
Analyzing the strategies of top hosts, such as their property selection, pricing, and guest communication, can offer valuable lessons for optimizing your own Airbnb operations in Moscow.
Dive Deeper: Advanced Moscow STR Market Data (2025)
Ready to unlock more insights? AirROI provides access to advanced metrics and comprehensive Airbnb data for Moscow. Explore detailed analytics beyond this report to refine your investment strategy, optimize pricing, and maximize your vacation rental profits.
Explore Advanced MetricsMoscow Short-Term Rental Market Composition (2025): Property & Room Types
Room Type Distribution
Property Type Distribution
Market Composition Insights for Moscow
- The Moscow Airbnb market composition is heavily skewed towards Entire Home/Apt listings, which make up 100% of the 20 active rentals. This indicates strong guest preference for privacy and space.
- Looking at the property type distribution in Moscow, Outdoor/Unique properties are the most common (60%), reflecting the local real estate landscape.
- Houses represent a significant 35% portion, catering likely to families or larger groups.
Moscow Airbnb Room Capacity Analysis (2025): Bedroom Distribution
Distribution of Listings by Number of Bedrooms
Room Capacity Insights for Moscow
- The dominant room capacity in Moscow is 2 bedrooms listings, making up 65% of the market. This suggests a strong demand for properties suitable for couples or solo travelers.
- Together, 2 bedrooms and 1 bedroom properties represent 95.0% of the active Airbnb listings in Moscow, indicating a high concentration in these sizes.
- Listings with 3+ bedrooms (5.0%) represent a smaller niche, potentially indicating an underserved market for larger group accommodations in Moscow.
Moscow Vacation Rental Guest Capacity Trends (2025)
Distribution of Listings by Guest Capacity
Guest Capacity Insights for Moscow
- The most common guest capacity trend in Moscow vacation rentals is listings accommodating 4 guests (90%). This suggests the primary traveler segment is likely small families or groups.
- Properties designed for 4 guests and 2 guests dominate the Moscow STR market, accounting for 95.0% of listings.
- On average, properties in Moscow are equipped to host 4.0 guests.
Moscow Airbnb Booking Patterns (2025): Available vs. Booked Days
Available Days Distribution
Booked Days Distribution
Booking Pattern Insights for Moscow
- The most common availability pattern in Moscow falls within the 271-366 days range, representing 45% of listings. This suggests many properties have significant open periods on their calendars.
- Approximately 85.0% of listings show high availability (181+ days open annually), indicating potential for increased bookings or specific owner usage patterns.
- For booked days, the 31-90 days range is most frequent in Moscow (45%), reflecting common guest stay durations or potential owner blocking patterns.
- A notable 15.0% of properties secure long booking periods (181+ days booked per year), highlighting successful long-term rental strategies or significant owner usage.
Moscow Airbnb Minimum Stay Requirements Analysis
Distribution of Listings by Minimum Night Requirement
1 Night
13 listings
68.4% of total
2 Nights
6 listings
31.6% of total
Key Insights
- The most prevalent minimum stay requirement in Moscow is 1 Night, adopted by 68.4% of listings. This highlights the market's preference for shorter, flexible bookings.
- A strong majority (100.0%) of the Moscow Airbnb data shows acceptance of very short stays (1-2 nights), indicating a dynamic, high-turnover market.
Recommendations
- Align with the market by considering a 1 Night minimum stay, as 68.4% of Moscow hosts use this setting.
- Adjust minimum nights based on seasonality – potentially shorter during low season and longer during peak demand periods in Moscow.
Moscow Airbnb Cancellation Policy Trends Analysis (2025)
Moderate
1 listings
7.1% of total
Strict
13 listings
92.9% of total
Cancellation Policy Insights for Moscow
- The prevailing Airbnb cancellation policy trend in Moscow is Strict, used by 92.9% of listings.
- A majority (92.9%) of hosts in Moscow utilize Firm or Strict policies, indicating a market where hosts prioritize booking security.
Recommendations for Hosts
- Consider adopting a Strict policy to align with the 92.9% market standard in Moscow.
- With 92.9% using Strict terms, this is a viable option in Moscow, particularly for high-value properties or during peak demand periods.
- Regularly review your cancellation policy against competitors and market demand shifts in Moscow.
Moscow STR Booking Lead Time Analysis (2025)
Average Booking Lead Time by Month
Booking Lead Time Insights for Moscow
- The overall average booking lead time for vacation rentals in Moscow is 38 days.
- Guests book furthest in advance for stays during July (average 114 days), likely coinciding with peak travel demand or local events.
- The shortest booking windows occur for stays in March (average 21 days), indicating more last-minute travel plans during this time.
- Seasonally, Summer (65 days avg.) sees the longest lead times, while Fall (26 days avg.) has the shortest, reflecting typical travel planning cycles.
Recommendations for Hosts
- Use the overall average lead time (38 days) as a baseline for your pricing and availability strategy in Moscow.
- For July stays, consider implementing length-of-stay discounts or slightly higher rates for bookings made less than 114 days out to capitalize on advance planning.
- Target marketing efforts for the Summer season well in advance (at least 65 days) to capture early planners.
- Monitor your own booking lead times against these Moscow averages to identify opportunities for dynamic pricing adjustments.
Popular & Essential Airbnb Amenities in Moscow (2025)
Amenity Prevalence
No amenities with partial availability (less than 100%) were found to display in the chart. All essential amenities might be present in all listings. Check insights below.
Amenity Insights for Moscow
- Essential amenities in Moscow that guests expect include: Fire extinguisher, Free parking on premises, Kitchen, First aid kit, Carbon monoxide alarm, Smoke alarm, Heating, Essentials, Wifi, Hot water. Lacking these (any) could significantly impact bookings.
Recommendations for Hosts
- Ensure your listing includes all essential amenities for Moscow: Fire extinguisher, Free parking on premises, Kitchen, First aid kit, Carbon monoxide alarm, Smoke alarm, Heating, Essentials, Wifi, Hot water.
- Highlight unique or less common amenities you offer (e.g., hot tub, dedicated workspace, EV charger) in your listing description and photos.
- Regularly check competitor amenities in Moscow to stay competitive.
Moscow Airbnb Guest Demographics & Profile Analysis (2025)
Guest Profile Summary for Moscow
- The typical guest profile for Airbnb in Moscow consists of primarily domestic travelers (90%), often arriving from nearby Glasgow, typically belonging to the Post-2000s (Gen Z/Alpha) group (50%), primarily speaking English or Chinese.
- Domestic travelers account for 89.7% of guests.
- Key international markets include United Kingdom (89.7%) and United States (4.4%).
- Top languages spoken are English (87.2%) followed by Chinese (4.3%).
- A significant demographic segment is the Post-2000s (Gen Z/Alpha) group, representing 50% of guests.
Recommendations for Hosts
- Target domestic marketing efforts towards travelers from Glasgow and Scotland.
- Tailor amenities and listing descriptions to appeal to the dominant Post-2000s (Gen Z/Alpha) demographic (e.g., highlight fast WiFi, smart home features, local guides).
- Highlight unique local experiences or amenities relevant to the primary guest profile.
- Consider seasonal promotions aligned with peak travel times for key origin markets.
Nearby Short-Term Rental Market Comparison
How does the Moscow Airbnb market stack up against its neighbors? Compare key performance metrics like average monthly revenue, ADR, and occupancy rates in surrounding areas to understand the broader regional STR landscape.
| Market | Active Properties | Monthly Revenue | Daily Rate | Avg. Occupancy |
|---|---|---|---|---|
| Galston | 11 | $7,951 | $676.77 | 46% |
| Fearnan | 19 | $6,440 | $421.92 | 53% |
| Gorebridge | 12 | $6,209 | $493.62 | 54% |
| Bridge of Cally | 16 | $5,839 | $566.24 | 50% |
| Glenachulish | 33 | $5,609 | $424.51 | 46% |
| Arrochar | 33 | $5,045 | $339.11 | 56% |
| Acharn | 10 | $4,813 | $278.43 | 57% |
| Croftamie | 19 | $4,609 | $267.39 | 52% |
| Carrick Castle | 11 | $4,591 | $586.01 | 42% |
| Corran | 24 | $4,576 | $370.68 | 45% |