Morar Airbnb Market Analysis 2025: Short Term Rental Data & Vacation Rental Statistics in Scotland, United Kingdom
Is Airbnb profitable in Morar in 2025? Explore comprehensive Airbnb analytics for Morar, Scotland, United Kingdom to uncover income potential. This 2025 STR market report for Morar, based on AirROI data from April 2024 to March 2025, reveals key trends in the niche market of 29 active listings.
Whether you're considering an Airbnb investment in Morar, optimizing your existing vacation rental, or exploring rental arbitrage opportunities, understanding the Morar Airbnb data is crucial. Understanding the local regulations is key to maximizing your short term rental income potential. Let's dive into the specifics.
Key Morar Airbnb Performance Metrics Overview
Monthly Airbnb Revenue Variations & Income Potential in Morar (2025)
Understanding the monthly revenue variations for Airbnb listings in Morar is key to maximizing your short term rental income potential. Seasonality significantly impacts earnings. Our analysis, based on data from the past 12 months, shows that the peak revenue month for STRs in Morar is typically August, while November often presents the lowest earnings, highlighting opportunities for strategic pricing adjustments during shoulder and low seasons. Explore the typical Airbnb income in Morar across different performance tiers:
- Best-in-class properties (Top 10%) achieve $4,879+ monthly, often utilizing dynamic pricing and superior guest experiences.
- Strong performing properties (Top 25%) earn $3,535 or more, indicating effective management and desirable locations/amenities.
- Typical properties (Median) generate around $2,164 per month, representing the average market performance.
- Entry-level properties (Bottom 25%) see earnings around $1,468, often with potential for optimization.
Average Monthly Airbnb Earnings Trend in Morar
Morar Airbnb Occupancy Rate Trends (2025)
Maximize your bookings by understanding the Morar STR occupancy trends. Seasonal demand shifts significantly influence how often properties are booked. Typically, Augustsees the highest demand (peak season occupancy), while November experiences the lowest (low season). Effective strategies, like adjusting minimum stays or offering promotions, can boost occupancy during slower periods. Here's how different property tiers perform in Morar:
- Best-in-class properties (Top 10%) achieve 81%+ occupancy, indicating high desirability and potentially optimized availability.
- Strong performing properties (Top 25%) maintain 63% or higher occupancy, suggesting good market fit and guest satisfaction.
- Typical properties (Median) have an occupancy rate around 39%.
- Entry-level properties (Bottom 25%) average 20% occupancy, potentially facing higher vacancy.
Average Monthly Occupancy Rate Trend in Morar
Average Daily Rate (ADR) Airbnb Trends in Morar (2025)
Effective short term rental pricing strategy in Morar involves understanding monthly ADR fluctuations. The Average Daily Rate (ADR) for Airbnb in Morar typically peaks in August and dips lowest during March. Leveraging Airbnb dynamic pricing tools or strategies based on this seasonality can significantly boost revenue. Here's a look at the typical nightly rates achieved:
- Best-in-class properties (Top 10%) command rates of $317+ per night, often due to premium features or locations.
- Strong performing properties (Top 25%) achieve nightly rates of $261 or more.
- Typical properties (Median) charge around $159 per night.
- Entry-level properties (Bottom 25%) earn around $124 per night.
Average Daily Rate (ADR) Trend by Month in Morar
Get Live Morar Market Intelligence 👇

Explore Real-time Analytics
Airbnb Seasonality Analysis & Trends in Morar (2025)
Peak Season (August, June, July)
- Revenue averages $4,104 per month
- Occupancy rates average 61.2%
- Daily rates average $212
Shoulder Season
- Revenue averages $2,450 per month
- Occupancy maintains around 44.0%
- Daily rates hold near $196
Low Season (March, November, December)
- Revenue drops to average $1,366 per month
- Occupancy decreases to average 26.5%
- Daily rates adjust to average $191
Seasonality Insights for Morar
- The Airbnb seasonality in Morar shows highly seasonal trends requiring careful strategy. While the sections above show seasonal averages, it's also insightful to look at the extremes:
- During the high season, the absolute peak month showcases Morar's highest earning potential, with monthly revenues capable of climbing to $4,425, occupancy reaching a high of 67.1%, and ADRs peaking at $215.
- Conversely, the slowest single month of the year, typically falling within the low season, marks the market's lowest point. In this month, revenue might dip to $1,231, occupancy could drop to 23.3%, and ADRs may adjust down to $189.
- Understanding both the seasonal averages and these monthly peaks and troughs in revenue, occupancy, and ADR is crucial for maximizing your Airbnb profit potential in Morar.
Seasonal Strategies for Maximizing Profit
- Peak Season: Maximize revenue through premium pricing and potentially longer minimum stays. Ensure high availability.
- Low Season: Offer competitive pricing, special promotions (e.g., extended stay discounts), and flexible cancellation policies. Target off-season travelers like remote workers or budget-conscious guests.
- Shoulder Seasons: Implement dynamic pricing that balances peak and low rates. Target weekend travelers or specific events. Offer slightly more flexible terms than peak season.
- Regularly analyze your own performance against these Morar seasonality benchmarks and adjust your pricing and availability strategy accordingly.
Best Areas for Airbnb Investment in Morar (2025)
Exploring the top neighborhoods for short-term rentals in Morar? This section highlights key areas, outlining why they are attractive for hosts and guests, along with notable local attractions. Consider these locations based on your target guest profile and investment strategy.
| Neighborhood / Area | Why Host Here? (Target Guests & Appeal) | Key Attractions & Landmarks |
|---|---|---|
| Morar Beach | Stunning sandy beach known for its beauty and scenic views. Ideal for beach lovers and those seeking a tranquil seaside getaway, often attracting families and couples. | Morar Beach, Silver Sands Beach, Morar River, Coastal nature walks, Local wildlife, Fishing spots |
| Arisaig | Picturesque coastal village renowned for its breathtaking landscapes and outdoor activities. Popular with visitors looking for adventure and those interested in island-hopping. | Arisaig Marine, Silver Sands Beach, Camusdarach Beach, Boat trips to Eigg and Rum, Walking trails, Local pubs and restaurants |
| Mallaig | A bustling fishing port that serves as a gateway to the Small Isles. Attracts tourists for its ferry connections and charm, with various attractions and local cuisine. | Mallaig Harbour, Jacobite Steam Train, Fishing trips, Local fish and chips, Mallaig Heritage Centre, Outdoor sports |
| Eigg | An enchanting island known for its natural beauty and unique culture. Perfect for those seeking a secluded escape and adventure in nature. | An Sgurr, Kildonnan Cemetery, Eigg Heritage Trail, Magnificent coastal views, Wildlife watching, Secluded beaches |
| Knoydart | Remote peninsula renowned for its rugged landscape and untouched nature, ideal for hiking and nature enthusiasts. | Ladhar Bheinn mountain, Knoydart Heritage, Distant islands views, Wild camping spots, Remote beaches, Local wildlife |
| Loch Morar | The deepest freshwater loch in Britain, offering scenic beauty and opportunities for fishing and kayaking. Attractive for those wanting a peaceful retreat. | Loch Morar views, Fishing spots, Walking trails around the loch, Wildlife watching, Scenic photography, Water sports |
| Small Isles | A group of islands, including Muck and Eigg, known for their stunning landscapes, wildlife, and tranquility. Great for nature lovers and seekers of isolation. | Island hopping, Wildlife tours, Beautiful beaches, Nature walks, Historic ruins, Secluded landscapes |
| Highland Whisky Trail | While not a neighborhood, its proximity to Morar makes it appealing for whisky enthusiasts looking to experience local distilleries and tours. | Local distilleries, Scenic drives, Whisky tasting experiences, Cultural heritage sites, Beautiful Highland landscapes, Historic castles |
Understanding Airbnb License Requirements & STR Laws in Morar (2025)
With 28% of listings showing registration in 2025, understanding potential Airbnb license requirements is crucial in Morar. Always verify the latest short term rental regulations and Airbnb license requirements directly with local government authorities for Morar to ensure full compliance before hosting.
(Source: AirROI data, 2025, based on 28% licensed listings)
Top Performing Airbnb Properties in Morar (2025)
Benchmark your potential! Explore examples of top-performing Airbnb properties in Morarbased on Trailing Twelve Month (TTM) revenue. Analyze their characteristics, revenue, occupancy rate, and ADR to understand what drives success in this market.
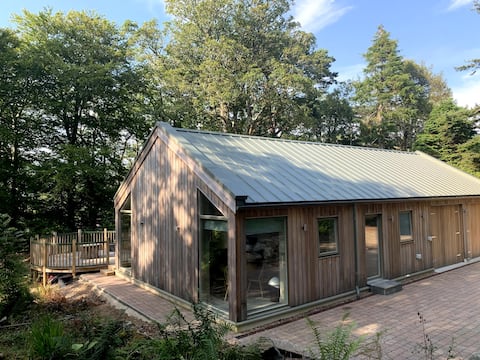
Cosy, modern cottage only a walk from silver sands
Entire Place • 1 bedroom
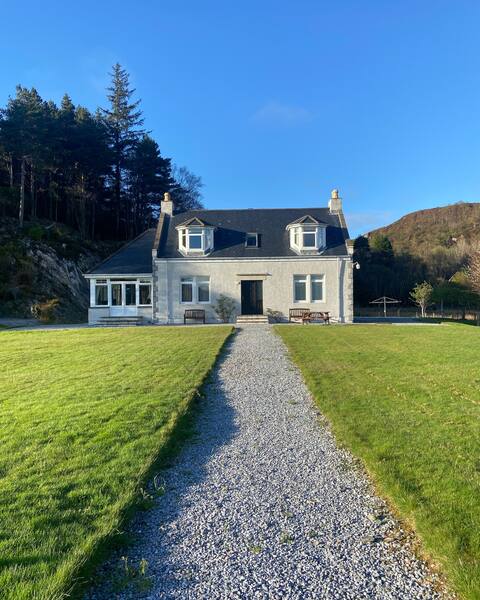
Spacious home in the heart of the highlands
Entire Place • 3 bedrooms
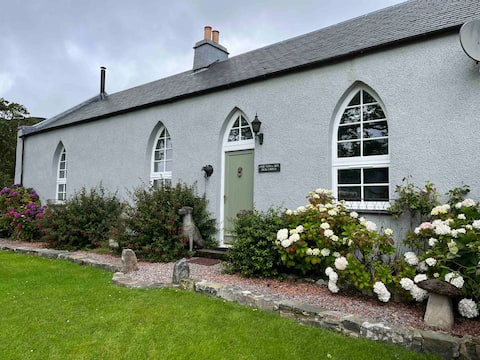
The Old Schoolhouse at Loch Morar
Entire Place • 2 bedrooms
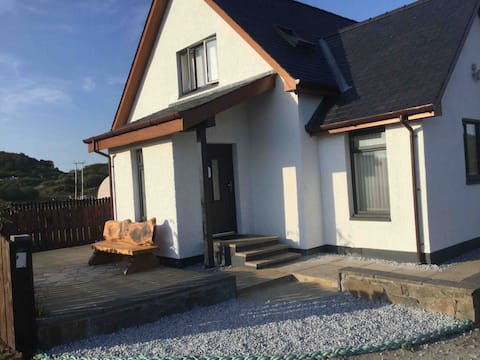
Caorunn Apt self cater-sleeps 4, ensuite bedrooms
Entire Place • 2 bedrooms
Triple room at The Morar Hotel
Private Room • 1 bedroom
Ardmorar Self Catering
Entire Place • 3 bedrooms
Note: Performance varies based on location, size, amenities, seasonality, and management quality. Data reflects the past 12 months.
Top Performing Airbnb Hosts in Morar (2025)
Learn from the best! This table showcases top-performing Airbnb hosts in Morar based on the number of properties managed and estimated total revenue over the past year. Analyze their scale and performance metrics.
| Host Name | Properties | Grossing Revenue | Stay Reviews | Avg Rating |
|---|---|---|---|---|
| Claire | 4 | $95,197 | 830 | 4.90/5.0 |
| Logesvaran | 8 | $94,059 | 17 | 0.84/5.0 |
| Emma | 2 | $78,453 | 116 | 4.98/5.0 |
| Eileen | 1 | $51,199 | 182 | 4.98/5.0 |
| The Maclellan Family | 1 | $50,460 | 30 | 5.00/5.0 |
| Margaret Ann | 3 | $50,377 | 413 | 4.91/5.0 |
| Janet | 2 | $40,372 | 695 | 4.93/5.0 |
| Lorraine | 1 | $39,500 | 120 | 4.93/5.0 |
| Martin | 1 | $38,426 | 59 | 4.95/5.0 |
| Sykes Holiday Cottages Limited | 1 | $35,605 | 4 | 4.75/5.0 |
Analyzing the strategies of top hosts, such as their property selection, pricing, and guest communication, can offer valuable lessons for optimizing your own Airbnb operations in Morar.
Dive Deeper: Advanced Morar STR Market Data (2025)
Ready to unlock more insights? AirROI provides access to advanced metrics and comprehensive Airbnb data for Morar. Explore detailed analytics beyond this report to refine your investment strategy, optimize pricing, and maximize your vacation rental profits.
Explore Advanced MetricsMorar Short-Term Rental Market Composition (2025): Property & Room Types
Room Type Distribution
Property Type Distribution
Market Composition Insights for Morar
- The Morar Airbnb market composition is heavily skewed towards Private Room listings, which make up 55.2% of the 29 active rentals. This indicates strong guest preference for privacy and space.
- Looking at the property type distribution in Morar, House properties are the most common (51.7%), reflecting the local real estate landscape.
- Houses represent a significant 51.7% portion, catering likely to families or larger groups.
- The presence of 44.8% Hotel/Boutique listings indicates integration with traditional hospitality.
- Smaller segments like others (combined 3.4%) offer potential for unique stay experiences.
Morar Airbnb Room Capacity Analysis (2025): Bedroom Distribution
Distribution of Listings by Number of Bedrooms
Room Capacity Insights for Morar
- The dominant room capacity in Morar is 1 bedroom listings, making up 34.5% of the market. This suggests a strong demand for properties suitable for couples or solo travelers.
- Together, 1 bedroom and 3 bedrooms properties represent 55.2% of the active Airbnb listings in Morar, indicating a high concentration in these sizes.
- A significant 20.7% of listings offer 3+ bedrooms, catering to larger groups and families seeking more space in Morar.
Morar Vacation Rental Guest Capacity Trends (2025)
Distribution of Listings by Guest Capacity
Guest Capacity Insights for Morar
- The most common guest capacity trend in Morar vacation rentals is listings accommodating 2 guests (31%). This suggests the primary traveler segment is likely couples or solo travelers.
- Properties designed for 2 guests and 6 guests dominate the Morar STR market, accounting for 44.8% of listings.
- 20.6% of properties accommodate 6+ guests, serving the market segment for larger families or group travel in Morar.
- On average, properties in Morar are equipped to host 2.7 guests.
Morar Airbnb Booking Patterns (2025): Available vs. Booked Days
Available Days Distribution
Booked Days Distribution
Booking Pattern Insights for Morar
- The most common availability pattern in Morar falls within the 181-270 days range, representing 44.8% of listings. This suggests many properties have significant open periods on their calendars.
- Approximately 79.3% of listings show high availability (181+ days open annually), indicating potential for increased bookings or specific owner usage patterns.
- For booked days, the 91-180 days range is most frequent in Morar (41.4%), reflecting common guest stay durations or potential owner blocking patterns.
- A notable 24.1% of properties secure long booking periods (181+ days booked per year), highlighting successful long-term rental strategies or significant owner usage.
Morar Airbnb Minimum Stay Requirements Analysis
Distribution of Listings by Minimum Night Requirement
1 Night
16 listings
59.3% of total
2 Nights
3 listings
11.1% of total
3 Nights
5 listings
18.5% of total
4-6 Nights
2 listings
7.4% of total
7-29 Nights
1 listings
3.7% of total
Key Insights
- The most prevalent minimum stay requirement in Morar is 1 Night, adopted by 59.3% of listings. This highlights the market's preference for shorter, flexible bookings.
- A strong majority (70.4%) of the Morar Airbnb data shows acceptance of very short stays (1-2 nights), indicating a dynamic, high-turnover market.
Recommendations
- Align with the market by considering a 1 Night minimum stay, as 59.3% of Morar hosts use this setting.
- Adjust minimum nights based on seasonality – potentially shorter during low season and longer during peak demand periods in Morar.
Morar Airbnb Cancellation Policy Trends Analysis (2025)
Super Strict 60 Days
1 listings
4.2% of total
Flexible
2 listings
8.3% of total
Moderate
11 listings
45.8% of total
Firm
1 listings
4.2% of total
Strict
9 listings
37.5% of total
Cancellation Policy Insights for Morar
- The prevailing Airbnb cancellation policy trend in Morar is Moderate, used by 45.8% of listings.
- There's a relatively balanced mix between guest-friendly (54.1%) and stricter (41.7%) policies, offering choices for different guest needs.
Recommendations for Hosts
- Consider adopting a Moderate policy to align with the 45.8% market standard in Morar.
- With 37.5% using Strict terms, this is a viable option in Morar, particularly for high-value properties or during peak demand periods.
- Regularly review your cancellation policy against competitors and market demand shifts in Morar.
Morar STR Booking Lead Time Analysis (2025)
Average Booking Lead Time by Month
Booking Lead Time Insights for Morar
- The overall average booking lead time for vacation rentals in Morar is 83 days.
- Guests book furthest in advance for stays during September (average 126 days), likely coinciding with peak travel demand or local events.
- The shortest booking windows occur for stays in December (average 53 days), indicating more last-minute travel plans during this time.
- Seasonally, Summer (106 days avg.) sees the longest lead times, while Winter (64 days avg.) has the shortest, reflecting typical travel planning cycles.
Recommendations for Hosts
- Use the overall average lead time (83 days) as a baseline for your pricing and availability strategy in Morar.
- For September stays, consider implementing length-of-stay discounts or slightly higher rates for bookings made less than 126 days out to capitalize on advance planning.
- Target marketing efforts for the Summer season well in advance (at least 106 days) to capture early planners.
- Monitor your own booking lead times against these Morar averages to identify opportunities for dynamic pricing adjustments.
Popular & Essential Airbnb Amenities in Morar (2025)
Amenity Prevalence
Amenity Insights for Morar
- Essential amenities in Morar that guests expect include: Smoke alarm, Hot water, Free parking on premises, TV, Essentials. Lacking these (any) could significantly impact bookings.
- Popular amenities like Wifi, Heating, Hair dryer are common but not universal. Offering these can provide a competitive edge.
- Warning: Wifi is not universally provided but is considered essential globally. Ensure reliable Wifi is offered.
Recommendations for Hosts
- Ensure your listing includes all essential amenities for Morar: Smoke alarm, Hot water, Free parking on premises, TV, Essentials.
- Prioritize adding missing essentials: Free parking on premises, TV, Essentials.
- Consider adding popular differentiators like Wifi or Heating to increase appeal.
- Highlight unique or less common amenities you offer (e.g., hot tub, dedicated workspace, EV charger) in your listing description and photos.
- Regularly check competitor amenities in Morar to stay competitive.
Morar Airbnb Guest Demographics & Profile Analysis (2025)
Guest Profile Summary for Morar
- The typical guest profile for Airbnb in Morar consists of a mix of domestic (56%) and international guests, often arriving from nearby England, typically belonging to the Post-2000s (Gen Z/Alpha) group (50%), primarily speaking English or German.
- Domestic travelers account for 56.4% of guests.
- Key international markets include United Kingdom (56.4%) and United States (11.2%).
- Top languages spoken are English (53.5%) followed by German (12.3%).
- A significant demographic segment is the Post-2000s (Gen Z/Alpha) group, representing 50% of guests.
Recommendations for Hosts
- Balance marketing efforts between domestic and international channels based on the guest mix.
- Tailor amenities and listing descriptions to appeal to the dominant Post-2000s (Gen Z/Alpha) demographic (e.g., highlight fast WiFi, smart home features, local guides).
- Highlight unique local experiences or amenities relevant to the primary guest profile.
- Consider seasonal promotions aligned with peak travel times for key origin markets.
Nearby Short-Term Rental Market Comparison
How does the Morar Airbnb market stack up against its neighbors? Compare key performance metrics like average monthly revenue, ADR, and occupancy rates in surrounding areas to understand the broader regional STR landscape.
| Market | Active Properties | Monthly Revenue | Daily Rate | Avg. Occupancy |
|---|---|---|---|---|
| Galston | 11 | $7,951 | $676.77 | 46% |
| Fearnan | 19 | $6,440 | $421.92 | 53% |
| Kirkhill | 10 | $5,719 | $700.26 | 44% |
| Glenachulish | 33 | $5,609 | $424.51 | 46% |
| North Kessock | 10 | $5,421 | $380.62 | 58% |
| Carbost | 26 | $5,209 | $324.31 | 62% |
| Foyers | 14 | $5,076 | $274.52 | 64% |
| Arrochar | 33 | $5,045 | $339.11 | 56% |
| Whitebridge | 10 | $4,907 | $417.35 | 42% |
| Port Failthe | 14 | $4,832 | $301.12 | 57% |