Montrose Airbnb Market Analysis 2025: Short Term Rental Data & Vacation Rental Statistics in Scotland, United Kingdom
Is Airbnb profitable in Montrose in 2025? Explore comprehensive Airbnb analytics for Montrose, Scotland, United Kingdom to uncover income potential. This 2025 STR market report for Montrose, based on AirROI data from April 2024 to March 2025, reveals key trends in the niche market of 48 active listings.
Whether you're considering an Airbnb investment in Montrose, optimizing your existing vacation rental, or exploring rental arbitrage opportunities, understanding the Montrose Airbnb data is crucial. Navigating the high regulation landscape is key to maximizing your short term rental income potential. Let's dive into the specifics.
Key Montrose Airbnb Performance Metrics Overview
Monthly Airbnb Revenue Variations & Income Potential in Montrose (2025)
Understanding the monthly revenue variations for Airbnb listings in Montrose is key to maximizing your short term rental income potential. Seasonality significantly impacts earnings. Our analysis, based on data from the past 12 months, shows that the peak revenue month for STRs in Montrose is typically July, while January often presents the lowest earnings, highlighting opportunities for strategic pricing adjustments during shoulder and low seasons. Explore the typical Airbnb income in Montrose across different performance tiers:
- Best-in-class properties (Top 10%) achieve $4,848+ monthly, often utilizing dynamic pricing and superior guest experiences.
- Strong performing properties (Top 25%) earn $2,852 or more, indicating effective management and desirable locations/amenities.
- Typical properties (Median) generate around $1,776 per month, representing the average market performance.
- Entry-level properties (Bottom 25%) see earnings around $830, often with potential for optimization.
Average Monthly Airbnb Earnings Trend in Montrose
Montrose Airbnb Occupancy Rate Trends (2025)
Maximize your bookings by understanding the Montrose STR occupancy trends. Seasonal demand shifts significantly influence how often properties are booked. Typically, Augustsees the highest demand (peak season occupancy), while January experiences the lowest (low season). Effective strategies, like adjusting minimum stays or offering promotions, can boost occupancy during slower periods. Here's how different property tiers perform in Montrose:
- Best-in-class properties (Top 10%) achieve 82%+ occupancy, indicating high desirability and potentially optimized availability.
- Strong performing properties (Top 25%) maintain 66% or higher occupancy, suggesting good market fit and guest satisfaction.
- Typical properties (Median) have an occupancy rate around 45%.
- Entry-level properties (Bottom 25%) average 21% occupancy, potentially facing higher vacancy.
Average Monthly Occupancy Rate Trend in Montrose
Average Daily Rate (ADR) Airbnb Trends in Montrose (2025)
Effective short term rental pricing strategy in Montrose involves understanding monthly ADR fluctuations. The Average Daily Rate (ADR) for Airbnb in Montrose typically peaks in July and dips lowest during November. Leveraging Airbnb dynamic pricing tools or strategies based on this seasonality can significantly boost revenue. Here's a look at the typical nightly rates achieved:
- Best-in-class properties (Top 10%) command rates of $227+ per night, often due to premium features or locations.
- Strong performing properties (Top 25%) achieve nightly rates of $171 or more.
- Typical properties (Median) charge around $117 per night.
- Entry-level properties (Bottom 25%) earn around $87 per night.
Average Daily Rate (ADR) Trend by Month in Montrose
Get Live Montrose Market Intelligence 👇

Explore Real-time Analytics
Airbnb Seasonality Analysis & Trends in Montrose (2025)
Peak Season (July, August, May)
- Revenue averages $2,834 per month
- Occupancy rates average 57.8%
- Daily rates average $160
Shoulder Season
- Revenue averages $2,248 per month
- Occupancy maintains around 43.0%
- Daily rates hold near $151
Low Season (January, February, March)
- Revenue drops to average $1,586 per month
- Occupancy decreases to average 32.9%
- Daily rates adjust to average $138
Seasonality Insights for Montrose
- The Airbnb seasonality in Montrose shows moderate seasonality with distinct peak and low periods. While the sections above show seasonal averages, it's also insightful to look at the extremes:
- During the high season, the absolute peak month showcases Montrose's highest earning potential, with monthly revenues capable of climbing to $2,972, occupancy reaching a high of 62.9%, and ADRs peaking at $164.
- Conversely, the slowest single month of the year, typically falling within the low season, marks the market's lowest point. In this month, revenue might dip to $1,509, occupancy could drop to 27.0%, and ADRs may adjust down to $136.
- Understanding both the seasonal averages and these monthly peaks and troughs in revenue, occupancy, and ADR is crucial for maximizing your Airbnb profit potential in Montrose.
Seasonal Strategies for Maximizing Profit
- Peak Season: Maximize revenue through premium pricing and potentially longer minimum stays. Ensure high availability.
- Low Season: Offer competitive pricing, special promotions (e.g., extended stay discounts), and flexible cancellation policies. Target off-season travelers like remote workers or budget-conscious guests.
- Shoulder Seasons: Implement dynamic pricing that balances peak and low rates. Target weekend travelers or specific events. Offer slightly more flexible terms than peak season.
- Regularly analyze your own performance against these Montrose seasonality benchmarks and adjust your pricing and availability strategy accordingly.
Best Areas for Airbnb Investment in Montrose (2025)
Exploring the top neighborhoods for short-term rentals in Montrose? This section highlights key areas, outlining why they are attractive for hosts and guests, along with notable local attractions. Consider these locations based on your target guest profile and investment strategy.
| Neighborhood / Area | Why Host Here? (Target Guests & Appeal) | Key Attractions & Landmarks |
|---|---|---|
| Montrose Harbour | Scenic coastal area with picturesque views and recreational activities. Ideal for tourists looking to experience marine life and local fishing culture. | Montrose Port, Montrose Basin, Bamse Statue, Montrose Beach, The Links, Montrose Botanic Garden |
| Historic Montrose Town Centre | Centrally located with charming streets filled with shops, cafes, and historical sites. Great for visitors wanting to explore the rich heritage of Montrose. | Montrose Museum and Art Gallery, St. Peter's Church, Montrose Air Station Heritage Centre, Historic Market Place, The Old Town Hall, Montrose Town House |
| Montrose Beach | Popular beach destination with sandy shores and family-friendly activities. Suitable for those who enjoy water sports and beach leisure. | Montrose Beach Promenade, Sand Dunes, Water sports rentals, Beachfront cafes, Picnic areas, Children's play park |
| Montrose Wildlife Reserve | Nature lovers paradise with rich wildlife and beautiful landscapes. Attracts visitors interested in birdwatching and outdoor activities. | Montrose Basin Nature Reserve, Birdwatching hides, Walking trails, Wildlife tours, Photography spots, Educational visitor centre |
| Ferryden | Charming coastal village known for its quaint atmosphere and views of the North Sea. Perfect for a relaxing getaway. | Ferryden Beach, Local shops, Seaside walks, Harbor views, Ferryden Lighthouse, Fishing spots |
| Dunnottar Castle (nearby) | Historic ruined castle on the cliffs, offering breathtaking views and a glimpse into Scotland's storied past. A must-visit for history enthusiasts. | Dunnottar Castle, Stunning coastal hikes, Cultural history, Photography opportunities, Visitor centre |
| Sandyhill | Quiet residential area with easy access to Montrose Beach and local amenities. Attractive for families and long-term rental opportunities. | Local parks, Beach access, Community centre, Playgrounds, Family-friendly atmosphere |
| Lunan Bay (nearby) | Picturesque beach and scenic area, ideal for outdoor activities such as walking, cycling, and enjoying coastal scenery. Appeals to nature and adventure seekers. | Lunan Bay Beach, Nature trails, Scenic views, Wildlife spotting, Surfing opportunities |
Understanding Airbnb License Requirements & STR Laws in Montrose (2025)
Yes, Montrose, Scotland, United Kingdom enforces high STR regulations. Obtaining a license and ensuring compliance is almost certainly required according to current 2025 STR laws. Always verify the latest short term rental regulations and Airbnb license requirements directly with local government authorities for Montrose to ensure full compliance before hosting.
(Source: AirROI data, 2025, based on 35% licensed listings)
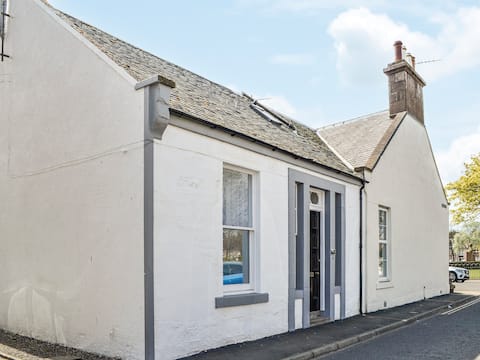
Top Performing Airbnb Properties in Montrose (2025)
Benchmark your potential! Explore examples of top-performing Airbnb properties in Montrosebased on Trailing Twelve Month (TTM) revenue. Analyze their characteristics, revenue, occupancy rate, and ADR to understand what drives success in this market.

The Steading
Entire Place • 4 bedrooms

Stunning modern 2 bedroom cottage with Hottub
Entire Place • 2 bedrooms
Dezzy's
Entire Place • 2 bedrooms
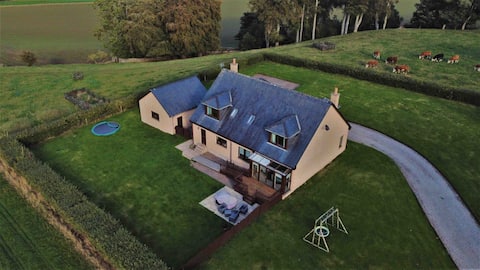
Modern country farmhouse with stunning river views
Entire Place • 4 bedrooms

The Shepherd's Hut
Entire Place • 1 bedroom

Bright, fresh apartment in the heart of Montrose!
Entire Place • 3 bedrooms
Note: Performance varies based on location, size, amenities, seasonality, and management quality. Data reflects the past 12 months.
Top Performing Airbnb Hosts in Montrose (2025)
Learn from the best! This table showcases top-performing Airbnb hosts in Montrose based on the number of properties managed and estimated total revenue over the past year. Analyze their scale and performance metrics.
| Host Name | Properties | Grossing Revenue | Stay Reviews | Avg Rating |
|---|---|---|---|---|
| Cottages | 4 | $201,963 | 45 | 4.83/5.0 |
| Rebecca | 1 | $63,286 | 47 | 4.96/5.0 |
| Helen | 1 | $57,314 | 73 | 4.99/5.0 |
| Andrea | 1 | $47,926 | 11 | 4.73/5.0 |
| Colin | 2 | $46,539 | 114 | 4.92/5.0 |
| Gillian | 2 | $40,836 | 21 | 5.00/5.0 |
| Louise | 1 | $39,525 | 63 | 4.97/5.0 |
| Deenaree | 1 | $36,339 | 43 | 4.95/5.0 |
| William | 1 | $35,114 | 49 | 4.90/5.0 |
| Margaret | 1 | $33,438 | 18 | 4.94/5.0 |
Analyzing the strategies of top hosts, such as their property selection, pricing, and guest communication, can offer valuable lessons for optimizing your own Airbnb operations in Montrose.
Dive Deeper: Advanced Montrose STR Market Data (2025)
Ready to unlock more insights? AirROI provides access to advanced metrics and comprehensive Airbnb data for Montrose. Explore detailed analytics beyond this report to refine your investment strategy, optimize pricing, and maximize your vacation rental profits.
Explore Advanced MetricsMontrose Short-Term Rental Market Composition (2025): Property & Room Types
Room Type Distribution
Property Type Distribution
Market Composition Insights for Montrose
- The Montrose Airbnb market composition is heavily skewed towards Entire Home/Apt listings, which make up 87.5% of the 48 active rentals. This indicates strong guest preference for privacy and space.
- Looking at the property type distribution in Montrose, Apartment/Condo properties are the most common (47.9%), reflecting the local real estate landscape.
- Houses represent a significant 35.4% portion, catering likely to families or larger groups.
- The presence of 8.3% Hotel/Boutique listings indicates integration with traditional hospitality.
- Smaller segments like unique stays (combined 2.1%) offer potential for unique stay experiences.
Montrose Airbnb Room Capacity Analysis (2025): Bedroom Distribution
Distribution of Listings by Number of Bedrooms
Room Capacity Insights for Montrose
- The dominant room capacity in Montrose is 2 bedrooms listings, making up 39.6% of the market. This suggests a strong demand for properties suitable for couples or solo travelers.
- Together, 2 bedrooms and 1 bedroom properties represent 66.7% of the active Airbnb listings in Montrose, indicating a high concentration in these sizes.
- A significant 25.1% of listings offer 3+ bedrooms, catering to larger groups and families seeking more space in Montrose.
Montrose Vacation Rental Guest Capacity Trends (2025)
Distribution of Listings by Guest Capacity
Guest Capacity Insights for Montrose
- The most common guest capacity trend in Montrose vacation rentals is listings accommodating 4 guests (31.3%). This suggests the primary traveler segment is likely small families or groups.
- Properties designed for 4 guests and 2 guests dominate the Montrose STR market, accounting for 56.3% of listings.
- 23.0% of properties accommodate 6+ guests, serving the market segment for larger families or group travel in Montrose.
- On average, properties in Montrose are equipped to host 3.9 guests.
Montrose Airbnb Booking Patterns (2025): Available vs. Booked Days
Available Days Distribution
Booked Days Distribution
Booking Pattern Insights for Montrose
- The most common availability pattern in Montrose falls within the 91-180 days range, representing 37.5% of listings. This suggests many properties have significant open periods on their calendars.
- Approximately 60.4% of listings show high availability (181+ days open annually), indicating potential for increased bookings or specific owner usage patterns.
- For booked days, the 181-270 days range is most frequent in Montrose (37.5%), reflecting common guest stay durations or potential owner blocking patterns.
- A notable 39.6% of properties secure long booking periods (181+ days booked per year), highlighting successful long-term rental strategies or significant owner usage.
Montrose Airbnb Minimum Stay Requirements Analysis
Distribution of Listings by Minimum Night Requirement
1 Night
11 listings
24.4% of total
2 Nights
18 listings
40% of total
3 Nights
7 listings
15.6% of total
4-6 Nights
3 listings
6.7% of total
7-29 Nights
1 listings
2.2% of total
30+ Nights
5 listings
11.1% of total
Key Insights
- The most prevalent minimum stay requirement in Montrose is 2 Nights, adopted by 40% of listings. This highlights the market's preference for shorter, flexible bookings.
- A strong majority (64.4%) of the Montrose Airbnb data shows acceptance of very short stays (1-2 nights), indicating a dynamic, high-turnover market.
- A significant segment (11.1%) caters to monthly stays (30+ nights) in Montrose, pointing to opportunities in the extended-stay market.
Recommendations
- Align with the market by considering a 2 Nights minimum stay, as 40% of Montrose hosts use this setting.
- If feasible, allowing 1-night stays, especially midweek or during low season, could capture last-minute bookings, as only 24.4% currently do.
- Explore offering discounts for stays of 30+ nights to attract the 11.1% of the market seeking extended stays.
- Adjust minimum nights based on seasonality – potentially shorter during low season and longer during peak demand periods in Montrose.
Montrose Airbnb Cancellation Policy Trends Analysis (2025)
Super Strict 60 Days
3 listings
6.5% of total
Flexible
17 listings
37% of total
Moderate
13 listings
28.3% of total
Firm
8 listings
17.4% of total
Strict
5 listings
10.9% of total
Cancellation Policy Insights for Montrose
- The prevailing Airbnb cancellation policy trend in Montrose is Flexible, used by 37% of listings.
- There's a relatively balanced mix between guest-friendly (65.3%) and stricter (28.3%) policies, offering choices for different guest needs.
Recommendations for Hosts
- Consider adopting a Flexible policy to align with the 37% market standard in Montrose.
- Using a Strict policy might deter some guests, as only 10.9% of listings use it. Evaluate if potential revenue protection outweighs possible lower booking rates.
- Regularly review your cancellation policy against competitors and market demand shifts in Montrose.
Montrose STR Booking Lead Time Analysis (2025)
Average Booking Lead Time by Month
Booking Lead Time Insights for Montrose
- The overall average booking lead time for vacation rentals in Montrose is 60 days.
- Guests book furthest in advance for stays during December (average 81 days), likely coinciding with peak travel demand or local events.
- The shortest booking windows occur for stays in March (average 32 days), indicating more last-minute travel plans during this time.
- Seasonally, Winter (74 days avg.) sees the longest lead times, while Spring (54 days avg.) has the shortest, reflecting typical travel planning cycles.
Recommendations for Hosts
- Use the overall average lead time (60 days) as a baseline for your pricing and availability strategy in Montrose.
- For December stays, consider implementing length-of-stay discounts or slightly higher rates for bookings made less than 81 days out to capitalize on advance planning.
- Target marketing efforts for the Winter season well in advance (at least 74 days) to capture early planners.
- Monitor your own booking lead times against these Montrose averages to identify opportunities for dynamic pricing adjustments.
Popular & Essential Airbnb Amenities in Montrose (2025)
Amenity Prevalence
Amenity Insights for Montrose
- Essential amenities in Montrose that guests expect include: Heating, Smoke alarm, Wifi, TV. Lacking these (any) could significantly impact bookings.
- Popular amenities like Hangers, Iron, Kitchen are common but not universal. Offering these can provide a competitive edge.
Recommendations for Hosts
- Ensure your listing includes all essential amenities for Montrose: Heating, Smoke alarm, Wifi, TV.
- Prioritize adding missing essentials: Smoke alarm, Wifi, TV.
- Consider adding popular differentiators like Hangers or Iron to increase appeal.
- Highlight unique or less common amenities you offer (e.g., hot tub, dedicated workspace, EV charger) in your listing description and photos.
- Regularly check competitor amenities in Montrose to stay competitive.
Montrose Airbnb Guest Demographics & Profile Analysis (2025)
Guest Profile Summary for Montrose
- The typical guest profile for Airbnb in Montrose consists of primarily domestic travelers (78%), often arriving from nearby Scotland, typically belonging to the Post-2000s (Gen Z/Alpha) group (50%), primarily speaking English or French.
- Domestic travelers account for 78.4% of guests.
- Key international markets include United Kingdom (78.4%) and United States (9.1%).
- Top languages spoken are English (64.7%) followed by French (7.6%).
- A significant demographic segment is the Post-2000s (Gen Z/Alpha) group, representing 50% of guests.
Recommendations for Hosts
- Target domestic marketing efforts towards travelers from Scotland and Edinburgh.
- Tailor amenities and listing descriptions to appeal to the dominant Post-2000s (Gen Z/Alpha) demographic (e.g., highlight fast WiFi, smart home features, local guides).
- Highlight unique local experiences or amenities relevant to the primary guest profile.
- Consider seasonal promotions aligned with peak travel times for key origin markets.
Nearby Short-Term Rental Market Comparison
How does the Montrose Airbnb market stack up against its neighbors? Compare key performance metrics like average monthly revenue, ADR, and occupancy rates in surrounding areas to understand the broader regional STR landscape.
| Market | Active Properties | Monthly Revenue | Daily Rate | Avg. Occupancy |
|---|---|---|---|---|
| Gorebridge | 12 | $6,209 | $493.62 | 54% |
| Bridge of Cally | 16 | $5,839 | $566.24 | 50% |
| City of Edinburgh | 4,312 | $4,528 | $274.67 | 61% |
| Kenmore | 10 | $4,507 | $430.34 | 41% |
| Insh | 14 | $4,473 | $289.96 | 63% |
| Kielder | 12 | $4,215 | $329.21 | 53% |
| Auchtermuchty | 11 | $3,979 | $365.72 | 50% |
| Gleneagles | 10 | $3,964 | $284.15 | 45% |
| Leuchars | 16 | $3,949 | $400.90 | 43% |
| St Andrews | 359 | $3,908 | $373.13 | 50% |