Moffat Airbnb Market Analysis 2025: Short Term Rental Data & Vacation Rental Statistics in Scotland, United Kingdom
Is Airbnb profitable in Moffat in 2025? Explore comprehensive Airbnb analytics for Moffat, Scotland, United Kingdom to uncover income potential. This 2025 STR market report for Moffat, based on AirROI data from April 2024 to March 2025, reveals key trends in the niche market of 37 active listings.
Whether you're considering an Airbnb investment in Moffat, optimizing your existing vacation rental, or exploring rental arbitrage opportunities, understanding the Moffat Airbnb data is crucial. Navigating the high regulation landscape is key to maximizing your short term rental income potential. Let's dive into the specifics.
Key Moffat Airbnb Performance Metrics Overview
Monthly Airbnb Revenue Variations & Income Potential in Moffat (2025)
Understanding the monthly revenue variations for Airbnb listings in Moffat is key to maximizing your short term rental income potential. Seasonality significantly impacts earnings. Our analysis, based on data from the past 12 months, shows that the peak revenue month for STRs in Moffat is typically August, while March often presents the lowest earnings, highlighting opportunities for strategic pricing adjustments during shoulder and low seasons. Explore the typical Airbnb income in Moffat across different performance tiers:
- Best-in-class properties (Top 10%) achieve $4,019+ monthly, often utilizing dynamic pricing and superior guest experiences.
- Strong performing properties (Top 25%) earn $2,918 or more, indicating effective management and desirable locations/amenities.
- Typical properties (Median) generate around $1,939 per month, representing the average market performance.
- Entry-level properties (Bottom 25%) see earnings around $1,285, often with potential for optimization.
Average Monthly Airbnb Earnings Trend in Moffat
Moffat Airbnb Occupancy Rate Trends (2025)
Maximize your bookings by understanding the Moffat STR occupancy trends. Seasonal demand shifts significantly influence how often properties are booked. Typically, Augustsees the highest demand (peak season occupancy), while March experiences the lowest (low season). Effective strategies, like adjusting minimum stays or offering promotions, can boost occupancy during slower periods. Here's how different property tiers perform in Moffat:
- Best-in-class properties (Top 10%) achieve 82%+ occupancy, indicating high desirability and potentially optimized availability.
- Strong performing properties (Top 25%) maintain 71% or higher occupancy, suggesting good market fit and guest satisfaction.
- Typical properties (Median) have an occupancy rate around 48%.
- Entry-level properties (Bottom 25%) average 30% occupancy, potentially facing higher vacancy.
Average Monthly Occupancy Rate Trend in Moffat
Average Daily Rate (ADR) Airbnb Trends in Moffat (2025)
Effective short term rental pricing strategy in Moffat involves understanding monthly ADR fluctuations. The Average Daily Rate (ADR) for Airbnb in Moffat typically peaks in July and dips lowest during February. Leveraging Airbnb dynamic pricing tools or strategies based on this seasonality can significantly boost revenue. Here's a look at the typical nightly rates achieved:
- Best-in-class properties (Top 10%) command rates of $313+ per night, often due to premium features or locations.
- Strong performing properties (Top 25%) achieve nightly rates of $170 or more.
- Typical properties (Median) charge around $131 per night.
- Entry-level properties (Bottom 25%) earn around $101 per night.
Average Daily Rate (ADR) Trend by Month in Moffat
Get Live Moffat Market Intelligence 👇

Explore Real-time Analytics
Airbnb Seasonality Analysis & Trends in Moffat (2025)
Peak Season (August, June, May)
- Revenue averages $3,014 per month
- Occupancy rates average 57.6%
- Daily rates average $179
Shoulder Season
- Revenue averages $2,313 per month
- Occupancy maintains around 51.4%
- Daily rates hold near $178
Low Season (January, February, March)
- Revenue drops to average $1,528 per month
- Occupancy decreases to average 38.5%
- Daily rates adjust to average $168
Seasonality Insights for Moffat
- The Airbnb seasonality in Moffat shows highly seasonal trends requiring careful strategy. While the sections above show seasonal averages, it's also insightful to look at the extremes:
- During the high season, the absolute peak month showcases Moffat's highest earning potential, with monthly revenues capable of climbing to $3,522, occupancy reaching a high of 68.8%, and ADRs peaking at $181.
- Conversely, the slowest single month of the year, typically falling within the low season, marks the market's lowest point. In this month, revenue might dip to $1,363, occupancy could drop to 34.1%, and ADRs may adjust down to $165.
- Understanding both the seasonal averages and these monthly peaks and troughs in revenue, occupancy, and ADR is crucial for maximizing your Airbnb profit potential in Moffat.
Seasonal Strategies for Maximizing Profit
- Peak Season: Maximize revenue through premium pricing and potentially longer minimum stays. Ensure high availability.
- Low Season: Offer competitive pricing, special promotions (e.g., extended stay discounts), and flexible cancellation policies. Target off-season travelers like remote workers or budget-conscious guests.
- Shoulder Seasons: Implement dynamic pricing that balances peak and low rates. Target weekend travelers or specific events. Offer slightly more flexible terms than peak season.
- Regularly analyze your own performance against these Moffat seasonality benchmarks and adjust your pricing and availability strategy accordingly.
Best Areas for Airbnb Investment in Moffat (2025)
Exploring the top neighborhoods for short-term rentals in Moffat? This section highlights key areas, outlining why they are attractive for hosts and guests, along with notable local attractions. Consider these locations based on your target guest profile and investment strategy.
| Neighborhood / Area | Why Host Here? (Target Guests & Appeal) | Key Attractions & Landmarks |
|---|---|---|
| Moffat Town Centre | The heart of Moffat, known for its historic charm and vibrant community. Visitors are attracted to its quaint shops, cafés, and proximity to beautiful countryside walks. | Moffat Woolen Mill, Grey Mare's Tail Waterfall, The Old Well Theatre, Moffat Museum, St Andrew's Church |
| Moffat Hills | A stunning natural area offering breathtaking views and outdoor activities such as hiking and nature walks. Perfect for nature enthusiasts and those seeking tranquility. | Moffat Hills Trail, Grey Mare's Tail National Nature Reserve, The Southern Upland Way, Wildlife Watching, Photography Opportunities |
| Annandale Water | A picturesque lake area that attracts visitors for recreational activities like fishing and boating. Peaceful and great for family getaways. | Annandale Water Park, Fishing and Boating, Walking Trails, Picnic Areas, Wildlife Observations |
| Beattock | A quiet village location close to Moffat, favored for its peaceful environment and easy access to nearby attractions. Ideal for relaxation. | Beattock Railway Station, Local Parks, Scenic Views, Cycling Routes, Historic Sites |
| A701 Route | A scenic driving route that attracts tourists for its beautiful landscapes and access to various villages and sites of interest. Great for road trips. | Scenic Drives, Photography Spots, Local Villages, Cafés along the route, Natural Landscapes |
| Moffat Golf Course | Attracts golf enthusiasts and visitors looking for leisure activities. The course offers beautiful views and is accessible for visitors. | Moffat Golf Club, Scenic Golfing Views, Clubhouse Facilities, Nature Trails Nearby, Social Events |
| Culter Allerdale | A charming rural area that’s becoming popular for its walking trails and historical sites. Attracts those looking for a quiet retreat. | Culter Allerdale Church, Walking Paths, Local History, Countryside Views, Wildlife |
| Stirling | A nearby historical city known for its rich heritage and tourist attractions. Offers a blend of history and modern amenities for visitors. | Stirling Castle, National Wallace Monument, Battle of Bannockburn Visitor Centre, Stirling Old Town, Shopping and Dining |
Understanding Airbnb License Requirements & STR Laws in Moffat (2025)
Yes, Moffat, Scotland, United Kingdom enforces high STR regulations. Obtaining a license and ensuring compliance is almost certainly required according to current 2025 STR laws. Always verify the latest short term rental regulations and Airbnb license requirements directly with local government authorities for Moffat to ensure full compliance before hosting.
(Source: AirROI data, 2025, based on 32% licensed listings)
Top Performing Airbnb Properties in Moffat (2025)
Benchmark your potential! Explore examples of top-performing Airbnb properties in Moffatbased on Trailing Twelve Month (TTM) revenue. Analyze their characteristics, revenue, occupancy rate, and ADR to understand what drives success in this market.

3 Ladyknowe - UK39969
Entire Place • 3 bedrooms
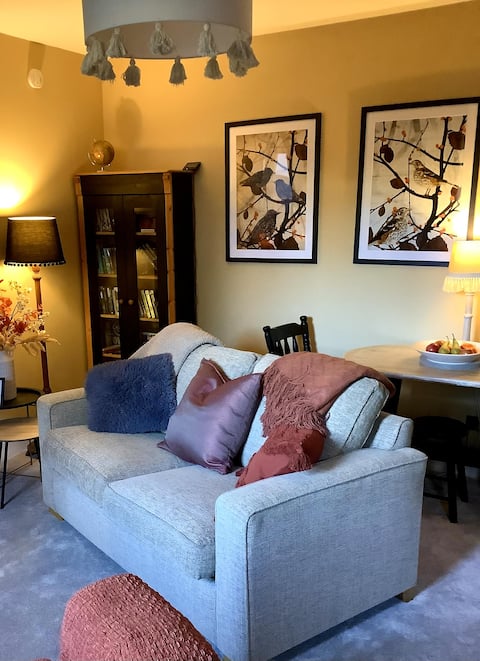
NEW for ‘24! Stylish wee cottage
Entire Place • 1 bedroom
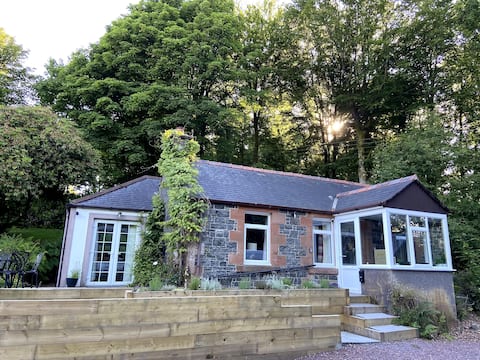
Estate cottage in extensive gardens.
Entire Place • 2 bedrooms
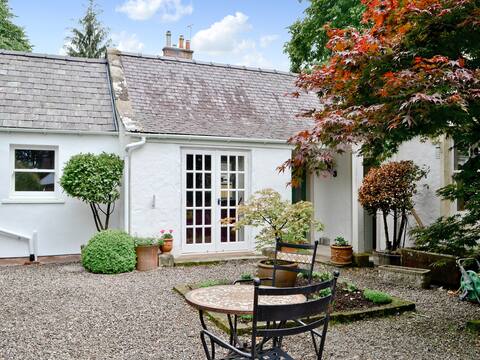
Roseburn Cottage
Entire Place • 1 bedroom
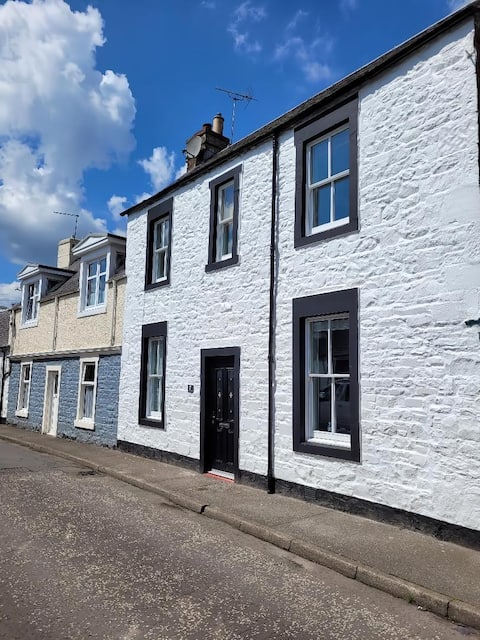
Character cottage in the centre of Moffat
Entire Place • 2 bedrooms

Idyllic Self Catering Studio Semi Rural Location
Entire Place • N/A
Note: Performance varies based on location, size, amenities, seasonality, and management quality. Data reflects the past 12 months.
Top Performing Airbnb Hosts in Moffat (2025)
Learn from the best! This table showcases top-performing Airbnb hosts in Moffat based on the number of properties managed and estimated total revenue over the past year. Analyze their scale and performance metrics.
| Host Name | Properties | Grossing Revenue | Stay Reviews | Avg Rating |
|---|---|---|---|---|
| Cottages | 6 | $175,674 | 40 | 4.07/5.0 |
| Sam | 1 | $44,094 | 58 | 4.95/5.0 |
| Lucy | 2 | $41,723 | 82 | 2.40/5.0 |
| Piers | 2 | $41,377 | 288 | 4.95/5.0 |
| Karen | 1 | $38,920 | 230 | 4.98/5.0 |
| Paul Alexander | 1 | $36,632 | 50 | 4.90/5.0 |
| Jan | 1 | $35,637 | 181 | 4.99/5.0 |
| Jane | 1 | $33,467 | 51 | 4.98/5.0 |
| Shona | 1 | $30,374 | 332 | 5.00/5.0 |
| Claire | 1 | $26,278 | 139 | 4.85/5.0 |
Analyzing the strategies of top hosts, such as their property selection, pricing, and guest communication, can offer valuable lessons for optimizing your own Airbnb operations in Moffat.
Dive Deeper: Advanced Moffat STR Market Data (2025)
Ready to unlock more insights? AirROI provides access to advanced metrics and comprehensive Airbnb data for Moffat. Explore detailed analytics beyond this report to refine your investment strategy, optimize pricing, and maximize your vacation rental profits.
Explore Advanced MetricsMoffat Short-Term Rental Market Composition (2025): Property & Room Types
Room Type Distribution
Property Type Distribution
Market Composition Insights for Moffat
- The Moffat Airbnb market composition is heavily skewed towards Entire Home/Apt listings, which make up 97.3% of the 37 active rentals. This indicates strong guest preference for privacy and space.
- Looking at the property type distribution in Moffat, House properties are the most common (62.2%), reflecting the local real estate landscape.
- Houses represent a significant 62.2% portion, catering likely to families or larger groups.
- Smaller segments like hotel/boutique (combined 2.7%) offer potential for unique stay experiences.
Moffat Airbnb Room Capacity Analysis (2025): Bedroom Distribution
Distribution of Listings by Number of Bedrooms
Room Capacity Insights for Moffat
- The dominant room capacity in Moffat is 2 bedrooms listings, making up 45.9% of the market. This suggests a strong demand for properties suitable for couples or solo travelers.
- Together, 2 bedrooms and 1 bedroom properties represent 83.7% of the active Airbnb listings in Moffat, indicating a high concentration in these sizes.
Moffat Vacation Rental Guest Capacity Trends (2025)
Distribution of Listings by Guest Capacity
Guest Capacity Insights for Moffat
- The most common guest capacity trend in Moffat vacation rentals is listings accommodating 4 guests (45.9%). This suggests the primary traveler segment is likely small families or groups.
- Properties designed for 4 guests and 2 guests dominate the Moffat STR market, accounting for 75.6% of listings.
- 18.9% of properties accommodate 6+ guests, serving the market segment for larger families or group travel in Moffat.
- On average, properties in Moffat are equipped to host 3.8 guests.
Moffat Airbnb Booking Patterns (2025): Available vs. Booked Days
Available Days Distribution
Booked Days Distribution
Booking Pattern Insights for Moffat
- The most common availability pattern in Moffat falls within the 181-270 days range, representing 40.5% of listings. This suggests many properties have significant open periods on their calendars.
- Approximately 59.4% of listings show high availability (181+ days open annually), indicating potential for increased bookings or specific owner usage patterns.
- For booked days, the 91-180 days range is most frequent in Moffat (43.2%), reflecting common guest stay durations or potential owner blocking patterns.
- A notable 40.5% of properties secure long booking periods (181+ days booked per year), highlighting successful long-term rental strategies or significant owner usage.
Moffat Airbnb Minimum Stay Requirements Analysis
Distribution of Listings by Minimum Night Requirement
1 Night
16 listings
44.4% of total
2 Nights
9 listings
25% of total
3 Nights
6 listings
16.7% of total
7-29 Nights
1 listings
2.8% of total
30+ Nights
4 listings
11.1% of total
Key Insights
- The most prevalent minimum stay requirement in Moffat is 1 Night, adopted by 44.4% of listings. This highlights the market's preference for shorter, flexible bookings.
- A strong majority (69.4%) of the Moffat Airbnb data shows acceptance of very short stays (1-2 nights), indicating a dynamic, high-turnover market.
- A significant segment (11.1%) caters to monthly stays (30+ nights) in Moffat, pointing to opportunities in the extended-stay market.
Recommendations
- Align with the market by considering a 1 Night minimum stay, as 44.4% of Moffat hosts use this setting.
- Explore offering discounts for stays of 30+ nights to attract the 11.1% of the market seeking extended stays.
- Adjust minimum nights based on seasonality – potentially shorter during low season and longer during peak demand periods in Moffat.
Moffat Airbnb Cancellation Policy Trends Analysis (2025)
Super Strict 60 Days
6 listings
18.2% of total
Flexible
7 listings
21.2% of total
Moderate
9 listings
27.3% of total
Firm
5 listings
15.2% of total
Strict
6 listings
18.2% of total
Cancellation Policy Insights for Moffat
- The prevailing Airbnb cancellation policy trend in Moffat is Moderate, used by 27.3% of listings.
- There's a relatively balanced mix between guest-friendly (48.5%) and stricter (33.4%) policies, offering choices for different guest needs.
Recommendations for Hosts
- Consider adopting a Moderate policy to align with the 27.3% market standard in Moffat.
- Regularly review your cancellation policy against competitors and market demand shifts in Moffat.
Moffat STR Booking Lead Time Analysis (2025)
Average Booking Lead Time by Month
Booking Lead Time Insights for Moffat
- The overall average booking lead time for vacation rentals in Moffat is 65 days.
- Guests book furthest in advance for stays during May (average 94 days), likely coinciding with peak travel demand or local events.
- The shortest booking windows occur for stays in March (average 43 days), indicating more last-minute travel plans during this time.
- Seasonally, Summer (69 days avg.) sees the longest lead times, while Fall (54 days avg.) has the shortest, reflecting typical travel planning cycles.
Recommendations for Hosts
- Use the overall average lead time (65 days) as a baseline for your pricing and availability strategy in Moffat.
- For May stays, consider implementing length-of-stay discounts or slightly higher rates for bookings made less than 94 days out to capitalize on advance planning.
- Target marketing efforts for the Summer season well in advance (at least 69 days) to capture early planners.
- Monitor your own booking lead times against these Moffat averages to identify opportunities for dynamic pricing adjustments.
Popular & Essential Airbnb Amenities in Moffat (2025)
Amenity Prevalence
Amenity Insights for Moffat
- Essential amenities in Moffat that guests expect include: Smoke alarm. Lacking these (this) could significantly impact bookings.
- Popular amenities like Heating, Wifi, TV are common but not universal. Offering these can provide a competitive edge.
- Warning: Wifi is not universally provided but is considered essential globally. Ensure reliable Wifi is offered.
Recommendations for Hosts
- Ensure your listing includes all essential amenities for Moffat: Smoke alarm.
- Consider adding popular differentiators like Heating or Wifi to increase appeal.
- Highlight unique or less common amenities you offer (e.g., hot tub, dedicated workspace, EV charger) in your listing description and photos.
- Regularly check competitor amenities in Moffat to stay competitive.
Moffat Airbnb Guest Demographics & Profile Analysis (2025)
Guest Profile Summary for Moffat
- The typical guest profile for Airbnb in Moffat consists of primarily domestic travelers (88%), often arriving from nearby England, typically belonging to the Post-2000s (Gen Z/Alpha) group (50%), primarily speaking English or Spanish.
- Domestic travelers account for 87.5% of guests.
- Key international markets include United Kingdom (87.5%) and United States (4.7%).
- Top languages spoken are English (66.5%) followed by Spanish (7.3%).
- A significant demographic segment is the Post-2000s (Gen Z/Alpha) group, representing 50% of guests.
Recommendations for Hosts
- Target domestic marketing efforts towards travelers from England and Scotland.
- Tailor amenities and listing descriptions to appeal to the dominant Post-2000s (Gen Z/Alpha) demographic (e.g., highlight fast WiFi, smart home features, local guides).
- Highlight unique local experiences or amenities relevant to the primary guest profile.
- Consider seasonal promotions aligned with peak travel times for key origin markets.
Nearby Short-Term Rental Market Comparison
How does the Moffat Airbnb market stack up against its neighbors? Compare key performance metrics like average monthly revenue, ADR, and occupancy rates in surrounding areas to understand the broader regional STR landscape.
| Market | Active Properties | Monthly Revenue | Daily Rate | Avg. Occupancy |
|---|---|---|---|---|
| Galston | 11 | $7,951 | $676.77 | 46% |
| Fearnan | 19 | $6,440 | $421.92 | 53% |
| Gorebridge | 12 | $6,209 | $493.62 | 54% |
| Bridge of Cally | 16 | $5,839 | $566.24 | 50% |
| Arrochar | 33 | $5,045 | $339.11 | 56% |
| Acharn | 10 | $4,813 | $278.43 | 57% |
| Cartmel Fell | 17 | $4,719 | $331.68 | 52% |
| Croftamie | 19 | $4,609 | $267.39 | 52% |
| Carrick Castle | 11 | $4,591 | $586.01 | 42% |
| Casterton | 11 | $4,578 | $300.82 | 51% |