Lower Largo Airbnb Market Analysis 2025: Short Term Rental Data & Vacation Rental Statistics in Scotland, United Kingdom
Is Airbnb profitable in Lower Largo in 2025? Explore comprehensive Airbnb analytics for Lower Largo, Scotland, United Kingdom to uncover income potential. This 2025 STR market report for Lower Largo, based on AirROI data from April 2024 to March 2025, reveals key trends in the niche market of 24 active listings.
Whether you're considering an Airbnb investment in Lower Largo, optimizing your existing vacation rental, or exploring rental arbitrage opportunities, understanding the Lower Largo Airbnb data is crucial. Understanding the local regulations is key to maximizing your short term rental income potential. Let's dive into the specifics.
Key Lower Largo Airbnb Performance Metrics Overview
Monthly Airbnb Revenue Variations & Income Potential in Lower Largo (2025)
Understanding the monthly revenue variations for Airbnb listings in Lower Largo is key to maximizing your short term rental income potential. Seasonality significantly impacts earnings. Our analysis, based on data from the past 12 months, shows that the peak revenue month for STRs in Lower Largo is typically August, while February often presents the lowest earnings, highlighting opportunities for strategic pricing adjustments during shoulder and low seasons. Explore the typical Airbnb income in Lower Largo across different performance tiers:
- Best-in-class properties (Top 10%) achieve $4,910+ monthly, often utilizing dynamic pricing and superior guest experiences.
- Strong performing properties (Top 25%) earn $3,841 or more, indicating effective management and desirable locations/amenities.
- Typical properties (Median) generate around $2,418 per month, representing the average market performance.
- Entry-level properties (Bottom 25%) see earnings around $1,532, often with potential for optimization.
Average Monthly Airbnb Earnings Trend in Lower Largo
Lower Largo Airbnb Occupancy Rate Trends (2025)
Maximize your bookings by understanding the Lower Largo STR occupancy trends. Seasonal demand shifts significantly influence how often properties are booked. Typically, Septembersees the highest demand (peak season occupancy), while January experiences the lowest (low season). Effective strategies, like adjusting minimum stays or offering promotions, can boost occupancy during slower periods. Here's how different property tiers perform in Lower Largo:
- Best-in-class properties (Top 10%) achieve 90%+ occupancy, indicating high desirability and potentially optimized availability.
- Strong performing properties (Top 25%) maintain 70% or higher occupancy, suggesting good market fit and guest satisfaction.
- Typical properties (Median) have an occupancy rate around 49%.
- Entry-level properties (Bottom 25%) average 26% occupancy, potentially facing higher vacancy.
Average Monthly Occupancy Rate Trend in Lower Largo
Average Daily Rate (ADR) Airbnb Trends in Lower Largo (2025)
Effective short term rental pricing strategy in Lower Largo involves understanding monthly ADR fluctuations. The Average Daily Rate (ADR) for Airbnb in Lower Largo typically peaks in August and dips lowest during January. Leveraging Airbnb dynamic pricing tools or strategies based on this seasonality can significantly boost revenue. Here's a look at the typical nightly rates achieved:
- Best-in-class properties (Top 10%) command rates of $404+ per night, often due to premium features or locations.
- Strong performing properties (Top 25%) achieve nightly rates of $243 or more.
- Typical properties (Median) charge around $162 per night.
- Entry-level properties (Bottom 25%) earn around $120 per night.
Average Daily Rate (ADR) Trend by Month in Lower Largo
Get Live Lower Largo Market Intelligence 👇

Explore Real-time Analytics
Airbnb Seasonality Analysis & Trends in Lower Largo (2025)
Peak Season (August, July, September)
- Revenue averages $4,001 per month
- Occupancy rates average 65.4%
- Daily rates average $232
Shoulder Season
- Revenue averages $2,821 per month
- Occupancy maintains around 47.6%
- Daily rates hold near $223
Low Season (January, February, March)
- Revenue drops to average $1,836 per month
- Occupancy decreases to average 36.6%
- Daily rates adjust to average $201
Seasonality Insights for Lower Largo
- The Airbnb seasonality in Lower Largo shows highly seasonal trends requiring careful strategy. While the sections above show seasonal averages, it's also insightful to look at the extremes:
- During the high season, the absolute peak month showcases Lower Largo's highest earning potential, with monthly revenues capable of climbing to $4,047, occupancy reaching a high of 69.8%, and ADRs peaking at $235.
- Conversely, the slowest single month of the year, typically falling within the low season, marks the market's lowest point. In this month, revenue might dip to $1,728, occupancy could drop to 34.2%, and ADRs may adjust down to $199.
- Understanding both the seasonal averages and these monthly peaks and troughs in revenue, occupancy, and ADR is crucial for maximizing your Airbnb profit potential in Lower Largo.
Seasonal Strategies for Maximizing Profit
- Peak Season: Maximize revenue through premium pricing and potentially longer minimum stays. Ensure high availability.
- Low Season: Offer competitive pricing, special promotions (e.g., extended stay discounts), and flexible cancellation policies. Target off-season travelers like remote workers or budget-conscious guests.
- Shoulder Seasons: Implement dynamic pricing that balances peak and low rates. Target weekend travelers or specific events. Offer slightly more flexible terms than peak season.
- Regularly analyze your own performance against these Lower Largo seasonality benchmarks and adjust your pricing and availability strategy accordingly.
Best Areas for Airbnb Investment in Lower Largo (2025)
Exploring the top neighborhoods for short-term rentals in Lower Largo? This section highlights key areas, outlining why they are attractive for hosts and guests, along with notable local attractions. Consider these locations based on your target guest profile and investment strategy.
| Neighborhood / Area | Why Host Here? (Target Guests & Appeal) | Key Attractions & Landmarks |
|---|---|---|
| Lower Largo Beach | Beautiful sandy beach area, perfect for tourists who want to relax by the sea. Offers stunning views and a peaceful environment for guests seeking a seaside getaway. | Lower Largo Harbour, Largo Beach, The Ship Inn, St. John's Church, Coastline Walks, Water Sports Activities |
| Historic Lower Largo | Rich in history with picturesque stone buildings, attracting visitors interested in heritage and local culture. Great for travelers wanting to explore Scotland's historical sites. | The Old Kirk, Fishermen's Cottages, Local Heritage Walks, Ruins of the Old Pier, Nearby Anstruther, Crail |
| Golfers Paradise | Close to several golf courses, making it a hot spot for golf enthusiasts looking for weekend getaways. | Leven Golfing Society, Links Golf Courses, Golf Clubhouse, Local Golf Shops, Glenrothes Golf Club |
| Anstruther | A charming fishing village nearby with a lively harbor and famed fish and chips, popular among tourists. | Cellerdyke Harbour, Anstruther Fish Bar, Scottish Fisheries Museum, Boat Trips to May Island, St. Nicholas Church |
| East Neuk Villages | Collection of picturesque coastal villages renowned for their art scenes and stunning coastal paths; perfect for artists and nature lovers. | Pittenweem, Crail, Cellardyke, Coastal Walkways, Local Art Galleries |
| North Berwick | Easily accessible, known for its beautiful beaches, golf courses, and family-friendly activities. Attracts a wide variety of visitors. | North Berwick Beach, Scottish Seabird Centre, North Berwick Golf Club, Lighthouse Tours, Seaside Restaurants |
| St Andrews | World-famous for its university and golf courses, attracting international students and tourists interested in educational and recreational activities. | St Andrews Cathedral, Old Course, British Golf Museum, St Andrews Botanic Garden, West Sands Beach |
| Falkland | Charming village famous for Falkland Palace, providing guests with both history and scenic walks, ideal for visitors looking for cultural experiences. | Falkland Palace, Falkland Estate Gardens, Local Antique Shops, Hiking Trails, Historical Sites |
Understanding Airbnb License Requirements & STR Laws in Lower Largo (2025)
With 29% of listings showing registration in 2025, understanding potential Airbnb license requirements is crucial in Lower Largo. Always verify the latest short term rental regulations and Airbnb license requirements directly with local government authorities for Lower Largo to ensure full compliance before hosting.
(Source: AirROI data, 2025, based on 29% licensed listings)
Top Performing Airbnb Properties in Lower Largo (2025)
Benchmark your potential! Explore examples of top-performing Airbnb properties in Lower Largobased on Trailing Twelve Month (TTM) revenue. Analyze their characteristics, revenue, occupancy rate, and ADR to understand what drives success in this market.
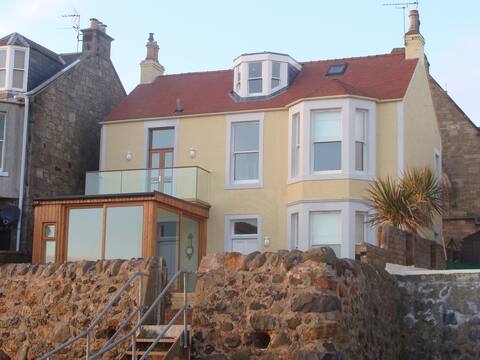
Beach house in Lower Largo (Near St. Andrews)
Entire Place • 5 bedrooms
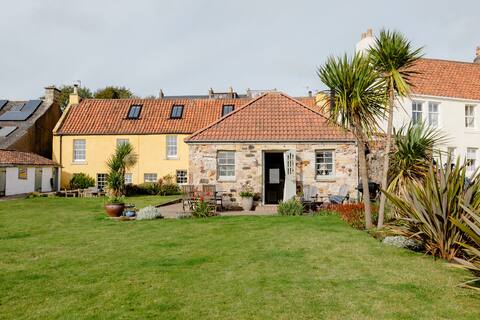
Weaver’s Cottage beach getaway
Entire Place • 1 bedroom
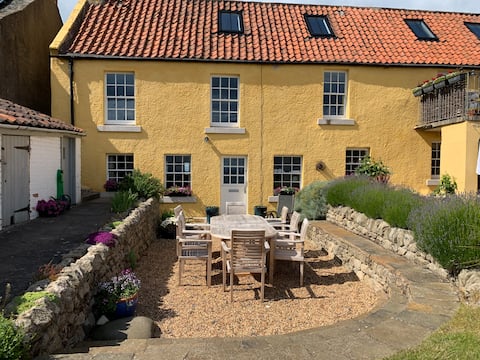
Beach Cottage - direct beach access
Entire Place • 2 bedrooms

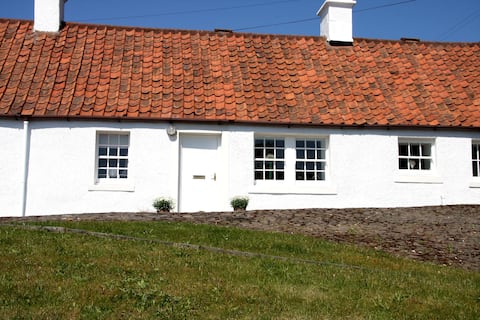
Coastal vibes at the Wee Blue House, East Neuk
Entire Place • 1 bedroom
Cardy Crossing Cottage -Lower Largo beach FI02098P
Entire Place • 3 bedrooms
Beach House, stylish apartment overlooking beach
Entire Place • 2 bedrooms
Note: Performance varies based on location, size, amenities, seasonality, and management quality. Data reflects the past 12 months.
Top Performing Airbnb Hosts in Lower Largo (2025)
Learn from the best! This table showcases top-performing Airbnb hosts in Lower Largo based on the number of properties managed and estimated total revenue over the past year. Analyze their scale and performance metrics.
| Host Name | Properties | Grossing Revenue | Stay Reviews | Avg Rating |
|---|---|---|---|---|
| Caron | 2 | $96,162 | 1238 | 4.95/5.0 |
| Kyle | 1 | $83,905 | 31 | 5.00/5.0 |
| Debbie | 5 | $59,859 | 27 | 2.87/5.0 |
| Sarah | 2 | $48,486 | 283 | 4.96/5.0 |
| Gillian | 1 | $44,776 | 58 | 5.00/5.0 |
| Claudine | 1 | $44,287 | 268 | 4.87/5.0 |
| Henry | 1 | $41,785 | 70 | 4.99/5.0 |
| Travelnest | 1 | $38,458 | 27 | 4.96/5.0 |
| Fraser | 1 | $36,972 | 101 | 4.91/5.0 |
| Jill | 1 | $34,235 | 54 | 4.93/5.0 |
Analyzing the strategies of top hosts, such as their property selection, pricing, and guest communication, can offer valuable lessons for optimizing your own Airbnb operations in Lower Largo.
Dive Deeper: Advanced Lower Largo STR Market Data (2025)
Ready to unlock more insights? AirROI provides access to advanced metrics and comprehensive Airbnb data for Lower Largo. Explore detailed analytics beyond this report to refine your investment strategy, optimize pricing, and maximize your vacation rental profits.
Explore Advanced MetricsLower Largo Short-Term Rental Market Composition (2025): Property & Room Types
Room Type Distribution
Property Type Distribution
Market Composition Insights for Lower Largo
- The Lower Largo Airbnb market composition is heavily skewed towards Entire Home/Apt listings, which make up 95.8% of the 24 active rentals. This indicates strong guest preference for privacy and space.
- Looking at the property type distribution in Lower Largo, House properties are the most common (54.2%), reflecting the local real estate landscape.
- Houses represent a significant 54.2% portion, catering likely to families or larger groups.
- Smaller segments like others (combined 4.2%) offer potential for unique stay experiences.
Lower Largo Airbnb Room Capacity Analysis (2025): Bedroom Distribution
Distribution of Listings by Number of Bedrooms
Room Capacity Insights for Lower Largo
- The dominant room capacity in Lower Largo is 2 bedrooms listings, making up 29.2% of the market. This suggests a strong demand for properties suitable for couples or solo travelers.
- Together, 2 bedrooms and 3 bedrooms properties represent 58.4% of the active Airbnb listings in Lower Largo, indicating a high concentration in these sizes.
- A significant 37.6% of listings offer 3+ bedrooms, catering to larger groups and families seeking more space in Lower Largo.
Lower Largo Vacation Rental Guest Capacity Trends (2025)
Distribution of Listings by Guest Capacity
Guest Capacity Insights for Lower Largo
- The most common guest capacity trend in Lower Largo vacation rentals is listings accommodating 4 guests (33.3%). This suggests the primary traveler segment is likely small families or groups.
- Properties designed for 4 guests and 6 guests dominate the Lower Largo STR market, accounting for 62.5% of listings.
- 37.5% of properties accommodate 6+ guests, serving the market segment for larger families or group travel in Lower Largo.
- On average, properties in Lower Largo are equipped to host 4.4 guests.
Lower Largo Airbnb Booking Patterns (2025): Available vs. Booked Days
Available Days Distribution
Booked Days Distribution
Booking Pattern Insights for Lower Largo
- The most common availability pattern in Lower Largo falls within the 91-180 days range, representing 33.3% of listings. This suggests many properties have significant open periods on their calendars.
- Approximately 58.4% of listings show high availability (181+ days open annually), indicating potential for increased bookings or specific owner usage patterns.
- For booked days, the 181-270 days range is most frequent in Lower Largo (33.3%), reflecting common guest stay durations or potential owner blocking patterns.
- A notable 41.6% of properties secure long booking periods (181+ days booked per year), highlighting successful long-term rental strategies or significant owner usage.
Lower Largo Airbnb Minimum Stay Requirements Analysis
Distribution of Listings by Minimum Night Requirement
1 Night
4 listings
19% of total
2 Nights
5 listings
23.8% of total
3 Nights
4 listings
19% of total
4-6 Nights
5 listings
23.8% of total
30+ Nights
3 listings
14.3% of total
Key Insights
- The most prevalent minimum stay requirement in Lower Largo is 2 Nights, adopted by 23.8% of listings. This highlights the market's preference for shorter, flexible bookings.
- A significant segment (14.3%) caters to monthly stays (30+ nights) in Lower Largo, pointing to opportunities in the extended-stay market.
Recommendations
- Align with the market by considering a 2 Nights minimum stay, as 23.8% of Lower Largo hosts use this setting.
- If feasible, allowing 1-night stays, especially midweek or during low season, could capture last-minute bookings, as only 19% currently do.
- Explore offering discounts for stays of 30+ nights to attract the 14.3% of the market seeking extended stays.
- Adjust minimum nights based on seasonality – potentially shorter during low season and longer during peak demand periods in Lower Largo.
Lower Largo Airbnb Cancellation Policy Trends Analysis (2025)
Super Strict 30 Days
3 listings
13.6% of total
Super Strict 60 Days
1 listings
4.5% of total
Moderate
7 listings
31.8% of total
Firm
5 listings
22.7% of total
Strict
6 listings
27.3% of total
Cancellation Policy Insights for Lower Largo
- The prevailing Airbnb cancellation policy trend in Lower Largo is Moderate, used by 31.8% of listings.
- There's a relatively balanced mix between guest-friendly (31.8%) and stricter (50.0%) policies, offering choices for different guest needs.
Recommendations for Hosts
- Consider adopting a Moderate policy to align with the 31.8% market standard in Lower Largo.
- Regularly review your cancellation policy against competitors and market demand shifts in Lower Largo.
Lower Largo STR Booking Lead Time Analysis (2025)
Average Booking Lead Time by Month
Booking Lead Time Insights for Lower Largo
- The overall average booking lead time for vacation rentals in Lower Largo is 84 days.
- Guests book furthest in advance for stays during August (average 143 days), likely coinciding with peak travel demand or local events.
- The shortest booking windows occur for stays in March (average 33 days), indicating more last-minute travel plans during this time.
- Seasonally, Summer (131 days avg.) sees the longest lead times, while Spring (76 days avg.) has the shortest, reflecting typical travel planning cycles.
Recommendations for Hosts
- Use the overall average lead time (84 days) as a baseline for your pricing and availability strategy in Lower Largo.
- For August stays, consider implementing length-of-stay discounts or slightly higher rates for bookings made less than 143 days out to capitalize on advance planning.
- Target marketing efforts for the Summer season well in advance (at least 131 days) to capture early planners.
- Monitor your own booking lead times against these Lower Largo averages to identify opportunities for dynamic pricing adjustments.
Popular & Essential Airbnb Amenities in Lower Largo (2025)
Amenity Prevalence
Amenity Insights for Lower Largo
- Essential amenities in Lower Largo that guests expect include: Smoke alarm, Wifi, Carbon monoxide alarm, Heating, Kitchen, TV. Lacking these (any) could significantly impact bookings.
- Popular amenities like Private entrance, Hair dryer, Iron are common but not universal. Offering these can provide a competitive edge.
Recommendations for Hosts
- Ensure your listing includes all essential amenities for Lower Largo: Smoke alarm, Wifi, Carbon monoxide alarm, Heating, Kitchen, TV.
- Prioritize adding missing essentials: Carbon monoxide alarm, Heating, Kitchen, TV.
- Consider adding popular differentiators like Private entrance or Hair dryer to increase appeal.
- Highlight unique or less common amenities you offer (e.g., hot tub, dedicated workspace, EV charger) in your listing description and photos.
- Regularly check competitor amenities in Lower Largo to stay competitive.
Lower Largo Airbnb Guest Demographics & Profile Analysis (2025)
Guest Profile Summary for Lower Largo
- The typical guest profile for Airbnb in Lower Largo consists of primarily domestic travelers (75%), often arriving from nearby Scotland, typically belonging to the Post-2000s (Gen Z/Alpha) group (50%), primarily speaking English or French.
- Domestic travelers account for 74.7% of guests.
- Key international markets include United Kingdom (74.7%) and United States (14%).
- Top languages spoken are English (70.6%) followed by French (8.4%).
- A significant demographic segment is the Post-2000s (Gen Z/Alpha) group, representing 50% of guests.
Recommendations for Hosts
- Target domestic marketing efforts towards travelers from Scotland and England.
- Tailor amenities and listing descriptions to appeal to the dominant Post-2000s (Gen Z/Alpha) demographic (e.g., highlight fast WiFi, smart home features, local guides).
- Highlight unique local experiences or amenities relevant to the primary guest profile.
- Consider seasonal promotions aligned with peak travel times for key origin markets.
Nearby Short-Term Rental Market Comparison
How does the Lower Largo Airbnb market stack up against its neighbors? Compare key performance metrics like average monthly revenue, ADR, and occupancy rates in surrounding areas to understand the broader regional STR landscape.
| Market | Active Properties | Monthly Revenue | Daily Rate | Avg. Occupancy |
|---|---|---|---|---|
| Gorebridge | 12 | $6,209 | $493.62 | 54% |
| Bridge of Cally | 16 | $5,839 | $566.24 | 50% |
| City of Edinburgh | 4,312 | $4,528 | $274.67 | 61% |
| Kenmore | 10 | $4,507 | $430.34 | 41% |
| Insh | 14 | $4,473 | $289.96 | 63% |
| Kielder | 12 | $4,215 | $329.21 | 53% |
| Auchtermuchty | 11 | $3,979 | $365.72 | 50% |
| Gleneagles | 10 | $3,964 | $284.15 | 45% |
| Leuchars | 16 | $3,949 | $400.90 | 43% |
| St Andrews | 359 | $3,908 | $373.13 | 50% |