Livingston Airbnb Market Analysis 2025: Short Term Rental Data & Vacation Rental Statistics in Scotland, United Kingdom
Is Airbnb profitable in Livingston in 2025? Explore comprehensive Airbnb analytics for Livingston, Scotland, United Kingdom to uncover income potential. This 2025 STR market report for Livingston, based on AirROI data from April 2024 to March 2025, reveals key trends in the niche market of 28 active listings.
Whether you're considering an Airbnb investment in Livingston, optimizing your existing vacation rental, or exploring rental arbitrage opportunities, understanding the Livingston Airbnb data is crucial. Understanding the local regulations is key to maximizing your short term rental income potential. Let's dive into the specifics.
Key Livingston Airbnb Performance Metrics Overview
Monthly Airbnb Revenue Variations & Income Potential in Livingston (2025)
Understanding the monthly revenue variations for Airbnb listings in Livingston is key to maximizing your short term rental income potential. Seasonality significantly impacts earnings. Our analysis, based on data from the past 12 months, shows that the peak revenue month for STRs in Livingston is typically July, while February often presents the lowest earnings, highlighting opportunities for strategic pricing adjustments during shoulder and low seasons. Explore the typical Airbnb income in Livingston across different performance tiers:
- Best-in-class properties (Top 10%) achieve $6,921+ monthly, often utilizing dynamic pricing and superior guest experiences.
- Strong performing properties (Top 25%) earn $3,800 or more, indicating effective management and desirable locations/amenities.
- Typical properties (Median) generate around $2,455 per month, representing the average market performance.
- Entry-level properties (Bottom 25%) see earnings around $1,326, often with potential for optimization.
Average Monthly Airbnb Earnings Trend in Livingston
Livingston Airbnb Occupancy Rate Trends (2025)
Maximize your bookings by understanding the Livingston STR occupancy trends. Seasonal demand shifts significantly influence how often properties are booked. Typically, Julysees the highest demand (peak season occupancy), while January experiences the lowest (low season). Effective strategies, like adjusting minimum stays or offering promotions, can boost occupancy during slower periods. Here's how different property tiers perform in Livingston:
- Best-in-class properties (Top 10%) achieve 90%+ occupancy, indicating high desirability and potentially optimized availability.
- Strong performing properties (Top 25%) maintain 77% or higher occupancy, suggesting good market fit and guest satisfaction.
- Typical properties (Median) have an occupancy rate around 59%.
- Entry-level properties (Bottom 25%) average 32% occupancy, potentially facing higher vacancy.
Average Monthly Occupancy Rate Trend in Livingston
Average Daily Rate (ADR) Airbnb Trends in Livingston (2025)
Effective short term rental pricing strategy in Livingston involves understanding monthly ADR fluctuations. The Average Daily Rate (ADR) for Airbnb in Livingston typically peaks in December and dips lowest during April. Leveraging Airbnb dynamic pricing tools or strategies based on this seasonality can significantly boost revenue. Here's a look at the typical nightly rates achieved:
- Best-in-class properties (Top 10%) command rates of $273+ per night, often due to premium features or locations.
- Strong performing properties (Top 25%) achieve nightly rates of $192 or more.
- Typical properties (Median) charge around $118 per night.
- Entry-level properties (Bottom 25%) earn around $78 per night.
Average Daily Rate (ADR) Trend by Month in Livingston
Get Live Livingston Market Intelligence 👇

Explore Real-time Analytics
Airbnb Seasonality Analysis & Trends in Livingston (2025)
Peak Season (July, May, June)
- Revenue averages $3,885 per month
- Occupancy rates average 66.1%
- Daily rates average $133
Shoulder Season
- Revenue averages $3,112 per month
- Occupancy maintains around 58.0%
- Daily rates hold near $141
Low Season (January, February, March)
- Revenue drops to average $1,911 per month
- Occupancy decreases to average 40.9%
- Daily rates adjust to average $151
Seasonality Insights for Livingston
- The Airbnb seasonality in Livingston shows highly seasonal trends requiring careful strategy. While the sections above show seasonal averages, it's also insightful to look at the extremes:
- During the high season, the absolute peak month showcases Livingston's highest earning potential, with monthly revenues capable of climbing to $3,940, occupancy reaching a high of 71.2%, and ADRs peaking at $169.
- Conversely, the slowest single month of the year, typically falling within the low season, marks the market's lowest point. In this month, revenue might dip to $1,741, occupancy could drop to 38.4%, and ADRs may adjust down to $124.
- Understanding both the seasonal averages and these monthly peaks and troughs in revenue, occupancy, and ADR is crucial for maximizing your Airbnb profit potential in Livingston.
Seasonal Strategies for Maximizing Profit
- Peak Season: Maximize revenue through premium pricing and potentially longer minimum stays. Ensure high availability.
- Low Season: Offer competitive pricing, special promotions (e.g., extended stay discounts), and flexible cancellation policies. Target off-season travelers like remote workers or budget-conscious guests.
- Shoulder Seasons: Implement dynamic pricing that balances peak and low rates. Target weekend travelers or specific events. Offer slightly more flexible terms than peak season.
- Regularly analyze your own performance against these Livingston seasonality benchmarks and adjust your pricing and availability strategy accordingly.
Best Areas for Airbnb Investment in Livingston (2025)
Exploring the top neighborhoods for short-term rentals in Livingston? This section highlights key areas, outlining why they are attractive for hosts and guests, along with notable local attractions. Consider these locations based on your target guest profile and investment strategy.
| Neighborhood / Area | Why Host Here? (Target Guests & Appeal) | Key Attractions & Landmarks |
|---|---|---|
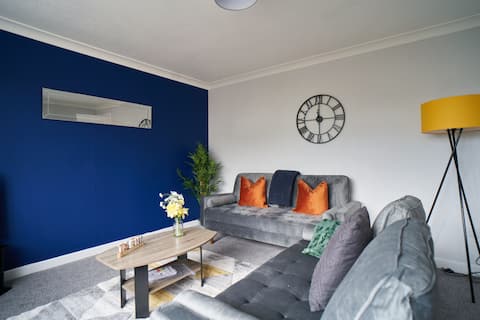
| Town Centre | The vibrant heart of Livingston, offering shopping, dining, and cultural experiences. Ideal for tourists who desire convenience, with easy access to local amenities and transportation. | Livingston Designer Outlet, Howden Park Centre, Livingston Shopping Centre, Almond Valley Heritage Centre, Civic Centre |
| Deans | A residential area known for its green spaces and peaceful environment. Great for families and those looking for a relaxing stay away from the hustle and bustle. | Deans Community High School, Deans Park, Almond River, Livingston Park |
| Murieston | A charming suburban area with scenic walks and a friendly community atmosphere. Attracts guests looking for a retreat close to nature yet near urban amenities. | Murieston Trail, Murieston Park, Linhouse Glen |
| Ladywell | A well-connected area close to local schools and parks. Ideal for families or business travelers seeking comfortable short-term accommodation. | Ladywell Park, Livingston Golf Club, West Lothian College |
| Pumpherston | A quaint village atmosphere offering a peaceful retreat with easy access to Livingston's urban attractions. Popular for those looking to escape the city buzz. | Pumpherston Golf Club, St. John’s Church, local parks |
| East Calder | A charming village that provides a quiet stay with community vibes. Frequent visitors are those looking to explore nearby West Lothian or the countryside. | East Calder Park, local cafes and pubs, Cala Homes Green Space |
| Howden | A primarily residential area with a close-knit community and easy access to local amenities. Suitable for guests who prefer a suburban feel with nearby entertainment options. | Howden Park, Howden House, local shops and eateries |
| Whitburn | A nearby town known for its local character and rich history. Hosts visitors interested in exploring the wider West Lothian area. | Whitburn Academy, local historical sites, The Livingston Skate Park |
Understanding Airbnb License Requirements & STR Laws in Livingston (2025)
With 11% of listings showing registration in 2025, understanding potential Airbnb license requirements is crucial in Livingston. Always verify the latest short term rental regulations and Airbnb license requirements directly with local government authorities for Livingston to ensure full compliance before hosting.
(Source: AirROI data, 2025, based on 11% licensed listings)
Top Performing Airbnb Properties in Livingston (2025)
Benchmark your potential! Explore examples of top-performing Airbnb properties in Livingstonbased on Trailing Twelve Month (TTM) revenue. Analyze their characteristics, revenue, occupancy rate, and ADR to understand what drives success in this market.
Modern 4 Bed House-Free Parking
Entire Place • 4 bedrooms
Livingston North Station Apartment. Near Edinburgh
Entire Place • 3 bedrooms
Cheerful Stays: Livingston - 4 Bedroom 3 Bath home
Entire Place • 4 bedrooms
Livingston 4 Bed Car Space
Entire Place • 4 bedrooms
Spacious 4 Bedroom Home in Central Livingston
Entire Place • 4 bedrooms
Howden Home from Home
Entire Place • 4 bedrooms
Note: Performance varies based on location, size, amenities, seasonality, and management quality. Data reflects the past 12 months.
Top Performing Airbnb Hosts in Livingston (2025)
Learn from the best! This table showcases top-performing Airbnb hosts in Livingston based on the number of properties managed and estimated total revenue over the past year. Analyze their scale and performance metrics.
| Host Name | Properties | Grossing Revenue | Stay Reviews | Avg Rating |
|---|---|---|---|---|
| Carol | 5 | $165,294 | 191 | 4.93/5.0 |
| Jozef | 1 | $103,572 | 42 | 4.62/5.0 |
| John | 3 | $80,579 | 72 | 4.58/5.0 |
| Damola | 1 | $80,443 | 25 | 4.56/5.0 |
| Mark | 2 | $75,689 | 259 | 4.96/5.0 |
| Yatin | 1 | $68,223 | 72 | 4.65/5.0 |
| Map Short Stays | 2 | $63,100 | 7 | 2.21/5.0 |
| Host #466328896 | 1 | $51,516 | 15 | 3.93/5.0 |
| Kumar | 3 | $37,630 | 43 | 3.08/5.0 |
| Kumar | 2 | $36,713 | 20 | 4.38/5.0 |
Analyzing the strategies of top hosts, such as their property selection, pricing, and guest communication, can offer valuable lessons for optimizing your own Airbnb operations in Livingston.
Dive Deeper: Advanced Livingston STR Market Data (2025)
Ready to unlock more insights? AirROI provides access to advanced metrics and comprehensive Airbnb data for Livingston. Explore detailed analytics beyond this report to refine your investment strategy, optimize pricing, and maximize your vacation rental profits.
Explore Advanced MetricsLivingston Short-Term Rental Market Composition (2025): Property & Room Types
Room Type Distribution
Property Type Distribution
Market Composition Insights for Livingston
- The Livingston Airbnb market composition is heavily skewed towards Entire Home/Apt listings, which make up 78.6% of the 28 active rentals. This indicates strong guest preference for privacy and space.
- Looking at the property type distribution in Livingston, House properties are the most common (64.3%), reflecting the local real estate landscape.
- Houses represent a significant 64.3% portion, catering likely to families or larger groups.
Livingston Airbnb Room Capacity Analysis (2025): Bedroom Distribution
Distribution of Listings by Number of Bedrooms
Room Capacity Insights for Livingston
- The dominant room capacity in Livingston is 2 bedrooms listings, making up 32.1% of the market. This suggests a strong demand for properties suitable for couples or solo travelers.
- Together, 2 bedrooms and 4 bedrooms properties represent 57.1% of the active Airbnb listings in Livingston, indicating a high concentration in these sizes.
- A significant 39.3% of listings offer 3+ bedrooms, catering to larger groups and families seeking more space in Livingston.
Livingston Vacation Rental Guest Capacity Trends (2025)
Distribution of Listings by Guest Capacity
Guest Capacity Insights for Livingston
- The most common guest capacity trend in Livingston vacation rentals is listings accommodating 8+ guests (17.9%). This suggests the primary traveler segment is likely larger groups.
- Properties designed for 8+ guests and 5 guests dominate the Livingston STR market, accounting for 35.8% of listings.
- 25.0% of properties accommodate 6+ guests, serving the market segment for larger families or group travel in Livingston.
- On average, properties in Livingston are equipped to host 3.9 guests.
Livingston Airbnb Booking Patterns (2025): Available vs. Booked Days
Available Days Distribution
Booked Days Distribution
Booking Pattern Insights for Livingston
- The most common availability pattern in Livingston falls within the 91-180 days range, representing 35.7% of listings. This suggests many properties have significant open periods on their calendars.
- Approximately 42.9% of listings show high availability (181+ days open annually), indicating potential for increased bookings or specific owner usage patterns.
- For booked days, the 181-270 days range is most frequent in Livingston (39.3%), reflecting common guest stay durations or potential owner blocking patterns.
- A notable 60.7% of properties secure long booking periods (181+ days booked per year), highlighting successful long-term rental strategies or significant owner usage.
Livingston Airbnb Minimum Stay Requirements Analysis
Distribution of Listings by Minimum Night Requirement
1 Night
3 listings
12.5% of total
2 Nights
9 listings
37.5% of total
3 Nights
2 listings
8.3% of total
4-6 Nights
5 listings
20.8% of total
7-29 Nights
1 listings
4.2% of total
30+ Nights
4 listings
16.7% of total
Key Insights
- The most prevalent minimum stay requirement in Livingston is 2 Nights, adopted by 37.5% of listings. This highlights the market's preference for shorter, flexible bookings.
- A significant segment (16.7%) caters to monthly stays (30+ nights) in Livingston, pointing to opportunities in the extended-stay market.
Recommendations
- Align with the market by considering a 2 Nights minimum stay, as 37.5% of Livingston hosts use this setting.
- If feasible, allowing 1-night stays, especially midweek or during low season, could capture last-minute bookings, as only 12.5% currently do.
- A 2-night minimum appears standard (37.5%). Consider this for weekends or peak periods.
- Explore offering discounts for stays of 30+ nights to attract the 16.7% of the market seeking extended stays.
- Adjust minimum nights based on seasonality – potentially shorter during low season and longer during peak demand periods in Livingston.
Livingston Airbnb Cancellation Policy Trends Analysis (2025)
Flexible
10 listings
43.5% of total
Moderate
6 listings
26.1% of total
Firm
2 listings
8.7% of total
Strict
5 listings
21.7% of total
Cancellation Policy Insights for Livingston
- The prevailing Airbnb cancellation policy trend in Livingston is Flexible, used by 43.5% of listings.
- There's a relatively balanced mix between guest-friendly (69.6%) and stricter (30.4%) policies, offering choices for different guest needs.
Recommendations for Hosts
- Consider adopting a Flexible policy to align with the 43.5% market standard in Livingston.
- Regularly review your cancellation policy against competitors and market demand shifts in Livingston.
Livingston STR Booking Lead Time Analysis (2025)
Average Booking Lead Time by Month
Booking Lead Time Insights for Livingston
- The overall average booking lead time for vacation rentals in Livingston is 53 days.
- Guests book furthest in advance for stays during June (average 94 days), likely coinciding with peak travel demand or local events.
- The shortest booking windows occur for stays in January (average 40 days), indicating more last-minute travel plans during this time.
- Seasonally, Summer (78 days avg.) sees the longest lead times, while Winter (44 days avg.) has the shortest, reflecting typical travel planning cycles.
Recommendations for Hosts
- Use the overall average lead time (53 days) as a baseline for your pricing and availability strategy in Livingston.
- For June stays, consider implementing length-of-stay discounts or slightly higher rates for bookings made less than 94 days out to capitalize on advance planning.
- Target marketing efforts for the Summer season well in advance (at least 78 days) to capture early planners.
- Monitor your own booking lead times against these Livingston averages to identify opportunities for dynamic pricing adjustments.
Popular & Essential Airbnb Amenities in Livingston (2025)
Amenity Prevalence
Amenity Insights for Livingston
- Essential amenities in Livingston that guests expect include: Smoke alarm, TV, Heating, Wifi, Hot water. Lacking these (any) could significantly impact bookings.
- Popular amenities like Free parking on premises, Washer, Kitchen are common but not universal. Offering these can provide a competitive edge.
Recommendations for Hosts
- Ensure your listing includes all essential amenities for Livingston: Smoke alarm, TV, Heating, Wifi, Hot water.
- Prioritize adding missing essentials: TV, Heating, Wifi, Hot water.
- Consider adding popular differentiators like Free parking on premises or Washer to increase appeal.
- Highlight unique or less common amenities you offer (e.g., hot tub, dedicated workspace, EV charger) in your listing description and photos.
- Regularly check competitor amenities in Livingston to stay competitive.
Livingston Airbnb Guest Demographics & Profile Analysis (2025)
Guest Profile Summary for Livingston
- The typical guest profile for Airbnb in Livingston consists of a mix of domestic (46%) and international guests, with top international origins including United States, typically belonging to the Post-2000s (Gen Z/Alpha) group (50%), primarily speaking English or French.
- Domestic travelers account for 45.7% of guests.
- Key international markets include United Kingdom (45.7%) and United States (10.4%).
- Top languages spoken are English (55.9%) followed by French (7.9%).
- A significant demographic segment is the Post-2000s (Gen Z/Alpha) group, representing 50% of guests.
Recommendations for Hosts
- Balance marketing efforts between domestic and international channels based on the guest mix.
- Tailor amenities and listing descriptions to appeal to the dominant Post-2000s (Gen Z/Alpha) demographic (e.g., highlight fast WiFi, smart home features, local guides).
- Highlight unique local experiences or amenities relevant to the primary guest profile.
- Consider seasonal promotions aligned with peak travel times for key origin markets.
Nearby Short-Term Rental Market Comparison
How does the Livingston Airbnb market stack up against its neighbors? Compare key performance metrics like average monthly revenue, ADR, and occupancy rates in surrounding areas to understand the broader regional STR landscape.
| Market | Active Properties | Monthly Revenue | Daily Rate | Avg. Occupancy |
|---|---|---|---|---|
| Galston | 11 | $7,951 | $676.77 | 46% |
| Fearnan | 19 | $6,440 | $421.92 | 53% |
| Gorebridge | 12 | $6,209 | $493.62 | 54% |
| Bridge of Cally | 16 | $5,839 | $566.24 | 50% |
| Arrochar | 33 | $5,045 | $339.11 | 56% |
| Acharn | 10 | $4,813 | $278.43 | 57% |
| Cartmel Fell | 17 | $4,719 | $331.68 | 52% |
| Croftamie | 19 | $4,609 | $267.39 | 52% |
| Carrick Castle | 11 | $4,591 | $586.01 | 42% |
| Casterton | 11 | $4,578 | $300.82 | 51% |