Lairg Airbnb Market Analysis 2025: Short Term Rental Data & Vacation Rental Statistics in Scotland, United Kingdom
Is Airbnb profitable in Lairg in 2025? Explore comprehensive Airbnb analytics for Lairg, Scotland, United Kingdom to uncover income potential. This 2025 STR market report for Lairg, based on AirROI data from April 2024 to March 2025, reveals key trends in the niche market of 19 active listings.
Whether you're considering an Airbnb investment in Lairg, optimizing your existing vacation rental, or exploring rental arbitrage opportunities, understanding the Lairg Airbnb data is crucial. Leveraging the low regulation environment is key to maximizing your short term rental income potential. Let's dive into the specifics.
Key Lairg Airbnb Performance Metrics Overview
Monthly Airbnb Revenue Variations & Income Potential in Lairg (2025)
Understanding the monthly revenue variations for Airbnb listings in Lairg is key to maximizing your short term rental income potential. Seasonality significantly impacts earnings. Our analysis, based on data from the past 12 months, shows that the peak revenue month for STRs in Lairg is typically August, while February often presents the lowest earnings, highlighting opportunities for strategic pricing adjustments during shoulder and low seasons. Explore the typical Airbnb income in Lairg across different performance tiers:
- Best-in-class properties (Top 10%) achieve $6,645+ monthly, often utilizing dynamic pricing and superior guest experiences.
- Strong performing properties (Top 25%) earn $3,305 or more, indicating effective management and desirable locations/amenities.
- Typical properties (Median) generate around $2,150 per month, representing the average market performance.
- Entry-level properties (Bottom 25%) see earnings around $1,533, often with potential for optimization.
Average Monthly Airbnb Earnings Trend in Lairg
Lairg Airbnb Occupancy Rate Trends (2025)
Maximize your bookings by understanding the Lairg STR occupancy trends. Seasonal demand shifts significantly influence how often properties are booked. Typically, Augustsees the highest demand (peak season occupancy), while January experiences the lowest (low season). Effective strategies, like adjusting minimum stays or offering promotions, can boost occupancy during slower periods. Here's how different property tiers perform in Lairg:
- Best-in-class properties (Top 10%) achieve 68%+ occupancy, indicating high desirability and potentially optimized availability.
- Strong performing properties (Top 25%) maintain 60% or higher occupancy, suggesting good market fit and guest satisfaction.
- Typical properties (Median) have an occupancy rate around 43%.
- Entry-level properties (Bottom 25%) average 30% occupancy, potentially facing higher vacancy.
Average Monthly Occupancy Rate Trend in Lairg
Average Daily Rate (ADR) Airbnb Trends in Lairg (2025)
Effective short term rental pricing strategy in Lairg involves understanding monthly ADR fluctuations. The Average Daily Rate (ADR) for Airbnb in Lairg typically peaks in July and dips lowest during November. Leveraging Airbnb dynamic pricing tools or strategies based on this seasonality can significantly boost revenue. Here's a look at the typical nightly rates achieved:
- Best-in-class properties (Top 10%) command rates of $451+ per night, often due to premium features or locations.
- Strong performing properties (Top 25%) achieve nightly rates of $203 or more.
- Typical properties (Median) charge around $132 per night.
- Entry-level properties (Bottom 25%) earn around $104 per night.
Average Daily Rate (ADR) Trend by Month in Lairg
Get Live Lairg Market Intelligence 👇

Explore Real-time Analytics
Airbnb Seasonality Analysis & Trends in Lairg (2025)
Peak Season (August, July, September)
- Revenue averages $5,197 per month
- Occupancy rates average 72.4%
- Daily rates average $215
Shoulder Season
- Revenue averages $2,778 per month
- Occupancy maintains around 43.2%
- Daily rates hold near $208
Low Season (January, February, March)
- Revenue drops to average $1,110 per month
- Occupancy decreases to average 23.7%
- Daily rates adjust to average $196
Seasonality Insights for Lairg
- The Airbnb seasonality in Lairg shows highly seasonal trends requiring careful strategy. While the sections above show seasonal averages, it's also insightful to look at the extremes:
- During the high season, the absolute peak month showcases Lairg's highest earning potential, with monthly revenues capable of climbing to $5,803, occupancy reaching a high of 79.2%, and ADRs peaking at $227.
- Conversely, the slowest single month of the year, typically falling within the low season, marks the market's lowest point. In this month, revenue might dip to $1,037, occupancy could drop to 22.6%, and ADRs may adjust down to $193.
- Understanding both the seasonal averages and these monthly peaks and troughs in revenue, occupancy, and ADR is crucial for maximizing your Airbnb profit potential in Lairg.
Seasonal Strategies for Maximizing Profit
- Peak Season: Maximize revenue through premium pricing and potentially longer minimum stays. Ensure high availability.
- Low Season: Offer competitive pricing, special promotions (e.g., extended stay discounts), and flexible cancellation policies. Target off-season travelers like remote workers or budget-conscious guests.
- Shoulder Seasons: Implement dynamic pricing that balances peak and low rates. Target weekend travelers or specific events. Offer slightly more flexible terms than peak season.
- Regularly analyze your own performance against these Lairg seasonality benchmarks and adjust your pricing and availability strategy accordingly.
Best Areas for Airbnb Investment in Lairg (2025)
Exploring the top neighborhoods for short-term rentals in Lairg? This section highlights key areas, outlining why they are attractive for hosts and guests, along with notable local attractions. Consider these locations based on your target guest profile and investment strategy.
| Neighborhood / Area | Why Host Here? (Target Guests & Appeal) | Key Attractions & Landmarks |
|---|---|---|
| Lairg Village | A charming Highland village with a picturesque setting by the loch. It's a great base for exploring the North Highlands and attracts tourists seeking tranquility and nature. | Loch Shin, Lairg Old Mill, Lairg Gallery, Path to the Falls of Shin, Kyle of Sutherland, The North Coast 500 route |
| Loch Shin | Known for its stunning views and outdoor activities, Loch Shin is perfect for those who love fishing, boating, and walking. It's a hotspot for adventure seekers. | Fishing at Loch Shin, Walking routes around the loch, Boat trips, Picnic areas, Wildlife watching, Photography opportunities |
| Strathnaver | Rich in history and culture, Strathnaver is home to ancient sites and beautiful landscapes. It attracts visitors interested in heritage and the great outdoors. | Strathnaver Museum, Castle Varrich, Scourie Beach, The NC500 route, Nature trails, Historic ruins |
| Bonar Bridge | A scenic village located at the junction of the River Carron and the Dornoch Firth. It's a good location for nature lovers and those seeking outdoor adventures. | Bonar Bridge, Dornoch Firth, River Carron, Hiking trails, Fishing spots, Historic sites |
| Falls of Shin | A beautiful natural attraction known for its salmon leaps and picturesque surroundings. Ideal for nature lovers and family outings. | Viewing platforms, Walking trails, Wildlife spotting, Picnic areas, Visitor center, Fishing opportunities |
| Inveran | A tranquil area at the edge of the River Oykel, popular for fishing and outdoor activities. Suitable for those looking to relax and enjoy nature. | Fishing on the River Oykel, Scenic walks, Picnic spots, Wildlife viewing, Cycling routes, Historic sites nearby |
| Ardgay | A quaint village with good access to the Highlands and the coast, known for its friendly atmosphere and local attractions. | Ardgay Train Station, Local shops, Walking trails, Riverside walks, Highland games, Community events |
| Creich | A rural area with stunning views and local charm, suitable for visitors who want a peaceful retreat in the Highlands. | Creich Church, Beautiful landscapes, Hiking routes, Local wildlife, Nature photography, Cultural events |
Understanding Airbnb License Requirements & STR Laws in Lairg (2025)
While Lairg, Scotland, United Kingdom currently shows low STR regulations, specific Airbnb license requirements might still exist or change. Always verify the latest short term rental regulations and Airbnb license requirements directly with local government authorities for Lairg to ensure full compliance before hosting.
(Source: AirROI data, 2025, based on 5% licensed listings)
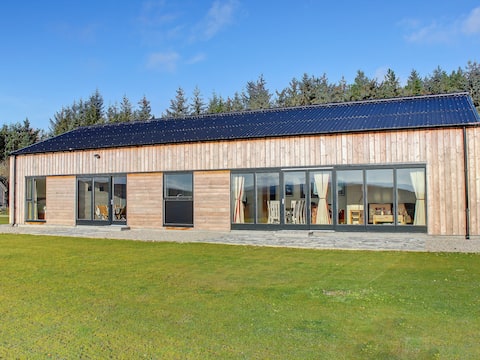
Top Performing Airbnb Properties in Lairg (2025)
Benchmark your potential! Explore examples of top-performing Airbnb properties in Lairgbased on Trailing Twelve Month (TTM) revenue. Analyze their characteristics, revenue, occupancy rate, and ADR to understand what drives success in this market.

Colaboll Farmhouse
Entire Place • 4 bedrooms

Lochview Holiday Let Lairg
Entire Place • 5 bedrooms
Phil's House (suur)
Entire Place • 3 bedrooms
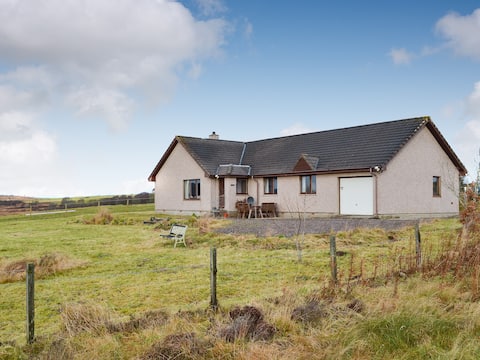
Fair View
Entire Place • 4 bedrooms

Lochside Lodge Pod
Entire Place • 1 bedroom
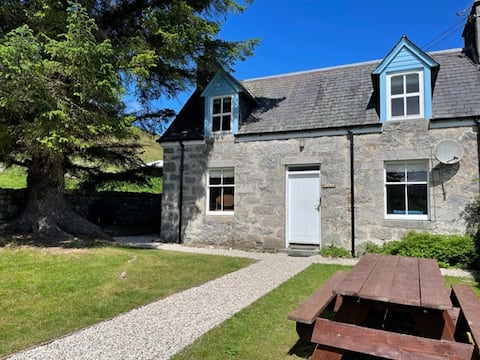
Jock's Cottage in the Highlands Blarich Estate
Entire Place • 3 bedrooms
Note: Performance varies based on location, size, amenities, seasonality, and management quality. Data reflects the past 12 months.
Top Performing Airbnb Hosts in Lairg (2025)
Learn from the best! This table showcases top-performing Airbnb hosts in Lairg based on the number of properties managed and estimated total revenue over the past year. Analyze their scale and performance metrics.
| Host Name | Properties | Grossing Revenue | Stay Reviews | Avg Rating |
|---|---|---|---|---|
| Cottages | 3 | $207,832 | 15 | 3.24/5.0 |
| Robert | 1 | $74,376 | 49 | 4.96/5.0 |
| Louise | 2 | $43,065 | 63 | 4.80/5.0 |
| Jamie | 1 | $32,789 | 7 | 5.00/5.0 |
| Annelie | 1 | $28,705 | 38 | 4.82/5.0 |
| Alan | 1 | $26,980 | 9 | 5.00/5.0 |
| Mandy | 1 | $25,505 | 70 | 4.94/5.0 |
| Jackie | 1 | $19,880 | 208 | 4.84/5.0 |
| Emma | 2 | $19,257 | 69 | 4.94/5.0 |
| Host #258962403 | 1 | $17,604 | 214 | 4.99/5.0 |
Analyzing the strategies of top hosts, such as their property selection, pricing, and guest communication, can offer valuable lessons for optimizing your own Airbnb operations in Lairg.
Dive Deeper: Advanced Lairg STR Market Data (2025)
Ready to unlock more insights? AirROI provides access to advanced metrics and comprehensive Airbnb data for Lairg. Explore detailed analytics beyond this report to refine your investment strategy, optimize pricing, and maximize your vacation rental profits.
Explore Advanced MetricsLairg Short-Term Rental Market Composition (2025): Property & Room Types
Room Type Distribution
Property Type Distribution
Market Composition Insights for Lairg
- The Lairg Airbnb market composition is heavily skewed towards Entire Home/Apt listings, which make up 84.2% of the 19 active rentals. This indicates strong guest preference for privacy and space.
- Looking at the property type distribution in Lairg, House properties are the most common (52.6%), reflecting the local real estate landscape.
- Houses represent a significant 52.6% portion, catering likely to families or larger groups.
- The presence of 5.3% Hotel/Boutique listings indicates integration with traditional hospitality.
Lairg Airbnb Room Capacity Analysis (2025): Bedroom Distribution
Distribution of Listings by Number of Bedrooms
Room Capacity Insights for Lairg
- The dominant room capacity in Lairg is 1 bedroom listings, making up 31.6% of the market. This suggests a strong demand for properties suitable for couples or solo travelers.
- Together, 1 bedroom and 2 bedrooms properties represent 57.9% of the active Airbnb listings in Lairg, indicating a high concentration in these sizes.
- A significant 31.6% of listings offer 3+ bedrooms, catering to larger groups and families seeking more space in Lairg.
Lairg Vacation Rental Guest Capacity Trends (2025)
Distribution of Listings by Guest Capacity
Guest Capacity Insights for Lairg
- The most common guest capacity trend in Lairg vacation rentals is listings accommodating 4 guests (26.3%). This suggests the primary traveler segment is likely small families or groups.
- Properties designed for 4 guests and 2 guests dominate the Lairg STR market, accounting for 47.4% of listings.
- 31.6% of properties accommodate 6+ guests, serving the market segment for larger families or group travel in Lairg.
- On average, properties in Lairg are equipped to host 3.9 guests.
Lairg Airbnb Booking Patterns (2025): Available vs. Booked Days
Available Days Distribution
Booked Days Distribution
Booking Pattern Insights for Lairg
- The most common availability pattern in Lairg falls within the 181-270 days range, representing 57.9% of listings. This suggests many properties have significant open periods on their calendars.
- Approximately 79.0% of listings show high availability (181+ days open annually), indicating potential for increased bookings or specific owner usage patterns.
- For booked days, the 91-180 days range is most frequent in Lairg (57.9%), reflecting common guest stay durations or potential owner blocking patterns.
- A notable 26.3% of properties secure long booking periods (181+ days booked per year), highlighting successful long-term rental strategies or significant owner usage.
Lairg Airbnb Minimum Stay Requirements Analysis
Distribution of Listings by Minimum Night Requirement
1 Night
6 listings
35.3% of total
2 Nights
7 listings
41.2% of total
3 Nights
3 listings
17.6% of total
4-6 Nights
1 listings
5.9% of total
Key Insights
- The most prevalent minimum stay requirement in Lairg is 2 Nights, adopted by 41.2% of listings. This highlights the market's preference for shorter, flexible bookings.
- A strong majority (76.5%) of the Lairg Airbnb data shows acceptance of very short stays (1-2 nights), indicating a dynamic, high-turnover market.
Recommendations
- Align with the market by considering a 2 Nights minimum stay, as 41.2% of Lairg hosts use this setting.
- Adjust minimum nights based on seasonality – potentially shorter during low season and longer during peak demand periods in Lairg.
Lairg Airbnb Cancellation Policy Trends Analysis (2025)
Super Strict 60 Days
3 listings
17.6% of total
Flexible
5 listings
29.4% of total
Moderate
7 listings
41.2% of total
Strict
2 listings
11.8% of total
Cancellation Policy Insights for Lairg
- The prevailing Airbnb cancellation policy trend in Lairg is Moderate, used by 41.2% of listings.
- The market strongly favors guest-friendly terms, with 70.6% of listings offering Flexible or Moderate policies. This suggests guests in Lairg may expect booking flexibility.
Recommendations for Hosts
- Consider adopting a Moderate policy to align with the 41.2% market standard in Lairg.
- Using a Strict policy might deter some guests, as only 11.8% of listings use it. Evaluate if potential revenue protection outweighs possible lower booking rates.
- Regularly review your cancellation policy against competitors and market demand shifts in Lairg.
Lairg STR Booking Lead Time Analysis (2025)
Average Booking Lead Time by Month
Booking Lead Time Insights for Lairg
- The overall average booking lead time for vacation rentals in Lairg is 73 days.
- Guests book furthest in advance for stays during July (average 123 days), likely coinciding with peak travel demand or local events.
- The shortest booking windows occur for stays in February (average 6 days), indicating more last-minute travel plans during this time.
- Seasonally, Summer (110 days avg.) sees the longest lead times, while Winter (52 days avg.) has the shortest, reflecting typical travel planning cycles.
Recommendations for Hosts
- Use the overall average lead time (73 days) as a baseline for your pricing and availability strategy in Lairg.
- For July stays, consider implementing length-of-stay discounts or slightly higher rates for bookings made less than 123 days out to capitalize on advance planning.
- During February, focus on last-minute booking availability and promotions, as guests book with very short notice (6 days avg.).
- Target marketing efforts for the Summer season well in advance (at least 110 days) to capture early planners.
- Monitor your own booking lead times against these Lairg averages to identify opportunities for dynamic pricing adjustments.
Popular & Essential Airbnb Amenities in Lairg (2025)
Amenity Prevalence
Amenity Insights for Lairg
- Essential amenities in Lairg that guests expect include: Smoke alarm. Lacking these (this) could significantly impact bookings.
- Popular amenities like TV, Kitchen, Heating are common but not universal. Offering these can provide a competitive edge.
- Warning: Wifi is not universally provided but is considered essential globally. Ensure reliable Wifi is offered.
Recommendations for Hosts
- Ensure your listing includes all essential amenities for Lairg: Smoke alarm.
- Consider adding popular differentiators like TV or Kitchen to increase appeal.
- Highlight unique or less common amenities you offer (e.g., hot tub, dedicated workspace, EV charger) in your listing description and photos.
- Regularly check competitor amenities in Lairg to stay competitive.
Lairg Airbnb Guest Demographics & Profile Analysis (2025)
Guest Profile Summary for Lairg
- The typical guest profile for Airbnb in Lairg consists of a mix of domestic (57%) and international guests, often arriving from nearby England, typically belonging to the Post-2000s (Gen Z/Alpha) group (50%), primarily speaking English or German.
- Domestic travelers account for 56.9% of guests.
- Key international markets include United Kingdom (56.9%) and Germany (9.7%).
- Top languages spoken are English (56%) followed by German (13.8%).
- A significant demographic segment is the Post-2000s (Gen Z/Alpha) group, representing 50% of guests.
Recommendations for Hosts
- Balance marketing efforts between domestic and international channels based on the guest mix.
- Tailor amenities and listing descriptions to appeal to the dominant Post-2000s (Gen Z/Alpha) demographic (e.g., highlight fast WiFi, smart home features, local guides).
- Highlight unique local experiences or amenities relevant to the primary guest profile.
- Consider seasonal promotions aligned with peak travel times for key origin markets.
Nearby Short-Term Rental Market Comparison
How does the Lairg Airbnb market stack up against its neighbors? Compare key performance metrics like average monthly revenue, ADR, and occupancy rates in surrounding areas to understand the broader regional STR landscape.
| Market | Active Properties | Monthly Revenue | Daily Rate | Avg. Occupancy |
|---|---|---|---|---|
| Kirkhill | 10 | $5,719 | $700.26 | 44% |
| North Kessock | 10 | $5,421 | $380.62 | 58% |
| Foyers | 14 | $5,076 | $274.52 | 64% |
| Whitebridge | 10 | $4,907 | $417.35 | 42% |
| Camuscross | 11 | $4,649 | $300.59 | 61% |
| Insh | 14 | $4,473 | $289.96 | 63% |
| Teangue | 16 | $4,109 | $239.94 | 61% |
| Kyleakin | 18 | $3,902 | $298.12 | 49% |
| Glenelg | 17 | $3,880 | $232.54 | 58% |
| Nethy Bridge | 49 | $3,742 | $259.42 | 52% |