Kyle of Lochalsh Airbnb Market Analysis 2025: Short Term Rental Data & Vacation Rental Statistics in Scotland, United Kingdom
Is Airbnb profitable in Kyle of Lochalsh in 2025? Explore comprehensive Airbnb analytics for Kyle of Lochalsh, Scotland, United Kingdom to uncover income potential. This 2025 STR market report for Kyle of Lochalsh, based on AirROI data from April 2024 to March 2025, reveals key trends in the niche market of 21 active listings.
Whether you're considering an Airbnb investment in Kyle of Lochalsh, optimizing your existing vacation rental, or exploring rental arbitrage opportunities, understanding the Kyle of Lochalsh Airbnb data is crucial. Understanding the local regulations is key to maximizing your short term rental income potential. Let's dive into the specifics.
Key Kyle of Lochalsh Airbnb Performance Metrics Overview
Monthly Airbnb Revenue Variations & Income Potential in Kyle of Lochalsh (2025)
Understanding the monthly revenue variations for Airbnb listings in Kyle of Lochalsh is key to maximizing your short term rental income potential. Seasonality significantly impacts earnings. Our analysis, based on data from the past 12 months, shows that the peak revenue month for STRs in Kyle of Lochalsh is typically August, while March often presents the lowest earnings, highlighting opportunities for strategic pricing adjustments during shoulder and low seasons. Explore the typical Airbnb income in Kyle of Lochalsh across different performance tiers:
- Best-in-class properties (Top 10%) achieve $6,334+ monthly, often utilizing dynamic pricing and superior guest experiences.
- Strong performing properties (Top 25%) earn $4,051 or more, indicating effective management and desirable locations/amenities.
- Typical properties (Median) generate around $2,864 per month, representing the average market performance.
- Entry-level properties (Bottom 25%) see earnings around $1,967, often with potential for optimization.
Average Monthly Airbnb Earnings Trend in Kyle of Lochalsh
Kyle of Lochalsh Airbnb Occupancy Rate Trends (2025)
Maximize your bookings by understanding the Kyle of Lochalsh STR occupancy trends. Seasonal demand shifts significantly influence how often properties are booked. Typically, Augustsees the highest demand (peak season occupancy), while March experiences the lowest (low season). Effective strategies, like adjusting minimum stays or offering promotions, can boost occupancy during slower periods. Here's how different property tiers perform in Kyle of Lochalsh:
- Best-in-class properties (Top 10%) achieve 82%+ occupancy, indicating high desirability and potentially optimized availability.
- Strong performing properties (Top 25%) maintain 74% or higher occupancy, suggesting good market fit and guest satisfaction.
- Typical properties (Median) have an occupancy rate around 60%.
- Entry-level properties (Bottom 25%) average 40% occupancy, potentially facing higher vacancy.
Average Monthly Occupancy Rate Trend in Kyle of Lochalsh
Average Daily Rate (ADR) Airbnb Trends in Kyle of Lochalsh (2025)
Effective short term rental pricing strategy in Kyle of Lochalsh involves understanding monthly ADR fluctuations. The Average Daily Rate (ADR) for Airbnb in Kyle of Lochalsh typically peaks in December and dips lowest during April. Leveraging Airbnb dynamic pricing tools or strategies based on this seasonality can significantly boost revenue. Here's a look at the typical nightly rates achieved:
- Best-in-class properties (Top 10%) command rates of $283+ per night, often due to premium features or locations.
- Strong performing properties (Top 25%) achieve nightly rates of $211 or more.
- Typical properties (Median) charge around $139 per night.
- Entry-level properties (Bottom 25%) earn around $112 per night.
Average Daily Rate (ADR) Trend by Month in Kyle of Lochalsh
Get Live Kyle of Lochalsh Market Intelligence 👇

Explore Real-time Analytics
Airbnb Seasonality Analysis & Trends in Kyle of Lochalsh (2025)
Peak Season (August, July, June)
- Revenue averages $5,219 per month
- Occupancy rates average 80.3%
- Daily rates average $165
Shoulder Season
- Revenue averages $3,538 per month
- Occupancy maintains around 59.8%
- Daily rates hold near $169
Low Season (January, March, November)
- Revenue drops to average $1,425 per month
- Occupancy decreases to average 31.0%
- Daily rates adjust to average $189
Seasonality Insights for Kyle of Lochalsh
- The Airbnb seasonality in Kyle of Lochalsh shows highly seasonal trends requiring careful strategy. While the sections above show seasonal averages, it's also insightful to look at the extremes:
- During the high season, the absolute peak month showcases Kyle of Lochalsh's highest earning potential, with monthly revenues capable of climbing to $5,862, occupancy reaching a high of 89.6%, and ADRs peaking at $194.
- Conversely, the slowest single month of the year, typically falling within the low season, marks the market's lowest point. In this month, revenue might dip to $1,257, occupancy could drop to 25.4%, and ADRs may adjust down to $156.
- Understanding both the seasonal averages and these monthly peaks and troughs in revenue, occupancy, and ADR is crucial for maximizing your Airbnb profit potential in Kyle of Lochalsh.
Seasonal Strategies for Maximizing Profit
- Peak Season: Maximize revenue through premium pricing and potentially longer minimum stays. Ensure high availability.
- Low Season: Offer competitive pricing, special promotions (e.g., extended stay discounts), and flexible cancellation policies. Target off-season travelers like remote workers or budget-conscious guests.
- Shoulder Seasons: Implement dynamic pricing that balances peak and low rates. Target weekend travelers or specific events. Offer slightly more flexible terms than peak season.
- Regularly analyze your own performance against these Kyle of Lochalsh seasonality benchmarks and adjust your pricing and availability strategy accordingly.
Best Areas for Airbnb Investment in Kyle of Lochalsh (2025)
Exploring the top neighborhoods for short-term rentals in Kyle of Lochalsh? This section highlights key areas, outlining why they are attractive for hosts and guests, along with notable local attractions. Consider these locations based on your target guest profile and investment strategy.
| Neighborhood / Area | Why Host Here? (Target Guests & Appeal) | Key Attractions & Landmarks |
|---|---|---|
| Kyleakin | Charming village connected to the mainland by bridge, offering picturesque views and proximity to Skye. Popular with tourists for its quaint atmosphere and local pubs. | |
| Plockton | Known as the 'Jewel of the Highlands', this village boasts stunning scenery and is a popular filming location. Ideal for travelers seeking breathtaking landscapes and tranquility. | |
| Lyndale | A quiet and scenic area close to the water, great for families and those seeking a peaceful retreat. Offers access to local walks and exploration. | |
| Torbole | A lesser-known but stunning area, perfect for outdoor enthusiasts who love hiking and nature. Allows guests to explore less touristy parts of the Highlands. | |
| Broadford | The largest village on the Isle of Skye with essential amenities, making it convenient for tourists. Offers a range of accommodations and services. | |
| Skye Bridge | A vital link to the Isle of Skye, offering beautiful views and easy access to various attractions across Skye. Popular for its scenic drives and views. | |
| Elgol | Famous for its stunning views of the Cuillin mountains and access to boat trips to Loch Coruisk. Great for adventure seekers and photographers. | |
| Kyle of Lochalsh | The main hub for tourists visiting the Isle of Skye, with essential services and a scenic setting right by the water. Ideal for hosts serving trending tourist locations. |
Understanding Airbnb License Requirements & STR Laws in Kyle of Lochalsh (2025)
With 24% of listings showing registration in 2025, understanding potential Airbnb license requirements is crucial in Kyle of Lochalsh. Always verify the latest short term rental regulations and Airbnb license requirements directly with local government authorities for Kyle of Lochalsh to ensure full compliance before hosting.
(Source: AirROI data, 2025, based on 24% licensed listings)
Top Performing Airbnb Properties in Kyle of Lochalsh (2025)
Benchmark your potential! Explore examples of top-performing Airbnb properties in Kyle of Lochalshbased on Trailing Twelve Month (TTM) revenue. Analyze their characteristics, revenue, occupancy rate, and ADR to understand what drives success in this market.
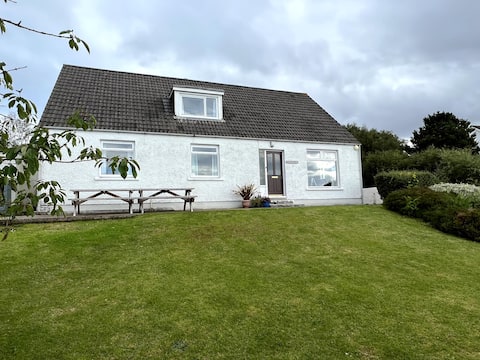
Taravik. Highland retreat. Stunning views of Skye.
Entire Place • 6 bedrooms

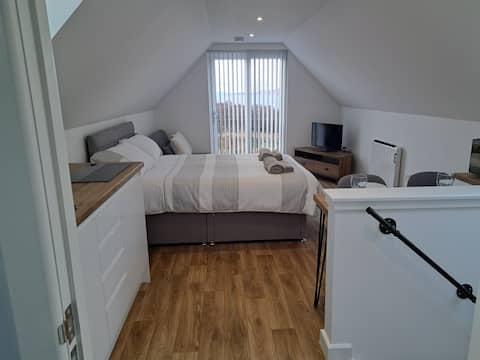
Old Relay Station
Entire Place • 2 bedrooms

A’Chomraich. Beautifully renovated 4 bed house
Entire Place • 4 bedrooms

The Old Post House, Kyle
Entire Place • 3 bedrooms
Bothan dubh
Entire Place • 1 bedroom
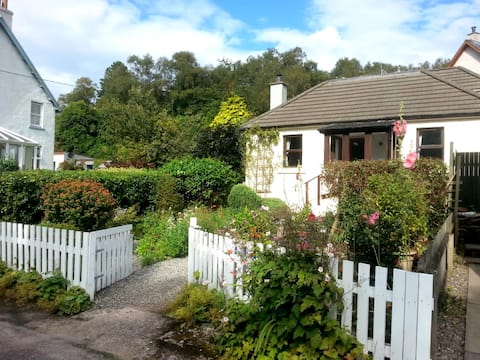
A cosy cottage next to the Isle of Skye bridge
Entire Place • 2 bedrooms
Note: Performance varies based on location, size, amenities, seasonality, and management quality. Data reflects the past 12 months.
Top Performing Airbnb Hosts in Kyle of Lochalsh (2025)
Learn from the best! This table showcases top-performing Airbnb hosts in Kyle of Lochalsh based on the number of properties managed and estimated total revenue over the past year. Analyze their scale and performance metrics.
| Host Name | Properties | Grossing Revenue | Stay Reviews | Avg Rating |
|---|---|---|---|---|
| David | 1 | $87,004 | 70 | 4.94/5.0 |
| Alex And Ruaridh | 1 | $74,168 | 142 | 4.88/5.0 |
| Anne | 1 | $58,715 | 7 | 5.00/5.0 |
| Glenn | 2 | $41,976 | 150 | 4.63/5.0 |
| Heather | 2 | $41,133 | 480 | 4.95/5.0 |
| Emma | 1 | $40,166 | 103 | 4.86/5.0 |
| Melanie | 1 | $37,735 | 98 | 4.96/5.0 |
| Francesca | 1 | $36,901 | 36 | 4.94/5.0 |
| Hector | 1 | $35,365 | 51 | 4.92/5.0 |
| Lesley | 1 | $32,116 | 131 | 4.99/5.0 |
Analyzing the strategies of top hosts, such as their property selection, pricing, and guest communication, can offer valuable lessons for optimizing your own Airbnb operations in Kyle of Lochalsh.
Dive Deeper: Advanced Kyle of Lochalsh STR Market Data (2025)
Ready to unlock more insights? AirROI provides access to advanced metrics and comprehensive Airbnb data for Kyle of Lochalsh. Explore detailed analytics beyond this report to refine your investment strategy, optimize pricing, and maximize your vacation rental profits.
Explore Advanced MetricsKyle of Lochalsh Short-Term Rental Market Composition (2025): Property & Room Types
Room Type Distribution
Property Type Distribution
Market Composition Insights for Kyle of Lochalsh
- The Kyle of Lochalsh Airbnb market composition is heavily skewed towards Entire Home/Apt listings, which make up 66.7% of the 21 active rentals. This indicates strong guest preference for privacy and space.
- However, a notable 33.3% share for Private Rooms suggests opportunities for budget-conscious travelers or hosts renting out spare rooms.
- Looking at the property type distribution in Kyle of Lochalsh, House properties are the most common (76.2%), reflecting the local real estate landscape.
- Houses represent a significant 76.2% portion, catering likely to families or larger groups.
- Smaller segments like hotel/boutique, others, outdoor/unique (combined 14.4%) offer potential for unique stay experiences.
Kyle of Lochalsh Airbnb Room Capacity Analysis (2025): Bedroom Distribution
Distribution of Listings by Number of Bedrooms
Room Capacity Insights for Kyle of Lochalsh
- The dominant room capacity in Kyle of Lochalsh is 2 bedrooms listings, making up 28.6% of the market. This suggests a strong demand for properties suitable for couples or solo travelers.
- Together, 2 bedrooms and 1 bedroom properties represent 57.2% of the active Airbnb listings in Kyle of Lochalsh, indicating a high concentration in these sizes.
Kyle of Lochalsh Vacation Rental Guest Capacity Trends (2025)
Distribution of Listings by Guest Capacity
Guest Capacity Insights for Kyle of Lochalsh
- The most common guest capacity trend in Kyle of Lochalsh vacation rentals is listings accommodating 2 guests (38.1%). This suggests the primary traveler segment is likely couples or solo travelers.
- Properties designed for 2 guests and 4 guests dominate the Kyle of Lochalsh STR market, accounting for 66.7% of listings.
- 14.3% of properties accommodate 6+ guests, serving the market segment for larger families or group travel in Kyle of Lochalsh.
- On average, properties in Kyle of Lochalsh are equipped to host 3.0 guests.
Kyle of Lochalsh Airbnb Booking Patterns (2025): Available vs. Booked Days
Available Days Distribution
Booked Days Distribution
Booking Pattern Insights for Kyle of Lochalsh
- The most common availability pattern in Kyle of Lochalsh falls within the 91-180 days range, representing 38.1% of listings. This suggests many properties have significant open periods on their calendars.
- Approximately 52.3% of listings show high availability (181+ days open annually), indicating potential for increased bookings or specific owner usage patterns.
- For booked days, the 181-270 days range is most frequent in Kyle of Lochalsh (42.9%), reflecting common guest stay durations or potential owner blocking patterns.
- A notable 52.4% of properties secure long booking periods (181+ days booked per year), highlighting successful long-term rental strategies or significant owner usage.
Kyle of Lochalsh Airbnb Minimum Stay Requirements Analysis
Distribution of Listings by Minimum Night Requirement
1 Night
5 listings
25% of total
2 Nights
5 listings
25% of total
3 Nights
3 listings
15% of total
4-6 Nights
5 listings
25% of total
30+ Nights
2 listings
10% of total
Key Insights
- The most prevalent minimum stay requirement in Kyle of Lochalsh is 1 Night, adopted by 25% of listings. This highlights the market's preference for shorter, flexible bookings.
Recommendations
- Align with the market by considering a 1 Night minimum stay, as 25% of Kyle of Lochalsh hosts use this setting.
- If feasible, allowing 1-night stays, especially midweek or during low season, could capture last-minute bookings, as only 25% currently do.
- Explore offering discounts for stays of 30+ nights to attract the 10% of the market seeking extended stays.
- Adjust minimum nights based on seasonality – potentially shorter during low season and longer during peak demand periods in Kyle of Lochalsh.
Kyle of Lochalsh Airbnb Cancellation Policy Trends Analysis (2025)
Flexible
2 listings
10% of total
Moderate
9 listings
45% of total
Firm
5 listings
25% of total
Strict
4 listings
20% of total
Cancellation Policy Insights for Kyle of Lochalsh
- The prevailing Airbnb cancellation policy trend in Kyle of Lochalsh is Moderate, used by 45% of listings.
- There's a relatively balanced mix between guest-friendly (55.0%) and stricter (45.0%) policies, offering choices for different guest needs.
Recommendations for Hosts
- Consider adopting a Moderate policy to align with the 45% market standard in Kyle of Lochalsh.
- Regularly review your cancellation policy against competitors and market demand shifts in Kyle of Lochalsh.
Kyle of Lochalsh STR Booking Lead Time Analysis (2025)
Average Booking Lead Time by Month
Booking Lead Time Insights for Kyle of Lochalsh
- The overall average booking lead time for vacation rentals in Kyle of Lochalsh is 100 days.
- Guests book furthest in advance for stays during July (average 140 days), likely coinciding with peak travel demand or local events.
- The shortest booking windows occur for stays in March (average 41 days), indicating more last-minute travel plans during this time.
- Seasonally, Summer (132 days avg.) sees the longest lead times, while Winter (69 days avg.) has the shortest, reflecting typical travel planning cycles.
Recommendations for Hosts
- Use the overall average lead time (100 days) as a baseline for your pricing and availability strategy in Kyle of Lochalsh.
- For July stays, consider implementing length-of-stay discounts or slightly higher rates for bookings made less than 140 days out to capitalize on advance planning.
- Target marketing efforts for the Summer season well in advance (at least 132 days) to capture early planners.
- Monitor your own booking lead times against these Kyle of Lochalsh averages to identify opportunities for dynamic pricing adjustments.
Popular & Essential Airbnb Amenities in Kyle of Lochalsh (2025)
Amenity Prevalence
Amenity Insights for Kyle of Lochalsh
- Essential amenities in Kyle of Lochalsh that guests expect include: Hot water, TV, Smoke alarm, Heating, Essentials, Wifi. Lacking these (any) could significantly impact bookings.
- Popular amenities like Bed linens, Carbon monoxide alarm, Hair dryer are common but not universal. Offering these can provide a competitive edge.
Recommendations for Hosts
- Ensure your listing includes all essential amenities for Kyle of Lochalsh: Hot water, TV, Smoke alarm, Heating, Essentials, Wifi.
- Prioritize adding missing essentials: Wifi.
- Consider adding popular differentiators like Bed linens or Carbon monoxide alarm to increase appeal.
- Highlight unique or less common amenities you offer (e.g., hot tub, dedicated workspace, EV charger) in your listing description and photos.
- Regularly check competitor amenities in Kyle of Lochalsh to stay competitive.
Kyle of Lochalsh Airbnb Guest Demographics & Profile Analysis (2025)
Guest Profile Summary for Kyle of Lochalsh
- The typical guest profile for Airbnb in Kyle of Lochalsh consists of a mix of domestic (37%) and international guests, with top international origins including United States, typically belonging to the Post-2000s (Gen Z/Alpha) group (50%), primarily speaking English or French.
- Domestic travelers account for 37.4% of guests.
- Key international markets include United Kingdom (37.4%) and United States (21.5%).
- Top languages spoken are English (59.2%) followed by French (10.6%).
- A significant demographic segment is the Post-2000s (Gen Z/Alpha) group, representing 50% of guests.
Recommendations for Hosts
- Focus marketing internationally, particularly towards travelers from United States.
- Tailor amenities and listing descriptions to appeal to the dominant Post-2000s (Gen Z/Alpha) demographic (e.g., highlight fast WiFi, smart home features, local guides).
- Highlight unique local experiences or amenities relevant to the primary guest profile.
- Consider seasonal promotions aligned with peak travel times for key origin markets.
Nearby Short-Term Rental Market Comparison
How does the Kyle of Lochalsh Airbnb market stack up against its neighbors? Compare key performance metrics like average monthly revenue, ADR, and occupancy rates in surrounding areas to understand the broader regional STR landscape.
| Market | Active Properties | Monthly Revenue | Daily Rate | Avg. Occupancy |
|---|---|---|---|---|
| Fearnan | 19 | $6,440 | $421.92 | 53% |
| Kirkhill | 10 | $5,719 | $700.26 | 44% |
| Glenachulish | 33 | $5,609 | $424.51 | 46% |
| North Kessock | 10 | $5,421 | $380.62 | 58% |
| Carbost | 26 | $5,209 | $324.31 | 62% |
| Foyers | 14 | $5,076 | $274.52 | 64% |
| Arrochar | 33 | $5,045 | $339.11 | 56% |
| Whitebridge | 10 | $4,907 | $417.35 | 42% |
| Port Failthe | 14 | $4,832 | $301.12 | 57% |
| Acharn | 10 | $4,813 | $278.43 | 57% |