Kippford Airbnb Market Analysis 2025: Short Term Rental Data & Vacation Rental Statistics in Scotland, United Kingdom
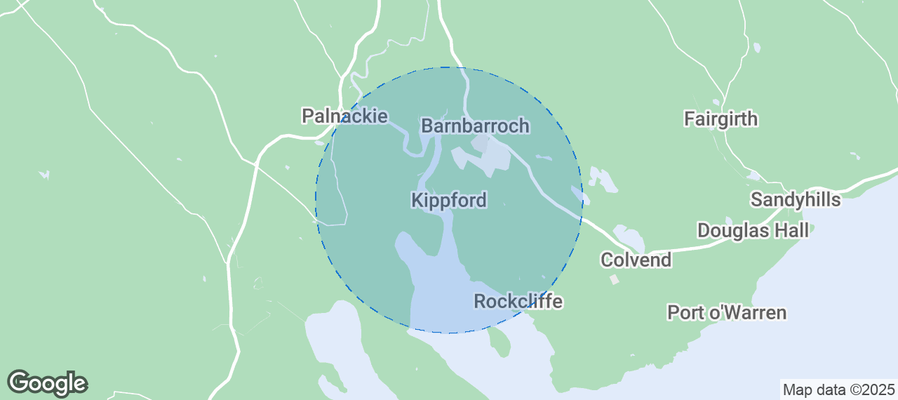
Is Airbnb profitable in Kippford in 2025? Explore comprehensive Airbnb analytics for Kippford, Scotland, United Kingdom to uncover income potential. This 2025 STR market report for Kippford, based on AirROI data from April 2024 to March 2025, reveals key trends in the niche market of 24 active listings.
Whether you're considering an Airbnb investment in Kippford, optimizing your existing vacation rental, or exploring rental arbitrage opportunities, understanding the Kippford Airbnb data is crucial. Navigating the high regulation landscape is key to maximizing your short term rental income potential. Let's dive into the specifics.
Key Kippford Airbnb Performance Metrics Overview
Monthly Airbnb Revenue Variations & Income Potential in Kippford (2025)
Understanding the monthly revenue variations for Airbnb listings in Kippford is key to maximizing your short term rental income potential. Seasonality significantly impacts earnings. Our analysis, based on data from the past 12 months, shows that the peak revenue month for STRs in Kippford is typically August, while January often presents the lowest earnings, highlighting opportunities for strategic pricing adjustments during shoulder and low seasons. Explore the typical Airbnb income in Kippford across different performance tiers:
- Best-in-class properties (Top 10%) achieve $5,083+ monthly, often utilizing dynamic pricing and superior guest experiences.
- Strong performing properties (Top 25%) earn $2,463 or more, indicating effective management and desirable locations/amenities.
- Typical properties (Median) generate around $1,637 per month, representing the average market performance.
- Entry-level properties (Bottom 25%) see earnings around $1,056, often with potential for optimization.
Average Monthly Airbnb Earnings Trend in Kippford
Kippford Airbnb Occupancy Rate Trends (2025)
Maximize your bookings by understanding the Kippford STR occupancy trends. Seasonal demand shifts significantly influence how often properties are booked. Typically, Augustsees the highest demand (peak season occupancy), while January experiences the lowest (low season). Effective strategies, like adjusting minimum stays or offering promotions, can boost occupancy during slower periods. Here's how different property tiers perform in Kippford:
- Best-in-class properties (Top 10%) achieve 72%+ occupancy, indicating high desirability and potentially optimized availability.
- Strong performing properties (Top 25%) maintain 56% or higher occupancy, suggesting good market fit and guest satisfaction.
- Typical properties (Median) have an occupancy rate around 40%.
- Entry-level properties (Bottom 25%) average 17% occupancy, potentially facing higher vacancy.
Average Monthly Occupancy Rate Trend in Kippford
Average Daily Rate (ADR) Airbnb Trends in Kippford (2025)
Effective short term rental pricing strategy in Kippford involves understanding monthly ADR fluctuations. The Average Daily Rate (ADR) for Airbnb in Kippford typically peaks in November and dips lowest during July. Leveraging Airbnb dynamic pricing tools or strategies based on this seasonality can significantly boost revenue. Here's a look at the typical nightly rates achieved:
- Best-in-class properties (Top 10%) command rates of $475+ per night, often due to premium features or locations.
- Strong performing properties (Top 25%) achieve nightly rates of $253 or more.
- Typical properties (Median) charge around $147 per night.
- Entry-level properties (Bottom 25%) earn around $104 per night.
Average Daily Rate (ADR) Trend by Month in Kippford
Get Live Kippford Market Intelligence 👇
Explore Real-time Analytics
Airbnb Seasonality Analysis & Trends in Kippford (2025)
Peak Season (August, October, September)
- Revenue averages $2,903 per month
- Occupancy rates average 56.7%
- Daily rates average $227
Shoulder Season
- Revenue averages $2,133 per month
- Occupancy maintains around 37.2%
- Daily rates hold near $234
Low Season (January, February, December)
- Revenue drops to average $1,546 per month
- Occupancy decreases to average 24.7%
- Daily rates adjust to average $257
Seasonality Insights for Kippford
- The Airbnb seasonality in Kippford shows highly seasonal trends requiring careful strategy. While the sections above show seasonal averages, it's also insightful to look at the extremes:
- During the high season, the absolute peak month showcases Kippford's highest earning potential, with monthly revenues capable of climbing to $3,023, occupancy reaching a high of 63.4%, and ADRs peaking at $268.
- Conversely, the slowest single month of the year, typically falling within the low season, marks the market's lowest point. In this month, revenue might dip to $1,310, occupancy could drop to 18.8%, and ADRs may adjust down to $213.
- Understanding both the seasonal averages and these monthly peaks and troughs in revenue, occupancy, and ADR is crucial for maximizing your Airbnb profit potential in Kippford.
Seasonal Strategies for Maximizing Profit
- Peak Season: Maximize revenue through premium pricing and potentially longer minimum stays. Ensure high availability.
- Low Season: Offer competitive pricing, special promotions (e.g., extended stay discounts), and flexible cancellation policies. Target off-season travelers like remote workers or budget-conscious guests.
- Shoulder Seasons: Implement dynamic pricing that balances peak and low rates. Target weekend travelers or specific events. Offer slightly more flexible terms than peak season.
- Regularly analyze your own performance against these Kippford seasonality benchmarks and adjust your pricing and availability strategy accordingly.
Best Areas for Airbnb Investment in Kippford (2025)
Exploring the top neighborhoods for short-term rentals in Kippford? This section highlights key areas, outlining why they are attractive for hosts and guests, along with notable local attractions. Consider these locations based on your target guest profile and investment strategy.
| Neighborhood / Area | Why Host Here? (Target Guests & Appeal) | Key Attractions & Landmarks |
|---|---|---|
| Kippford Beach | A picturesque coastal area with stunning views and access to beach activities. Perfect for visitors looking for a serene getaway by the sea. | Kippford Beach, Solway Coastal Path, Rockcliffe Beach, Dalbeattie Forest, Mersehead Nature Reserve |
| Kippford Village | A charming village with a friendly atmosphere and unique local shops. Attracts visitors interested in local culture and quaint living. | Local shops, Community events, Scenic walks, Kippford Sailing Club |
| Dalbeattie | Nearby town with rich history and attractions, making it suitable for those wanting to explore beyond Kippford. Offers various amenities and dining options. | Dalbeattie Forest, Dalbeattie Town Centre, Kirkgunzeon Church, Rocky Road |
| Castle Douglas | A bustling market town known as 'The Food Town', it offers a variety of local foods and shops. Popular for culinary enthusiasts. | Threave Garden, Castle Douglas Art Gallery, Local markets, Food festivals |
| Colvend | Secluded area with beautiful countryside views and quiet beaches. Ideal for those looking for peace and tranquility. | Colvend Beach, Rough Island, Coastal paths, Hiking trails |
| Dumfries and Galloway | Wider region known for its natural beauty and rich history, attracting tourists looking to explore Scotland's rural heritage. | Caerlaverock Castle, Galloway Forest Park, Wigtown Book Festival, Historic sites |
| Moffat | A charming spa town known for its healing waters and picturesque setting. Attracts visitors seeking wellness and relaxation. | Moffat Water, The Moffat Woollen Mill, Moffat Community Nature Reserve, Local hot springs |
| Castle Douglas to Kippford Trail | A scenic walking trail that connects attractions and offers stunning views of the Solway Firth, perfect for outdoor enthusiasts. | Scenic views, Birdwatching spots, Historical ruins, Nature photography |
Understanding Airbnb License Requirements & STR Laws in Kippford (2025)
Yes, Kippford, Scotland, United Kingdom enforces high STR regulations. Obtaining a license and ensuring compliance is almost certainly required according to current 2025 STR laws. Always verify the latest short term rental regulations and Airbnb license requirements directly with local government authorities for Kippford to ensure full compliance before hosting.
(Source: AirROI data, 2025, based on 54% licensed listings)
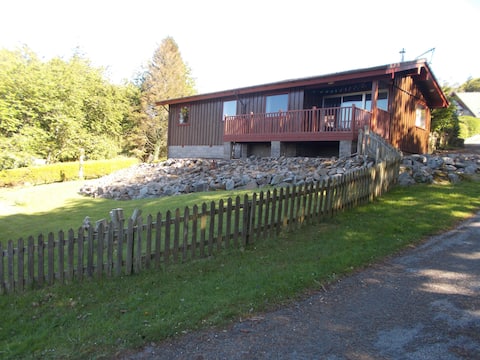
Top Performing Airbnb Properties in Kippford (2025)
Benchmark your potential! Explore examples of top-performing Airbnb properties in Kippfordbased on Trailing Twelve Month (TTM) revenue. Analyze their characteristics, revenue, occupancy rate, and ADR to understand what drives success in this market.

Beautiful Kippford Period Home - Spectacular Views
Entire Place • 4 bedrooms
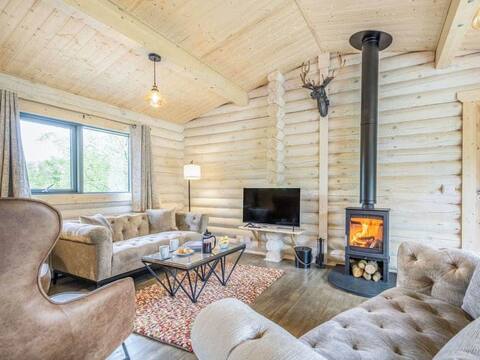
Treetops Luxury Log Cabin - Hot tub, BBQ & Sauna
Entire Place • 3 bedrooms

Driftwood
Entire Place • 3 bedrooms

Sugar Pine Lodge- 3 bedroom Lodge with superb view
Entire Place • 3 bedrooms

Allonby Cottage
Entire Place • 4 bedrooms
Secret Trails Holiday Lodge, Kippford, Sleeps 5
Entire Place • 3 bedrooms
Note: Performance varies based on location, size, amenities, seasonality, and management quality. Data reflects the past 12 months.
Top Performing Airbnb Hosts in Kippford (2025)
Learn from the best! This table showcases top-performing Airbnb hosts in Kippford based on the number of properties managed and estimated total revenue over the past year. Analyze their scale and performance metrics.
| Host Name | Properties | Grossing Revenue | Stay Reviews | Avg Rating |
|---|---|---|---|---|
| Discover Scotland | 7 | $67,698 | 45 | 4.25/5.0 |
| Cathy And Pass The Keys | 1 | $67,029 | 55 | 4.84/5.0 |
| Richard | 1 | $59,270 | 8 | 5.00/5.0 |
| Pamela | 2 | $36,200 | 280 | 4.87/5.0 |
| Suzanne | 2 | $36,035 | 125 | 4.86/5.0 |
| Travelnest | 2 | $27,125 | 84 | 5.00/5.0 |
| Cheryl | 1 | $23,814 | 43 | 5.00/5.0 |
| Alastair | 1 | $21,471 | 109 | 4.95/5.0 |
| Shona | 1 | $17,487 | 132 | 4.92/5.0 |
| Host #357829169 | 1 | $16,392 | 85 | 4.96/5.0 |
Analyzing the strategies of top hosts, such as their property selection, pricing, and guest communication, can offer valuable lessons for optimizing your own Airbnb operations in Kippford.
Dive Deeper: Advanced Kippford STR Market Data (2025)
Ready to unlock more insights? AirROI provides access to advanced metrics and comprehensive Airbnb data for Kippford. Explore detailed analytics beyond this report to refine your investment strategy, optimize pricing, and maximize your vacation rental profits.
Explore Advanced MetricsKippford Short-Term Rental Market Composition (2025): Property & Room Types
Room Type Distribution
Property Type Distribution
Market Composition Insights for Kippford
- The Kippford Airbnb market composition is heavily skewed towards Entire Home/Apt listings, which make up 100% of the 24 active rentals. This indicates strong guest preference for privacy and space.
- Looking at the property type distribution in Kippford, House properties are the most common (83.3%), reflecting the local real estate landscape.
- Houses represent a significant 83.3% portion, catering likely to families or larger groups.
- Smaller segments like others (combined 4.2%) offer potential for unique stay experiences.
Kippford Airbnb Room Capacity Analysis (2025): Bedroom Distribution
Distribution of Listings by Number of Bedrooms
Room Capacity Insights for Kippford
- The dominant room capacity in Kippford is 3 bedrooms listings, making up 50% of the market. This suggests a strong demand for properties suitable for families or small groups.
- Together, 3 bedrooms and 2 bedrooms properties represent 83.3% of the active Airbnb listings in Kippford, indicating a high concentration in these sizes.
- A significant 66.7% of listings offer 3+ bedrooms, catering to larger groups and families seeking more space in Kippford.
Kippford Vacation Rental Guest Capacity Trends (2025)
Distribution of Listings by Guest Capacity
Guest Capacity Insights for Kippford
- The most common guest capacity trend in Kippford vacation rentals is listings accommodating 6 guests (37.5%). This suggests the primary traveler segment is likely larger groups.
- Properties designed for 6 guests and 8+ guests dominate the Kippford STR market, accounting for 58.3% of listings.
- 66.6% of properties accommodate 6+ guests, serving the market segment for larger families or group travel in Kippford.
- On average, properties in Kippford are equipped to host 6.0 guests.
Kippford Airbnb Booking Patterns (2025): Available vs. Booked Days
Available Days Distribution
Booked Days Distribution
Booking Pattern Insights for Kippford
- The most common availability pattern in Kippford falls within the 271-366 days range, representing 50% of listings. This suggests many properties have significant open periods on their calendars.
- Approximately 79.2% of listings show high availability (181+ days open annually), indicating potential for increased bookings or specific owner usage patterns.
- For booked days, the 91-180 days range is most frequent in Kippford (29.2%), reflecting common guest stay durations or potential owner blocking patterns.
- A notable 20.8% of properties secure long booking periods (181+ days booked per year), highlighting successful long-term rental strategies or significant owner usage.
Kippford Airbnb Minimum Stay Requirements Analysis
Distribution of Listings by Minimum Night Requirement
1 Night
6 listings
27.3% of total
2 Nights
6 listings
27.3% of total
3 Nights
4 listings
18.2% of total
4-6 Nights
2 listings
9.1% of total
30+ Nights
4 listings
18.2% of total
Key Insights
- The most prevalent minimum stay requirement in Kippford is 1 Night, adopted by 27.3% of listings. This highlights the market's preference for shorter, flexible bookings.
- A significant segment (18.2%) caters to monthly stays (30+ nights) in Kippford, pointing to opportunities in the extended-stay market.
Recommendations
- Align with the market by considering a 1 Night minimum stay, as 27.3% of Kippford hosts use this setting.
- If feasible, allowing 1-night stays, especially midweek or during low season, could capture last-minute bookings, as only 27.3% currently do.
- Explore offering discounts for stays of 30+ nights to attract the 18.2% of the market seeking extended stays.
- Adjust minimum nights based on seasonality – potentially shorter during low season and longer during peak demand periods in Kippford.
Kippford Airbnb Cancellation Policy Trends Analysis (2025)
Super Strict 60 Days
1 listings
4.3% of total
Flexible
6 listings
26.1% of total
Moderate
3 listings
13% of total
Firm
4 listings
17.4% of total
Strict
9 listings
39.1% of total
Cancellation Policy Insights for Kippford
- The prevailing Airbnb cancellation policy trend in Kippford is Strict, used by 39.1% of listings.
- A majority (56.5%) of hosts in Kippford utilize Firm or Strict policies, indicating a market where hosts prioritize booking security.
Recommendations for Hosts
- Consider adopting a Strict policy to align with the 39.1% market standard in Kippford.
- With 39.1% using Strict terms, this is a viable option in Kippford, particularly for high-value properties or during peak demand periods.
- Regularly review your cancellation policy against competitors and market demand shifts in Kippford.
Kippford STR Booking Lead Time Analysis (2025)
Average Booking Lead Time by Month
Booking Lead Time Insights for Kippford
- The overall average booking lead time for vacation rentals in Kippford is 82 days.
- Guests book furthest in advance for stays during January (average 107 days), likely coinciding with peak travel demand or local events.
- The shortest booking windows occur for stays in March (average 49 days), indicating more last-minute travel plans during this time.
- Seasonally, Winter (87 days avg.) sees the longest lead times, while Spring (66 days avg.) has the shortest, reflecting typical travel planning cycles.
Recommendations for Hosts
- Use the overall average lead time (82 days) as a baseline for your pricing and availability strategy in Kippford.
- For January stays, consider implementing length-of-stay discounts or slightly higher rates for bookings made less than 107 days out to capitalize on advance planning.
- Target marketing efforts for the Winter season well in advance (at least 87 days) to capture early planners.
- Monitor your own booking lead times against these Kippford averages to identify opportunities for dynamic pricing adjustments.
Popular & Essential Airbnb Amenities in Kippford (2025)
Amenity Prevalence
Amenity Insights for Kippford
- Essential amenities in Kippford that guests expect include: Heating, Kitchen, TV, Smoke alarm, Carbon monoxide alarm. Lacking these (any) could significantly impact bookings.
- Popular amenities like Bed linens, Free parking on premises, Wifi are common but not universal. Offering these can provide a competitive edge.
- Warning: Wifi is not universally provided but is considered essential globally. Ensure reliable Wifi is offered.
Recommendations for Hosts
- Ensure your listing includes all essential amenities for Kippford: Heating, Kitchen, TV, Smoke alarm, Carbon monoxide alarm.
- Prioritize adding missing essentials: Carbon monoxide alarm.
- Consider adding popular differentiators like Bed linens or Free parking on premises to increase appeal.
- Highlight unique or less common amenities you offer (e.g., hot tub, dedicated workspace, EV charger) in your listing description and photos.
- Regularly check competitor amenities in Kippford to stay competitive.
Kippford Airbnb Guest Demographics & Profile Analysis (2025)
Guest Profile Summary for Kippford
- The typical guest profile for Airbnb in Kippford consists of primarily domestic travelers (96%), often arriving from nearby England, typically belonging to the Post-2000s (Gen Z/Alpha) group (50%), primarily speaking English or French.
- Domestic travelers account for 96.3% of guests.
- Key international markets include United Kingdom (96.3%) and Canada (0.5%).
- Top languages spoken are English (70.5%) followed by French (10.3%).
- A significant demographic segment is the Post-2000s (Gen Z/Alpha) group, representing 50% of guests.
Recommendations for Hosts
- Target domestic marketing efforts towards travelers from England and Scotland.
- Tailor amenities and listing descriptions to appeal to the dominant Post-2000s (Gen Z/Alpha) demographic (e.g., highlight fast WiFi, smart home features, local guides).
- Highlight unique local experiences or amenities relevant to the primary guest profile.
- Consider seasonal promotions aligned with peak travel times for key origin markets.
Nearby Short-Term Rental Market Comparison
How does the Kippford Airbnb market stack up against its neighbors? Compare key performance metrics like average monthly revenue, ADR, and occupancy rates in surrounding areas to understand the broader regional STR landscape.
| Market | Active Properties | Monthly Revenue | Daily Rate | Avg. Occupancy |
|---|---|---|---|---|
| Galston | 11 | $7,951 | $676.77 | 46% |
| Gorebridge | 12 | $6,209 | $493.62 | 54% |
| Cartmel Fell | 17 | $4,719 | $331.68 | 52% |
| Casterton | 11 | $4,578 | $300.82 | 51% |
| Cark | 11 | $4,540 | $885.21 | 31% |
| City of Edinburgh | 4,312 | $4,528 | $274.67 | 61% |
| Eglwys-bach | 16 | $4,413 | $315.23 | 52% |
| Waverton | 16 | $4,358 | $444.20 | 33% |
| Watermillock | 16 | $4,281 | $274.03 | 50% |
| Kielder | 12 | $4,215 | $329.21 | 53% |