Kinghorn Airbnb Market Analysis 2025: Short Term Rental Data & Vacation Rental Statistics in Scotland, United Kingdom
Is Airbnb profitable in Kinghorn in 2025? Explore comprehensive Airbnb analytics for Kinghorn, Scotland, United Kingdom to uncover income potential. This 2025 STR market report for Kinghorn, based on AirROI data from April 2024 to March 2025, reveals key trends in the niche market of 21 active listings.
Whether you're considering an Airbnb investment in Kinghorn, optimizing your existing vacation rental, or exploring rental arbitrage opportunities, understanding the Kinghorn Airbnb data is crucial. Understanding the local regulations is key to maximizing your short term rental income potential. Let's dive into the specifics.
Key Kinghorn Airbnb Performance Metrics Overview
Monthly Airbnb Revenue Variations & Income Potential in Kinghorn (2025)
Understanding the monthly revenue variations for Airbnb listings in Kinghorn is key to maximizing your short term rental income potential. Seasonality significantly impacts earnings. Our analysis, based on data from the past 12 months, shows that the peak revenue month for STRs in Kinghorn is typically August, while January often presents the lowest earnings, highlighting opportunities for strategic pricing adjustments during shoulder and low seasons. Explore the typical Airbnb income in Kinghorn across different performance tiers:
- Best-in-class properties (Top 10%) achieve $5,939+ monthly, often utilizing dynamic pricing and superior guest experiences.
- Strong performing properties (Top 25%) earn $3,873 or more, indicating effective management and desirable locations/amenities.
- Typical properties (Median) generate around $2,680 per month, representing the average market performance.
- Entry-level properties (Bottom 25%) see earnings around $1,872, often with potential for optimization.
Average Monthly Airbnb Earnings Trend in Kinghorn
Kinghorn Airbnb Occupancy Rate Trends (2025)
Maximize your bookings by understanding the Kinghorn STR occupancy trends. Seasonal demand shifts significantly influence how often properties are booked. Typically, Julysees the highest demand (peak season occupancy), while January experiences the lowest (low season). Effective strategies, like adjusting minimum stays or offering promotions, can boost occupancy during slower periods. Here's how different property tiers perform in Kinghorn:
- Best-in-class properties (Top 10%) achieve 85%+ occupancy, indicating high desirability and potentially optimized availability.
- Strong performing properties (Top 25%) maintain 73% or higher occupancy, suggesting good market fit and guest satisfaction.
- Typical properties (Median) have an occupancy rate around 52%.
- Entry-level properties (Bottom 25%) average 31% occupancy, potentially facing higher vacancy.
Average Monthly Occupancy Rate Trend in Kinghorn
Average Daily Rate (ADR) Airbnb Trends in Kinghorn (2025)
Effective short term rental pricing strategy in Kinghorn involves understanding monthly ADR fluctuations. The Average Daily Rate (ADR) for Airbnb in Kinghorn typically peaks in August and dips lowest during February. Leveraging Airbnb dynamic pricing tools or strategies based on this seasonality can significantly boost revenue. Here's a look at the typical nightly rates achieved:
- Best-in-class properties (Top 10%) command rates of $461+ per night, often due to premium features or locations.
- Strong performing properties (Top 25%) achieve nightly rates of $208 or more.
- Typical properties (Median) charge around $148 per night.
- Entry-level properties (Bottom 25%) earn around $106 per night.
Average Daily Rate (ADR) Trend by Month in Kinghorn
Get Live Kinghorn Market Intelligence 👇

Explore Real-time Analytics
Airbnb Seasonality Analysis & Trends in Kinghorn (2025)
Peak Season (August, July, June)
- Revenue averages $4,803 per month
- Occupancy rates average 72.9%
- Daily rates average $247
Shoulder Season
- Revenue averages $3,106 per month
- Occupancy maintains around 53.3%
- Daily rates hold near $223
Low Season (January, February, March)
- Revenue drops to average $1,544 per month
- Occupancy decreases to average 32.3%
- Daily rates adjust to average $180
Seasonality Insights for Kinghorn
- The Airbnb seasonality in Kinghorn shows highly seasonal trends requiring careful strategy. While the sections above show seasonal averages, it's also insightful to look at the extremes:
- During the high season, the absolute peak month showcases Kinghorn's highest earning potential, with monthly revenues capable of climbing to $5,159, occupancy reaching a high of 80.4%, and ADRs peaking at $251.
- Conversely, the slowest single month of the year, typically falling within the low season, marks the market's lowest point. In this month, revenue might dip to $1,448, occupancy could drop to 30.1%, and ADRs may adjust down to $179.
- Understanding both the seasonal averages and these monthly peaks and troughs in revenue, occupancy, and ADR is crucial for maximizing your Airbnb profit potential in Kinghorn.
Seasonal Strategies for Maximizing Profit
- Peak Season: Maximize revenue through premium pricing and potentially longer minimum stays. Ensure high availability.
- Low Season: Offer competitive pricing, special promotions (e.g., extended stay discounts), and flexible cancellation policies. Target off-season travelers like remote workers or budget-conscious guests.
- Shoulder Seasons: Implement dynamic pricing that balances peak and low rates. Target weekend travelers or specific events. Offer slightly more flexible terms than peak season.
- Regularly analyze your own performance against these Kinghorn seasonality benchmarks and adjust your pricing and availability strategy accordingly.
Best Areas for Airbnb Investment in Kinghorn (2025)
Exploring the top neighborhoods for short-term rentals in Kinghorn? This section highlights key areas, outlining why they are attractive for hosts and guests, along with notable local attractions. Consider these locations based on your target guest profile and investment strategy.
| Neighborhood / Area | Why Host Here? (Target Guests & Appeal) | Key Attractions & Landmarks |
|---|---|---|
| Kinghorn Beach | A beautiful coastal area with scenic views, perfect for tourists who want to enjoy the beach and local leisure activities. Popular for water sports and outdoor adventures. | Kinghorn Beach, Waterloo Park, Forth Coastal Path, St. Columba's Church, Kinghorn Sailing Club |
| The High Street | The main thoroughfare of Kinghorn, lined with charming shops and cafes, making it attractive for visitors wanting a local experience. | Local shops, Cafes, Kinghorn Library, Kinghorn Community Centre |
| Firth of Forth Views | Stunning views of the Firth of Forth that attract nature lovers and photographers. Ideal for scenic walks and appreciating the natural beauty. | Firth of Forth, Coastal walks, Nature reserves, Scottish wildlife observation |
| Kinghorn Glen | A picturesque glen with hiking trails that offer visitors an escape into nature, popular among outdoor enthusiasts. | Hiking Trails, Picnic Areas, Wildlife observation |
| Crail Point | A scenic point that provides breathtaking landscapes ideal for tourists looking to relax and explore the coast. | Crail Point Lighthouse, Scenic views, Nature trails |
| St. Monans | Nearby fishing village known for its historic buildings and quiet charm, appealing for visitors wanting a peaceful getaway. | St. Monans Windmill, Fisherman’s Path, Historic buildings |
| Local Pubs and Restaurants | Kinghorn has several local pubs and eateries that provide authentic Scottish experiences, making it a good spot for culinary tourism. | The Kinghorn Hotel Pub, The Royal Burgh Cafe, Seasonal Festivals |
| Nearby Edinburgh | Being close to Edinburgh makes Kinghorn a great base for travelers wanting to explore the capital while enjoying a quieter seaside experience. | Edinburgh Castle, Royal Mile, Holyrood Palace, Arthur's Seat |
Understanding Airbnb License Requirements & STR Laws in Kinghorn (2025)
With 24% of listings showing registration in 2025, understanding potential Airbnb license requirements is crucial in Kinghorn. Always verify the latest short term rental regulations and Airbnb license requirements directly with local government authorities for Kinghorn to ensure full compliance before hosting.
(Source: AirROI data, 2025, based on 24% licensed listings)
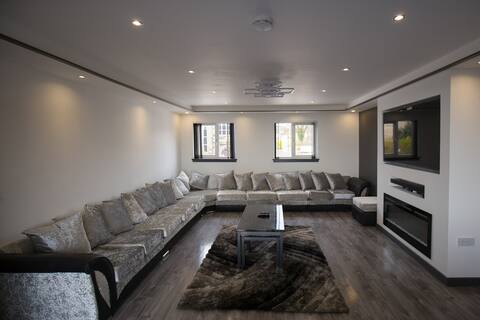
Top Performing Airbnb Properties in Kinghorn (2025)
Benchmark your potential! Explore examples of top-performing Airbnb properties in Kinghornbased on Trailing Twelve Month (TTM) revenue. Analyze their characteristics, revenue, occupancy rate, and ADR to understand what drives success in this market.

Luxury one-bedroom farm cottage with ocean views.
Entire Place • 1 bedroom

The Holiday Hoose
Entire Place • 3 bedrooms

Kinghorn View Apartment - with Balcony
Entire Place • 2 bedrooms

Linton
Entire Place • 2 bedrooms

Beach Cottage
Entire Place • 2 bedrooms
Waterfront Luxury Apartment
Entire Place • 4 bedrooms
Note: Performance varies based on location, size, amenities, seasonality, and management quality. Data reflects the past 12 months.
Top Performing Airbnb Hosts in Kinghorn (2025)
Learn from the best! This table showcases top-performing Airbnb hosts in Kinghorn based on the number of properties managed and estimated total revenue over the past year. Analyze their scale and performance metrics.
| Host Name | Properties | Grossing Revenue | Stay Reviews | Avg Rating |
|---|---|---|---|---|
| Jane | 1 | $89,840 | 169 | 5.00/5.0 |
| Tracey | 1 | $79,791 | 36 | 4.97/5.0 |
| Melissa | 2 | $68,500 | 389 | 4.93/5.0 |
| Mòrachd | 2 | $59,508 | 64 | 4.95/5.0 |
| Sarah | 1 | $42,634 | 75 | 4.97/5.0 |
| Sheila | 1 | $38,043 | 38 | 4.92/5.0 |
| Host #387762949 | 1 | $37,055 | 20 | 3.90/5.0 |
| Raquel | 1 | $33,350 | 111 | 4.74/5.0 |
| Paula | 1 | $31,318 | 103 | 4.93/5.0 |
| Dan And Alex | 1 | $30,941 | 127 | 4.88/5.0 |
Analyzing the strategies of top hosts, such as their property selection, pricing, and guest communication, can offer valuable lessons for optimizing your own Airbnb operations in Kinghorn.
Dive Deeper: Advanced Kinghorn STR Market Data (2025)
Ready to unlock more insights? AirROI provides access to advanced metrics and comprehensive Airbnb data for Kinghorn. Explore detailed analytics beyond this report to refine your investment strategy, optimize pricing, and maximize your vacation rental profits.
Explore Advanced MetricsKinghorn Short-Term Rental Market Composition (2025): Property & Room Types
Room Type Distribution
Property Type Distribution
Market Composition Insights for Kinghorn
- The Kinghorn Airbnb market composition is heavily skewed towards Entire Home/Apt listings, which make up 95.2% of the 21 active rentals. This indicates strong guest preference for privacy and space.
- Looking at the property type distribution in Kinghorn, House properties are the most common (52.4%), reflecting the local real estate landscape.
- Houses represent a significant 52.4% portion, catering likely to families or larger groups.
- Smaller segments like others (combined 4.8%) offer potential for unique stay experiences.
Kinghorn Airbnb Room Capacity Analysis (2025): Bedroom Distribution
Distribution of Listings by Number of Bedrooms
Room Capacity Insights for Kinghorn
- The dominant room capacity in Kinghorn is 2 bedrooms listings, making up 42.9% of the market. This suggests a strong demand for properties suitable for couples or solo travelers.
- Together, 2 bedrooms and 1 bedroom properties represent 76.2% of the active Airbnb listings in Kinghorn, indicating a high concentration in these sizes.
- A significant 23.8% of listings offer 3+ bedrooms, catering to larger groups and families seeking more space in Kinghorn.
Kinghorn Vacation Rental Guest Capacity Trends (2025)
Distribution of Listings by Guest Capacity
Guest Capacity Insights for Kinghorn
- The most common guest capacity trend in Kinghorn vacation rentals is listings accommodating 2 guests (33.3%). This suggests the primary traveler segment is likely couples or solo travelers.
- Properties designed for 2 guests and 4 guests dominate the Kinghorn STR market, accounting for 61.9% of listings.
- 23.8% of properties accommodate 6+ guests, serving the market segment for larger families or group travel in Kinghorn.
- On average, properties in Kinghorn are equipped to host 4.0 guests.
Kinghorn Airbnb Booking Patterns (2025): Available vs. Booked Days
Available Days Distribution
Booked Days Distribution
Booking Pattern Insights for Kinghorn
- The most common availability pattern in Kinghorn falls within the 91-180 days range, representing 33.3% of listings. This suggests many properties have significant open periods on their calendars.
- Approximately 52.4% of listings show high availability (181+ days open annually), indicating potential for increased bookings or specific owner usage patterns.
- For booked days, the 181-270 days range is most frequent in Kinghorn (33.3%), reflecting common guest stay durations or potential owner blocking patterns.
- A notable 47.6% of properties secure long booking periods (181+ days booked per year), highlighting successful long-term rental strategies or significant owner usage.
Kinghorn Airbnb Minimum Stay Requirements Analysis
Distribution of Listings by Minimum Night Requirement
1 Night
3 listings
16.7% of total
2 Nights
6 listings
33.3% of total
3 Nights
5 listings
27.8% of total
4-6 Nights
1 listings
5.6% of total
30+ Nights
3 listings
16.7% of total
Key Insights
- The most prevalent minimum stay requirement in Kinghorn is 2 Nights, adopted by 33.3% of listings. This highlights the market's preference for shorter, flexible bookings.
- A significant segment (16.7%) caters to monthly stays (30+ nights) in Kinghorn, pointing to opportunities in the extended-stay market.
Recommendations
- Align with the market by considering a 2 Nights minimum stay, as 33.3% of Kinghorn hosts use this setting.
- If feasible, allowing 1-night stays, especially midweek or during low season, could capture last-minute bookings, as only 16.7% currently do.
- A 2-night minimum appears standard (33.3%). Consider this for weekends or peak periods.
- Explore offering discounts for stays of 30+ nights to attract the 16.7% of the market seeking extended stays.
- Adjust minimum nights based on seasonality – potentially shorter during low season and longer during peak demand periods in Kinghorn.
Kinghorn Airbnb Cancellation Policy Trends Analysis (2025)
Super Strict 60 Days
1 listings
5.3% of total
Flexible
7 listings
36.8% of total
Moderate
6 listings
31.6% of total
Firm
2 listings
10.5% of total
Strict
3 listings
15.8% of total
Cancellation Policy Insights for Kinghorn
- The prevailing Airbnb cancellation policy trend in Kinghorn is Flexible, used by 36.8% of listings.
- There's a relatively balanced mix between guest-friendly (68.4%) and stricter (26.3%) policies, offering choices for different guest needs.
Recommendations for Hosts
- Consider adopting a Flexible policy to align with the 36.8% market standard in Kinghorn.
- Regularly review your cancellation policy against competitors and market demand shifts in Kinghorn.
Kinghorn STR Booking Lead Time Analysis (2025)
Average Booking Lead Time by Month
Booking Lead Time Insights for Kinghorn
- The overall average booking lead time for vacation rentals in Kinghorn is 55 days.
- Guests book furthest in advance for stays during June (average 106 days), likely coinciding with peak travel demand or local events.
- The shortest booking windows occur for stays in November (average 34 days), indicating more last-minute travel plans during this time.
- Seasonally, Summer (92 days avg.) sees the longest lead times, while Fall (40 days avg.) has the shortest, reflecting typical travel planning cycles.
Recommendations for Hosts
- Use the overall average lead time (55 days) as a baseline for your pricing and availability strategy in Kinghorn.
- For June stays, consider implementing length-of-stay discounts or slightly higher rates for bookings made less than 106 days out to capitalize on advance planning.
- Target marketing efforts for the Summer season well in advance (at least 92 days) to capture early planners.
- Monitor your own booking lead times against these Kinghorn averages to identify opportunities for dynamic pricing adjustments.
Popular & Essential Airbnb Amenities in Kinghorn (2025)
Amenity Prevalence
Amenity Insights for Kinghorn
- Essential amenities in Kinghorn that guests expect include: Heating, Kitchen, Wifi, Smoke alarm. Lacking these (any) could significantly impact bookings.
- Popular amenities like Hot water, Carbon monoxide alarm, Iron are common but not universal. Offering these can provide a competitive edge.
Recommendations for Hosts
- Ensure your listing includes all essential amenities for Kinghorn: Heating, Kitchen, Wifi, Smoke alarm.
- Consider adding popular differentiators like Hot water or Carbon monoxide alarm to increase appeal.
- Highlight unique or less common amenities you offer (e.g., hot tub, dedicated workspace, EV charger) in your listing description and photos.
- Regularly check competitor amenities in Kinghorn to stay competitive.
Kinghorn Airbnb Guest Demographics & Profile Analysis (2025)
Guest Profile Summary for Kinghorn
- The typical guest profile for Airbnb in Kinghorn consists of a mix of domestic (58%) and international guests, often arriving from nearby England, typically belonging to the Post-2000s (Gen Z/Alpha) group (50%), primarily speaking English or German.
- Domestic travelers account for 57.5% of guests.
- Key international markets include United Kingdom (57.5%) and United States (15.5%).
- Top languages spoken are English (58.5%) followed by German (9.1%).
- A significant demographic segment is the Post-2000s (Gen Z/Alpha) group, representing 50% of guests.
Recommendations for Hosts
- Balance marketing efforts between domestic and international channels based on the guest mix.
- Tailor amenities and listing descriptions to appeal to the dominant Post-2000s (Gen Z/Alpha) demographic (e.g., highlight fast WiFi, smart home features, local guides).
- Highlight unique local experiences or amenities relevant to the primary guest profile.
- Consider seasonal promotions aligned with peak travel times for key origin markets.
Nearby Short-Term Rental Market Comparison
How does the Kinghorn Airbnb market stack up against its neighbors? Compare key performance metrics like average monthly revenue, ADR, and occupancy rates in surrounding areas to understand the broader regional STR landscape.
| Market | Active Properties | Monthly Revenue | Daily Rate | Avg. Occupancy |
|---|---|---|---|---|
| Galston | 11 | $7,951 | $676.77 | 46% |
| Fearnan | 19 | $6,440 | $421.92 | 53% |
| Gorebridge | 12 | $6,209 | $493.62 | 54% |
| Bridge of Cally | 16 | $5,839 | $566.24 | 50% |
| Kirkhill | 10 | $5,719 | $700.26 | 44% |
| North Kessock | 10 | $5,421 | $380.62 | 58% |
| Foyers | 14 | $5,076 | $274.52 | 64% |
| Arrochar | 33 | $5,045 | $339.11 | 56% |
| Whitebridge | 10 | $4,907 | $417.35 | 42% |
| Acharn | 10 | $4,813 | $278.43 | 57% |