Kiltarlity Airbnb Market Analysis 2025: Short Term Rental Data & Vacation Rental Statistics in Scotland, United Kingdom
Is Airbnb profitable in Kiltarlity in 2025? Explore comprehensive Airbnb analytics for Kiltarlity, Scotland, United Kingdom to uncover income potential. This 2025 STR market report for Kiltarlity, based on AirROI data from April 2024 to March 2025, reveals key trends in the niche market of 54 active listings.
Whether you're considering an Airbnb investment in Kiltarlity, optimizing your existing vacation rental, or exploring rental arbitrage opportunities, understanding the Kiltarlity Airbnb data is crucial. Understanding the local regulations is key to maximizing your short term rental income potential. Let's dive into the specifics.
Key Kiltarlity Airbnb Performance Metrics Overview
Monthly Airbnb Revenue Variations & Income Potential in Kiltarlity (2025)
Understanding the monthly revenue variations for Airbnb listings in Kiltarlity is key to maximizing your short term rental income potential. Seasonality significantly impacts earnings. Our analysis, based on data from the past 12 months, shows that the peak revenue month for STRs in Kiltarlity is typically June, while January often presents the lowest earnings, highlighting opportunities for strategic pricing adjustments during shoulder and low seasons. Explore the typical Airbnb income in Kiltarlity across different performance tiers:
- Best-in-class properties (Top 10%) achieve $6,751+ monthly, often utilizing dynamic pricing and superior guest experiences.
- Strong performing properties (Top 25%) earn $4,806 or more, indicating effective management and desirable locations/amenities.
- Typical properties (Median) generate around $2,902 per month, representing the average market performance.
- Entry-level properties (Bottom 25%) see earnings around $1,558, often with potential for optimization.
Average Monthly Airbnb Earnings Trend in Kiltarlity
Kiltarlity Airbnb Occupancy Rate Trends (2025)
Maximize your bookings by understanding the Kiltarlity STR occupancy trends. Seasonal demand shifts significantly influence how often properties are booked. Typically, Junesees the highest demand (peak season occupancy), while January experiences the lowest (low season). Effective strategies, like adjusting minimum stays or offering promotions, can boost occupancy during slower periods. Here's how different property tiers perform in Kiltarlity:
- Best-in-class properties (Top 10%) achieve 81%+ occupancy, indicating high desirability and potentially optimized availability.
- Strong performing properties (Top 25%) maintain 65% or higher occupancy, suggesting good market fit and guest satisfaction.
- Typical properties (Median) have an occupancy rate around 45%.
- Entry-level properties (Bottom 25%) average 20% occupancy, potentially facing higher vacancy.
Average Monthly Occupancy Rate Trend in Kiltarlity
Average Daily Rate (ADR) Airbnb Trends in Kiltarlity (2025)
Effective short term rental pricing strategy in Kiltarlity involves understanding monthly ADR fluctuations. The Average Daily Rate (ADR) for Airbnb in Kiltarlity typically peaks in November and dips lowest during September. Leveraging Airbnb dynamic pricing tools or strategies based on this seasonality can significantly boost revenue. Here's a look at the typical nightly rates achieved:
- Best-in-class properties (Top 10%) command rates of $487+ per night, often due to premium features or locations.
- Strong performing properties (Top 25%) achieve nightly rates of $326 or more.
- Typical properties (Median) charge around $254 per night.
- Entry-level properties (Bottom 25%) earn around $155 per night.
Average Daily Rate (ADR) Trend by Month in Kiltarlity
Get Live Kiltarlity Market Intelligence 👇

Explore Real-time Analytics
Airbnb Seasonality Analysis & Trends in Kiltarlity (2025)
Peak Season (June, August, July)
- Revenue averages $4,722 per month
- Occupancy rates average 57.5%
- Daily rates average $281
Shoulder Season
- Revenue averages $3,655 per month
- Occupancy maintains around 45.0%
- Daily rates hold near $296
Low Season (January, February, March)
- Revenue drops to average $1,966 per month
- Occupancy decreases to average 31.3%
- Daily rates adjust to average $279
Seasonality Insights for Kiltarlity
- The Airbnb seasonality in Kiltarlity shows highly seasonal trends requiring careful strategy. While the sections above show seasonal averages, it's also insightful to look at the extremes:
- During the high season, the absolute peak month showcases Kiltarlity's highest earning potential, with monthly revenues capable of climbing to $4,952, occupancy reaching a high of 60.9%, and ADRs peaking at $389.
- Conversely, the slowest single month of the year, typically falling within the low season, marks the market's lowest point. In this month, revenue might dip to $1,700, occupancy could drop to 25.7%, and ADRs may adjust down to $266.
- Understanding both the seasonal averages and these monthly peaks and troughs in revenue, occupancy, and ADR is crucial for maximizing your Airbnb profit potential in Kiltarlity.
Seasonal Strategies for Maximizing Profit
- Peak Season: Maximize revenue through premium pricing and potentially longer minimum stays. Ensure high availability.
- Low Season: Offer competitive pricing, special promotions (e.g., extended stay discounts), and flexible cancellation policies. Target off-season travelers like remote workers or budget-conscious guests.
- Shoulder Seasons: Implement dynamic pricing that balances peak and low rates. Target weekend travelers or specific events. Offer slightly more flexible terms than peak season.
- Regularly analyze your own performance against these Kiltarlity seasonality benchmarks and adjust your pricing and availability strategy accordingly.
Best Areas for Airbnb Investment in Kiltarlity (2025)
Exploring the top neighborhoods for short-term rentals in Kiltarlity? This section highlights key areas, outlining why they are attractive for hosts and guests, along with notable local attractions. Consider these locations based on your target guest profile and investment strategy.
| Neighborhood / Area | Why Host Here? (Target Guests & Appeal) | Key Attractions & Landmarks |
|---|---|---|
| Kiltarlity Village | A charming Scottish village offering a picturesque countryside experience, ideal for travelers seeking tranquility and natural beauty. Close proximity to Inverness makes it attractive for tourists exploring the Highlands. | Inverness Castle, Loch Ness, Culloden Battlefield, Urquhart Castle, Great Glen Way |
| Loch Ness | Famous for its legendary monster, Loch Ness attracts tourists from around the globe. Offering stunning scenery and opportunities for outdoor activities, it is perfect for those looking for adventure and relaxation. | Loch Ness Centre and Exhibition, Fort Augustus, Urquhart Castle, Invermoriston Falls, Nessie Monster Tour |
| Inverness City Centre | The vibrant capital of the Highlands, Inverness offers a wide range of shops, restaurants, and cultural experiences. Perfect for both business travelers and tourists wanting a mix of city life and nature. | Inverness Cathedral, Eden Court Theatre, Inverness Museum and Art Gallery, Victorian Market, River Ness |
| Drumnadrochit | A picturesque village located on the banks of Loch Ness, Drumnadrochit serves as a popular base for exploring the area. It features local attractions and is close to nature trails. | Loch Ness 2000 Exhibition Centre, Castle of Urquhart, Nessieland, Loch Ness Cruises, The Great Glen Way |
| Beauly | Known for its historic architecture and stunning scenery, Beauly is charming and offers a mix of local culture and beautiful landscapes. It attracts those who enjoy a quieter, village lifestyle. | Beauly Priory, St. Mary's Church, The Glen Ord Distillery, Beauly Firth, Local artisan shops |
| Muir of Ord | A small village renowned for its local whisky distilleries and close access to the scenic Black Isle. Great for those looking to explore the Highland culture and nature. | The Muir of Ord Distillery, Black Isle Brewery, Pony Trekking, Wildlife Tours, Aros Park |
| Strathnairn | A scenic area known for its beautiful landscapes, Strathnairn attracts visitors looking for outdoor activities such as hiking and fishing, making it a great family destination. | Daviot Wood, Strathnairn Community Hall, River Nairn, Bhallaich Park, Local walking trails |
| Foyers | Situated on the eastern shore of Loch Ness, Foyers is known for its breathtaking waterfalls and walking trails. Ideal for nature lovers and those seeking peace and quiet. | Foyers Waterfall, Loch Ness walks, The Foyers Gallery, Water activities on Loch Ness, Nearby hiking trails |
Understanding Airbnb License Requirements & STR Laws in Kiltarlity (2025)
With 15% of listings showing registration in 2025, understanding potential Airbnb license requirements is crucial in Kiltarlity. Always verify the latest short term rental regulations and Airbnb license requirements directly with local government authorities for Kiltarlity to ensure full compliance before hosting.
(Source: AirROI data, 2025, based on 15% licensed listings)
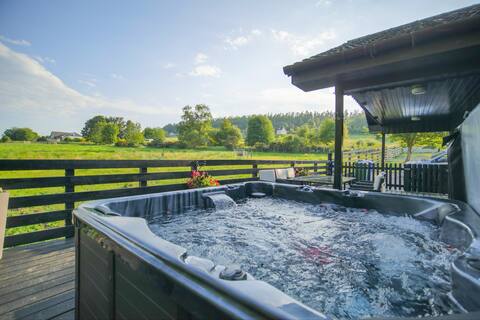
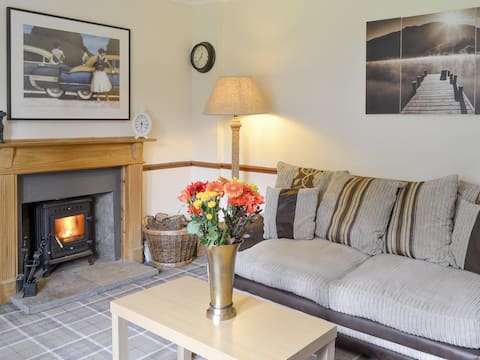
Top Performing Airbnb Properties in Kiltarlity (2025)
Benchmark your potential! Explore examples of top-performing Airbnb properties in Kiltarlitybased on Trailing Twelve Month (TTM) revenue. Analyze their characteristics, revenue, occupancy rate, and ADR to understand what drives success in this market.

Corrie House with Hot Tub
Entire Place • 4 bedrooms
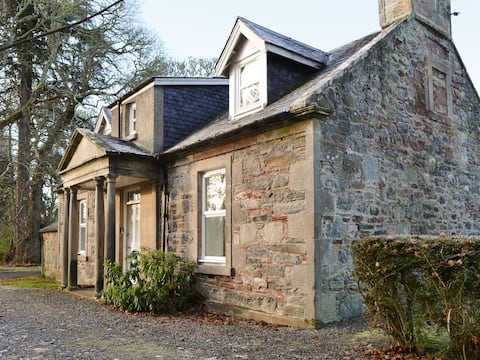
Mercy Cottage - Beaufort Estate
Entire Place • 3 bedrooms
Glenview Chalet Park - Chalet No 1 with Hot Tub
Entire Place • 3 bedrooms
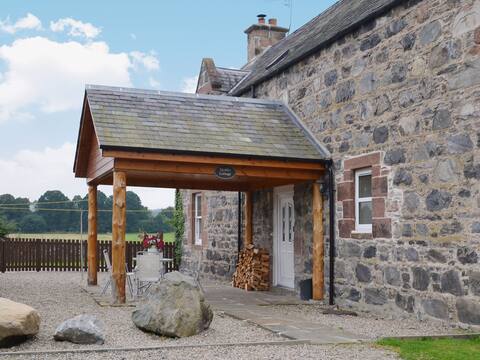
Stable cottage - Beaufort Estate
Entire Place • 3 bedrooms
Nursery Cottage - Beaufort Estate
Entire Place • 3 bedrooms

Calm Scottish Country Escape with Hot Tub Sleeps 6
Entire Place • 3 bedrooms
Note: Performance varies based on location, size, amenities, seasonality, and management quality. Data reflects the past 12 months.
Top Performing Airbnb Hosts in Kiltarlity (2025)
Learn from the best! This table showcases top-performing Airbnb hosts in Kiltarlity based on the number of properties managed and estimated total revenue over the past year. Analyze their scale and performance metrics.
| Host Name | Properties | Grossing Revenue | Stay Reviews | Avg Rating |
|---|---|---|---|---|
| Cottages | 10 | $525,757 | 128 | 4.01/5.0 |
| Solid | 21 | $350,423 | 264 | 4.68/5.0 |
| Graham | 3 | $150,151 | 88 | 5.00/5.0 |
| Chris | 3 | $134,745 | 35 | 3.23/5.0 |
| Paul And Amanda | 2 | $80,253 | 476 | 4.83/5.0 |
| Emma | 1 | $61,278 | 37 | 4.89/5.0 |
| Mairi | 1 | $38,786 | 316 | 4.91/5.0 |
| Veronica | 1 | $34,100 | 313 | 4.95/5.0 |
| Mary | 2 | $32,803 | 379 | 4.71/5.0 |
| Alison And Michael | 1 | $30,419 | 74 | 4.81/5.0 |
Analyzing the strategies of top hosts, such as their property selection, pricing, and guest communication, can offer valuable lessons for optimizing your own Airbnb operations in Kiltarlity.
Dive Deeper: Advanced Kiltarlity STR Market Data (2025)
Ready to unlock more insights? AirROI provides access to advanced metrics and comprehensive Airbnb data for Kiltarlity. Explore detailed analytics beyond this report to refine your investment strategy, optimize pricing, and maximize your vacation rental profits.
Explore Advanced MetricsKiltarlity Short-Term Rental Market Composition (2025): Property & Room Types
Room Type Distribution
Property Type Distribution
Market Composition Insights for Kiltarlity
- The Kiltarlity Airbnb market composition is heavily skewed towards Entire Home/Apt listings, which make up 92.6% of the 54 active rentals. This indicates strong guest preference for privacy and space.
- Looking at the property type distribution in Kiltarlity, Outdoor/Unique properties are the most common (50%), reflecting the local real estate landscape.
- Houses represent a significant 48.1% portion, catering likely to families or larger groups.
- Smaller segments like others (combined 1.9%) offer potential for unique stay experiences.
Kiltarlity Airbnb Room Capacity Analysis (2025): Bedroom Distribution
Distribution of Listings by Number of Bedrooms
Room Capacity Insights for Kiltarlity
- The dominant room capacity in Kiltarlity is 1 bedroom listings, making up 31.5% of the market. This suggests a strong demand for properties suitable for couples or solo travelers.
- Together, 1 bedroom and 3 bedrooms properties represent 61.1% of the active Airbnb listings in Kiltarlity, indicating a high concentration in these sizes.
- A significant 35.2% of listings offer 3+ bedrooms, catering to larger groups and families seeking more space in Kiltarlity.
Kiltarlity Vacation Rental Guest Capacity Trends (2025)
Distribution of Listings by Guest Capacity
Guest Capacity Insights for Kiltarlity
- The most common guest capacity trend in Kiltarlity vacation rentals is listings accommodating 4 guests (29.6%). This suggests the primary traveler segment is likely small families or groups.
- Properties designed for 4 guests and 2 guests dominate the Kiltarlity STR market, accounting for 55.5% of listings.
- 33.4% of properties accommodate 6+ guests, serving the market segment for larger families or group travel in Kiltarlity.
- On average, properties in Kiltarlity are equipped to host 3.9 guests.
Kiltarlity Airbnb Booking Patterns (2025): Available vs. Booked Days
Available Days Distribution
Booked Days Distribution
Booking Pattern Insights for Kiltarlity
- The most common availability pattern in Kiltarlity falls within the 271-366 days range, representing 40.7% of listings. This suggests many properties have significant open periods on their calendars.
- Approximately 61.1% of listings show high availability (181+ days open annually), indicating potential for increased bookings or specific owner usage patterns.
- For booked days, the 181-270 days range is most frequent in Kiltarlity (35.2%), reflecting common guest stay durations or potential owner blocking patterns.
- A notable 40.8% of properties secure long booking periods (181+ days booked per year), highlighting successful long-term rental strategies or significant owner usage.
Kiltarlity Airbnb Minimum Stay Requirements Analysis
Distribution of Listings by Minimum Night Requirement
1 Night
8 listings
15.4% of total
2 Nights
25 listings
48.1% of total
3 Nights
5 listings
9.6% of total
4-6 Nights
1 listings
1.9% of total
30+ Nights
13 listings
25% of total
Key Insights
- The most prevalent minimum stay requirement in Kiltarlity is 2 Nights, adopted by 48.1% of listings. This highlights the market's preference for shorter, flexible bookings.
- A strong majority (63.5%) of the Kiltarlity Airbnb data shows acceptance of very short stays (1-2 nights), indicating a dynamic, high-turnover market.
- A significant segment (25%) caters to monthly stays (30+ nights) in Kiltarlity, pointing to opportunities in the extended-stay market.
Recommendations
- Align with the market by considering a 2 Nights minimum stay, as 48.1% of Kiltarlity hosts use this setting.
- If feasible, allowing 1-night stays, especially midweek or during low season, could capture last-minute bookings, as only 15.4% currently do.
- A 2-night minimum appears standard (48.1%). Consider this for weekends or peak periods.
- Explore offering discounts for stays of 30+ nights to attract the 25% of the market seeking extended stays.
- Adjust minimum nights based on seasonality – potentially shorter during low season and longer during peak demand periods in Kiltarlity.
Kiltarlity Airbnb Cancellation Policy Trends Analysis (2025)
Super Strict 60 Days
32 listings
62.7% of total
Flexible
5 listings
9.8% of total
Moderate
5 listings
9.8% of total
Firm
2 listings
3.9% of total
Strict
7 listings
13.7% of total
Cancellation Policy Insights for Kiltarlity
- The prevailing Airbnb cancellation policy trend in Kiltarlity is Super Strict 60 Days, used by 62.7% of listings.
- There's a relatively balanced mix between guest-friendly (19.6%) and stricter (17.6%) policies, offering choices for different guest needs.
Recommendations for Hosts
- Consider adopting a Super Strict 60 Days policy to align with the 62.7% market standard in Kiltarlity.
- Using a Strict policy might deter some guests, as only 13.7% of listings use it. Evaluate if potential revenue protection outweighs possible lower booking rates.
- Regularly review your cancellation policy against competitors and market demand shifts in Kiltarlity.
Kiltarlity STR Booking Lead Time Analysis (2025)
Average Booking Lead Time by Month
Booking Lead Time Insights for Kiltarlity
- The overall average booking lead time for vacation rentals in Kiltarlity is 59 days.
- Guests book furthest in advance for stays during July (average 109 days), likely coinciding with peak travel demand or local events.
- The shortest booking windows occur for stays in March (average 44 days), indicating more last-minute travel plans during this time.
- Seasonally, Summer (96 days avg.) sees the longest lead times, while Winter (53 days avg.) has the shortest, reflecting typical travel planning cycles.
Recommendations for Hosts
- Use the overall average lead time (59 days) as a baseline for your pricing and availability strategy in Kiltarlity.
- For July stays, consider implementing length-of-stay discounts or slightly higher rates for bookings made less than 109 days out to capitalize on advance planning.
- Target marketing efforts for the Summer season well in advance (at least 96 days) to capture early planners.
- Monitor your own booking lead times against these Kiltarlity averages to identify opportunities for dynamic pricing adjustments.
Popular & Essential Airbnb Amenities in Kiltarlity (2025)
Amenity Prevalence
Amenity Insights for Kiltarlity
- Essential amenities in Kiltarlity that guests expect include: Smoke alarm, Heating, Wifi. Lacking these (any) could significantly impact bookings.
- Popular amenities like TV, Bed linens, Fire extinguisher are common but not universal. Offering these can provide a competitive edge.
Recommendations for Hosts
- Ensure your listing includes all essential amenities for Kiltarlity: Smoke alarm, Heating, Wifi.
- Prioritize adding missing essentials: Heating, Wifi.
- Consider adding popular differentiators like TV or Bed linens to increase appeal.
- Highlight unique or less common amenities you offer (e.g., hot tub, dedicated workspace, EV charger) in your listing description and photos.
- Regularly check competitor amenities in Kiltarlity to stay competitive.
Kiltarlity Airbnb Guest Demographics & Profile Analysis (2025)
Guest Profile Summary for Kiltarlity
- The typical guest profile for Airbnb in Kiltarlity consists of a mix of domestic (57%) and international guests, often arriving from nearby England, typically belonging to the Post-2000s (Gen Z/Alpha) group (50%), primarily speaking English or French.
- Domestic travelers account for 57.0% of guests.
- Key international markets include United Kingdom (57%) and United States (13%).
- Top languages spoken are English (58.6%) followed by French (9.2%).
- A significant demographic segment is the Post-2000s (Gen Z/Alpha) group, representing 50% of guests.
Recommendations for Hosts
- Balance marketing efforts between domestic and international channels based on the guest mix.
- Tailor amenities and listing descriptions to appeal to the dominant Post-2000s (Gen Z/Alpha) demographic (e.g., highlight fast WiFi, smart home features, local guides).
- Highlight unique local experiences or amenities relevant to the primary guest profile.
- Consider seasonal promotions aligned with peak travel times for key origin markets.
Nearby Short-Term Rental Market Comparison
How does the Kiltarlity Airbnb market stack up against its neighbors? Compare key performance metrics like average monthly revenue, ADR, and occupancy rates in surrounding areas to understand the broader regional STR landscape.
| Market | Active Properties | Monthly Revenue | Daily Rate | Avg. Occupancy |
|---|---|---|---|---|
| Fearnan | 19 | $6,440 | $421.92 | 53% |
| Bridge of Cally | 16 | $5,839 | $566.24 | 50% |
| Kirkhill | 10 | $5,719 | $700.26 | 44% |
| Glenachulish | 33 | $5,609 | $424.51 | 46% |
| North Kessock | 10 | $5,421 | $380.62 | 58% |
| Foyers | 14 | $5,076 | $274.52 | 64% |
| Arrochar | 33 | $5,045 | $339.11 | 56% |
| Whitebridge | 10 | $4,907 | $417.35 | 42% |
| Acharn | 10 | $4,813 | $278.43 | 57% |
| Camuscross | 11 | $4,649 | $300.59 | 61% |