Kilmelford Airbnb Market Analysis 2025: Short Term Rental Data & Vacation Rental Statistics in Scotland, United Kingdom
Is Airbnb profitable in Kilmelford in 2025? Explore comprehensive Airbnb analytics for Kilmelford, Scotland, United Kingdom to uncover income potential. This 2025 STR market report for Kilmelford, based on AirROI data from April 2024 to March 2025, reveals key trends in the niche market of 17 active listings.
Whether you're considering an Airbnb investment in Kilmelford, optimizing your existing vacation rental, or exploring rental arbitrage opportunities, understanding the Kilmelford Airbnb data is crucial. Leveraging the low regulation environment is key to maximizing your short term rental income potential. Let's dive into the specifics.
Key Kilmelford Airbnb Performance Metrics Overview
Monthly Airbnb Revenue Variations & Income Potential in Kilmelford (2025)
Understanding the monthly revenue variations for Airbnb listings in Kilmelford is key to maximizing your short term rental income potential. Seasonality significantly impacts earnings. Our analysis, based on data from the past 12 months, shows that the peak revenue month for STRs in Kilmelford is typically July, while January often presents the lowest earnings, highlighting opportunities for strategic pricing adjustments during shoulder and low seasons. Explore the typical Airbnb income in Kilmelford across different performance tiers:
- Best-in-class properties (Top 10%) achieve $5,705+ monthly, often utilizing dynamic pricing and superior guest experiences.
- Strong performing properties (Top 25%) earn $4,701 or more, indicating effective management and desirable locations/amenities.
- Typical properties (Median) generate around $3,053 per month, representing the average market performance.
- Entry-level properties (Bottom 25%) see earnings around $1,547, often with potential for optimization.
Average Monthly Airbnb Earnings Trend in Kilmelford
Kilmelford Airbnb Occupancy Rate Trends (2025)
Maximize your bookings by understanding the Kilmelford STR occupancy trends. Seasonal demand shifts significantly influence how often properties are booked. Typically, Julysees the highest demand (peak season occupancy), while January experiences the lowest (low season). Effective strategies, like adjusting minimum stays or offering promotions, can boost occupancy during slower periods. Here's how different property tiers perform in Kilmelford:
- Best-in-class properties (Top 10%) achieve 67%+ occupancy, indicating high desirability and potentially optimized availability.
- Strong performing properties (Top 25%) maintain 51% or higher occupancy, suggesting good market fit and guest satisfaction.
- Typical properties (Median) have an occupancy rate around 32%.
- Entry-level properties (Bottom 25%) average 19% occupancy, potentially facing higher vacancy.
Average Monthly Occupancy Rate Trend in Kilmelford
Average Daily Rate (ADR) Airbnb Trends in Kilmelford (2025)
Effective short term rental pricing strategy in Kilmelford involves understanding monthly ADR fluctuations. The Average Daily Rate (ADR) for Airbnb in Kilmelford typically peaks in November and dips lowest during October. Leveraging Airbnb dynamic pricing tools or strategies based on this seasonality can significantly boost revenue. Here's a look at the typical nightly rates achieved:
- Best-in-class properties (Top 10%) command rates of $527+ per night, often due to premium features or locations.
- Strong performing properties (Top 25%) achieve nightly rates of $414 or more.
- Typical properties (Median) charge around $304 per night.
- Entry-level properties (Bottom 25%) earn around $221 per night.
Average Daily Rate (ADR) Trend by Month in Kilmelford
Get Live Kilmelford Market Intelligence 👇

Explore Real-time Analytics
Airbnb Seasonality Analysis & Trends in Kilmelford (2025)
Peak Season (July, August, May)
- Revenue averages $4,905 per month
- Occupancy rates average 55.5%
- Daily rates average $311
Shoulder Season
- Revenue averages $3,153 per month
- Occupancy maintains around 32.5%
- Daily rates hold near $338
Low Season (January, February, April)
- Revenue drops to average $1,964 per month
- Occupancy decreases to average 24.5%
- Daily rates adjust to average $348
Seasonality Insights for Kilmelford
- The Airbnb seasonality in Kilmelford shows highly seasonal trends requiring careful strategy. While the sections above show seasonal averages, it's also insightful to look at the extremes:
- During the high season, the absolute peak month showcases Kilmelford's highest earning potential, with monthly revenues capable of climbing to $5,460, occupancy reaching a high of 67.0%, and ADRs peaking at $374.
- Conversely, the slowest single month of the year, typically falling within the low season, marks the market's lowest point. In this month, revenue might dip to $1,339, occupancy could drop to 17.8%, and ADRs may adjust down to $290.
- Understanding both the seasonal averages and these monthly peaks and troughs in revenue, occupancy, and ADR is crucial for maximizing your Airbnb profit potential in Kilmelford.
Seasonal Strategies for Maximizing Profit
- Peak Season: Maximize revenue through premium pricing and potentially longer minimum stays. Ensure high availability.
- Low Season: Offer competitive pricing, special promotions (e.g., extended stay discounts), and flexible cancellation policies. Target off-season travelers like remote workers or budget-conscious guests.
- Shoulder Seasons: Implement dynamic pricing that balances peak and low rates. Target weekend travelers or specific events. Offer slightly more flexible terms than peak season.
- Regularly analyze your own performance against these Kilmelford seasonality benchmarks and adjust your pricing and availability strategy accordingly.
Best Areas for Airbnb Investment in Kilmelford (2025)
Exploring the top neighborhoods for short-term rentals in Kilmelford? This section highlights key areas, outlining why they are attractive for hosts and guests, along with notable local attractions. Consider these locations based on your target guest profile and investment strategy.
| Neighborhood / Area | Why Host Here? (Target Guests & Appeal) | Key Attractions & Landmarks |
|---|---|---|
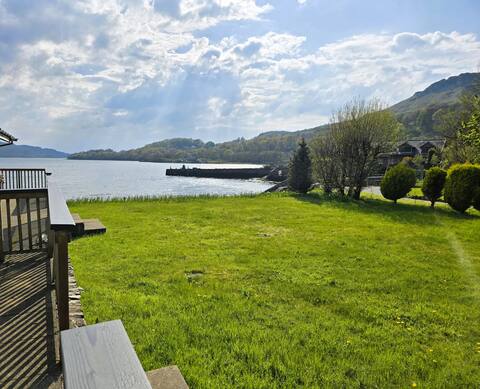
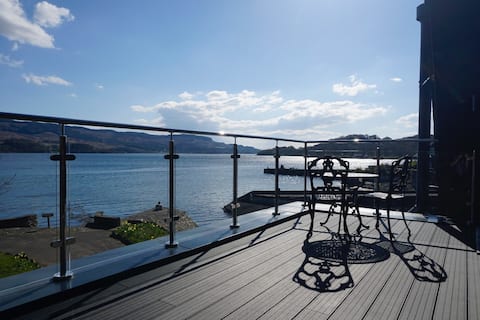
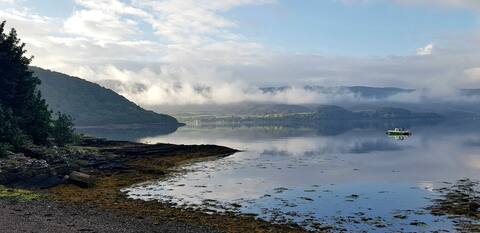
| Kilmelford Village | Charming village known for its scenic coastal views and proximity to the outdoors. A tranquil spot ideal for nature lovers and those seeking a relaxing getaway. | Kilmelford Hotel & Restaurant, Kilmelford Church, Coastal walks, Kayaking and sailing in the bay |
| Oban | A bustling town known as the 'Gateway to the Isles', offering rich history, fresh seafood, and ferry access to various islands. A prime location for tourists exploring West Scotland. | Oban Distillery, McCaig's Tower, Oban Harbour, Dunollie Castle, Isle of Mull ferry |
| Arduaine | A picturesque village with beautiful gardens and sea views, perfect for visitors looking for peace and nature. Close to Arduaine Garden, a popular attraction. | Arduaine Garden, National Trust for Scotland sites, Wildlife watching, Walking trails |
| Staffa Island | A stunning island famous for its unique geological formations and wildlife, particularly puffins. Attracts adventurous tourists and nature enthusiasts. | Fingal's Cave, Wildlife tours, Boat trips from Oban |
| Isle of Mull | A larger island known for its rugged scenery, wildlife, and cultural experiences. Attracts travelers interested in exploring the beauty of the Inner Hebrides. | Duart Castle, Tobermory, Calgary Bay |
| Lismore Island | A tranquil island with historic sites and scenic walks, ideal for those looking to escape the hustle and bustle. A great spot for hiking and exploring Scottish history. | Lismore Heritage Centre, Historic ruins, Walking trails |
| Taynuilt | A lovely village surrounded by mountains and near Loch Etive. Great for outdoor activities and offers a glimpse into Highland life. | Taynuilt Garden Centre, Dunstaffnage Castle |
| Inveraray | Historic town known for its stunning castle and rich history. A popular destination for visitors to experience Highland culture and architecture. | Inveraray Castle, Inveraray Jail, Loch Fyne |
Understanding Airbnb License Requirements & STR Laws in Kilmelford (2025)
While Kilmelford, Scotland, United Kingdom currently shows low STR regulations, specific Airbnb license requirements might still exist or change. Always verify the latest short term rental regulations and Airbnb license requirements directly with local government authorities for Kilmelford to ensure full compliance before hosting.
(Source: AirROI data, 2025, finding no licensed listings among those analyzed)
Top Performing Airbnb Properties in Kilmelford (2025)
Benchmark your potential! Explore examples of top-performing Airbnb properties in Kilmelfordbased on Trailing Twelve Month (TTM) revenue. Analyze their characteristics, revenue, occupancy rate, and ADR to understand what drives success in this market.

Lochview, 3b/3bt/accessible/sauna/TV's
Entire Place • 3 bedrooms
Mermaid Garden Suite Lochview
Entire Place • 2 bedrooms
Admiral Balcony Suite - 1 Bed Sea View Apartment
Entire Place • 1 bedroom

Commodore Balcony Suite - 1 Bed Sea View Apartment
Entire Place • 1 bedroom
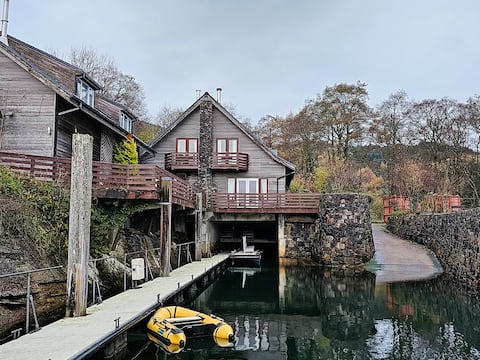
Boathouse East Balcony Suite Lochview
Entire Place • 3 bedrooms
Quayside Terrace Suite Lochview
Entire Place • 2 bedrooms
Note: Performance varies based on location, size, amenities, seasonality, and management quality. Data reflects the past 12 months.
Top Performing Airbnb Hosts in Kilmelford (2025)
Learn from the best! This table showcases top-performing Airbnb hosts in Kilmelford based on the number of properties managed and estimated total revenue over the past year. Analyze their scale and performance metrics.
| Host Name | Properties | Grossing Revenue | Stay Reviews | Avg Rating |
|---|---|---|---|---|
| Hazel | 12 | $385,634 | 257 | 3.97/5.0 |
| Cottages | 1 | $29,698 | 13 | 4.38/5.0 |
| Matthew | 2 | $25,905 | 27 | 4.63/5.0 |
| Lucy | 2 | $3,766 | 10 | 4.80/5.0 |
Analyzing the strategies of top hosts, such as their property selection, pricing, and guest communication, can offer valuable lessons for optimizing your own Airbnb operations in Kilmelford.
Dive Deeper: Advanced Kilmelford STR Market Data (2025)
Ready to unlock more insights? AirROI provides access to advanced metrics and comprehensive Airbnb data for Kilmelford. Explore detailed analytics beyond this report to refine your investment strategy, optimize pricing, and maximize your vacation rental profits.
Explore Advanced MetricsKilmelford Short-Term Rental Market Composition (2025): Property & Room Types
Room Type Distribution
Property Type Distribution
Market Composition Insights for Kilmelford
- The Kilmelford Airbnb market composition is heavily skewed towards Entire Home/Apt listings, which make up 100% of the 17 active rentals. This indicates strong guest preference for privacy and space.
- Looking at the property type distribution in Kilmelford, Apartment/Condo properties are the most common (64.7%), reflecting the local real estate landscape.
- Houses represent a significant 23.5% portion, catering likely to families or larger groups.
Kilmelford Airbnb Room Capacity Analysis (2025): Bedroom Distribution
Distribution of Listings by Number of Bedrooms
Room Capacity Insights for Kilmelford
- The dominant room capacity in Kilmelford is 2 bedrooms listings, making up 41.2% of the market. This suggests a strong demand for properties suitable for couples or solo travelers.
- Together, 2 bedrooms and 1 bedroom properties represent 76.5% of the active Airbnb listings in Kilmelford, indicating a high concentration in these sizes.
- A significant 23.5% of listings offer 3+ bedrooms, catering to larger groups and families seeking more space in Kilmelford.
Kilmelford Vacation Rental Guest Capacity Trends (2025)
Distribution of Listings by Guest Capacity
Guest Capacity Insights for Kilmelford
- The most common guest capacity trend in Kilmelford vacation rentals is listings accommodating 4 guests (35.3%). This suggests the primary traveler segment is likely small families or groups.
- Properties designed for 4 guests and 6 guests dominate the Kilmelford STR market, accounting for 64.7% of listings.
- 35.3% of properties accommodate 6+ guests, serving the market segment for larger families or group travel in Kilmelford.
- On average, properties in Kilmelford are equipped to host 4.3 guests.
Kilmelford Airbnb Booking Patterns (2025): Available vs. Booked Days
Available Days Distribution
Booked Days Distribution
Booking Pattern Insights for Kilmelford
- The most common availability pattern in Kilmelford falls within the 271-366 days range, representing 47.1% of listings. This suggests many properties have significant open periods on their calendars.
- Approximately 94.2% of listings show high availability (181+ days open annually), indicating potential for increased bookings or specific owner usage patterns.
- For booked days, the 91-180 days range is most frequent in Kilmelford (47.1%), reflecting common guest stay durations or potential owner blocking patterns.
- A notable 5.9% of properties secure long booking periods (181+ days booked per year), highlighting successful long-term rental strategies or significant owner usage.
Kilmelford Airbnb Minimum Stay Requirements Analysis
Distribution of Listings by Minimum Night Requirement
1 Night
5 listings
29.4% of total
2 Nights
12 listings
70.6% of total
Key Insights
- The most prevalent minimum stay requirement in Kilmelford is 2 Nights, adopted by 70.6% of listings. This highlights the market's preference for shorter, flexible bookings.
- A strong majority (100.0%) of the Kilmelford Airbnb data shows acceptance of very short stays (1-2 nights), indicating a dynamic, high-turnover market.
Recommendations
- Align with the market by considering a 2 Nights minimum stay, as 70.6% of Kilmelford hosts use this setting.
- If feasible, allowing 1-night stays, especially midweek or during low season, could capture last-minute bookings, as only 29.4% currently do.
- Adjust minimum nights based on seasonality – potentially shorter during low season and longer during peak demand periods in Kilmelford.
Kilmelford Airbnb Cancellation Policy Trends Analysis (2025)
Super Strict 60 Days
1 listings
6.7% of total
Flexible
2 listings
13.3% of total
Firm
2 listings
13.3% of total
Strict
10 listings
66.7% of total
Cancellation Policy Insights for Kilmelford
- The prevailing Airbnb cancellation policy trend in Kilmelford is Strict, used by 66.7% of listings.
- A majority (80.0%) of hosts in Kilmelford utilize Firm or Strict policies, indicating a market where hosts prioritize booking security.
Recommendations for Hosts
- Consider adopting a Strict policy to align with the 66.7% market standard in Kilmelford.
- With 66.7% using Strict terms, this is a viable option in Kilmelford, particularly for high-value properties or during peak demand periods.
- Regularly review your cancellation policy against competitors and market demand shifts in Kilmelford.
Kilmelford STR Booking Lead Time Analysis (2025)
Average Booking Lead Time by Month
Booking Lead Time Insights for Kilmelford
- The overall average booking lead time for vacation rentals in Kilmelford is 54 days.
- Guests book furthest in advance for stays during November (average 143 days), likely coinciding with peak travel demand or local events.
- The shortest booking windows occur for stays in March (average 27 days), indicating more last-minute travel plans during this time.
- Seasonally, Winter (87 days avg.) sees the longest lead times, while Spring (46 days avg.) has the shortest, reflecting typical travel planning cycles.
Recommendations for Hosts
- Use the overall average lead time (54 days) as a baseline for your pricing and availability strategy in Kilmelford.
- For November stays, consider implementing length-of-stay discounts or slightly higher rates for bookings made less than 143 days out to capitalize on advance planning.
- Target marketing efforts for the Winter season well in advance (at least 87 days) to capture early planners.
- Monitor your own booking lead times against these Kilmelford averages to identify opportunities for dynamic pricing adjustments.
Popular & Essential Airbnb Amenities in Kilmelford (2025)
Amenity Prevalence
Amenity Insights for Kilmelford
- Essential amenities in Kilmelford that guests expect include: Free parking on premises, Wifi. Lacking these (any) could significantly impact bookings.
- Popular amenities like First aid kit, Smoke alarm, Heating are common but not universal. Offering these can provide a competitive edge.
Recommendations for Hosts
- Ensure your listing includes all essential amenities for Kilmelford: Free parking on premises, Wifi.
- Consider adding popular differentiators like First aid kit or Smoke alarm to increase appeal.
- Highlight unique or less common amenities you offer (e.g., hot tub, dedicated workspace, EV charger) in your listing description and photos.
- Regularly check competitor amenities in Kilmelford to stay competitive.
Kilmelford Airbnb Guest Demographics & Profile Analysis (2025)
Guest Profile Summary for Kilmelford
- The typical guest profile for Airbnb in Kilmelford consists of primarily domestic travelers (67%), often arriving from nearby Glasgow, typically belonging to the Post-2000s (Gen Z/Alpha) group (50%), primarily speaking English or German.
- Domestic travelers account for 66.7% of guests.
- Key international markets include United Kingdom (66.7%) and United States (7%).
- Top languages spoken are English (60%) followed by German (11.1%).
- A significant demographic segment is the Post-2000s (Gen Z/Alpha) group, representing 50% of guests.
Recommendations for Hosts
- Target domestic marketing efforts towards travelers from Glasgow and Edinburgh.
- Tailor amenities and listing descriptions to appeal to the dominant Post-2000s (Gen Z/Alpha) demographic (e.g., highlight fast WiFi, smart home features, local guides).
- Highlight unique local experiences or amenities relevant to the primary guest profile.
- Consider seasonal promotions aligned with peak travel times for key origin markets.
Nearby Short-Term Rental Market Comparison
How does the Kilmelford Airbnb market stack up against its neighbors? Compare key performance metrics like average monthly revenue, ADR, and occupancy rates in surrounding areas to understand the broader regional STR landscape.
| Market | Active Properties | Monthly Revenue | Daily Rate | Avg. Occupancy |
|---|---|---|---|---|
| Galston | 11 | $7,951 | $676.77 | 46% |
| Fearnan | 19 | $6,440 | $421.92 | 53% |
| Kirkhill | 10 | $5,719 | $700.26 | 44% |
| Glenachulish | 33 | $5,609 | $424.51 | 46% |
| North Kessock | 10 | $5,421 | $380.62 | 58% |
| Carbost | 26 | $5,209 | $324.31 | 62% |
| Foyers | 14 | $5,076 | $274.52 | 64% |
| Arrochar | 33 | $5,045 | $339.11 | 56% |
| Whitebridge | 10 | $4,907 | $417.35 | 42% |
| Port Failthe | 14 | $4,832 | $301.12 | 57% |