Kentallen Airbnb Market Analysis 2025: Short Term Rental Data & Vacation Rental Statistics in Scotland, United Kingdom
Is Airbnb profitable in Kentallen in 2025? Explore comprehensive Airbnb analytics for Kentallen, Scotland, United Kingdom to uncover income potential. This 2025 STR market report for Kentallen, based on AirROI data from April 2024 to March 2025, reveals key trends in the niche market of 25 active listings.
Whether you're considering an Airbnb investment in Kentallen, optimizing your existing vacation rental, or exploring rental arbitrage opportunities, understanding the Kentallen Airbnb data is crucial. Understanding the local regulations is key to maximizing your short term rental income potential. Let's dive into the specifics.
Key Kentallen Airbnb Performance Metrics Overview
Monthly Airbnb Revenue Variations & Income Potential in Kentallen (2025)
Understanding the monthly revenue variations for Airbnb listings in Kentallen is key to maximizing your short term rental income potential. Seasonality significantly impacts earnings. Our analysis, based on data from the past 12 months, shows that the peak revenue month for STRs in Kentallen is typically June, while January often presents the lowest earnings, highlighting opportunities for strategic pricing adjustments during shoulder and low seasons. Explore the typical Airbnb income in Kentallen across different performance tiers:
- Best-in-class properties (Top 10%) achieve $9,443+ monthly, often utilizing dynamic pricing and superior guest experiences.
- Strong performing properties (Top 25%) earn $5,505 or more, indicating effective management and desirable locations/amenities.
- Typical properties (Median) generate around $3,519 per month, representing the average market performance.
- Entry-level properties (Bottom 25%) see earnings around $1,991, often with potential for optimization.
Average Monthly Airbnb Earnings Trend in Kentallen
Kentallen Airbnb Occupancy Rate Trends (2025)
Maximize your bookings by understanding the Kentallen STR occupancy trends. Seasonal demand shifts significantly influence how often properties are booked. Typically, Junesees the highest demand (peak season occupancy), while January experiences the lowest (low season). Effective strategies, like adjusting minimum stays or offering promotions, can boost occupancy during slower periods. Here's how different property tiers perform in Kentallen:
- Best-in-class properties (Top 10%) achieve 88%+ occupancy, indicating high desirability and potentially optimized availability.
- Strong performing properties (Top 25%) maintain 74% or higher occupancy, suggesting good market fit and guest satisfaction.
- Typical properties (Median) have an occupancy rate around 46%.
- Entry-level properties (Bottom 25%) average 15% occupancy, potentially facing higher vacancy.
Average Monthly Occupancy Rate Trend in Kentallen
Average Daily Rate (ADR) Airbnb Trends in Kentallen (2025)
Effective short term rental pricing strategy in Kentallen involves understanding monthly ADR fluctuations. The Average Daily Rate (ADR) for Airbnb in Kentallen typically peaks in August and dips lowest during January. Leveraging Airbnb dynamic pricing tools or strategies based on this seasonality can significantly boost revenue. Here's a look at the typical nightly rates achieved:
- Best-in-class properties (Top 10%) command rates of $775+ per night, often due to premium features or locations.
- Strong performing properties (Top 25%) achieve nightly rates of $487 or more.
- Typical properties (Median) charge around $382 per night.
- Entry-level properties (Bottom 25%) earn around $194 per night.
Average Daily Rate (ADR) Trend by Month in Kentallen
Get Live Kentallen Market Intelligence 👇

Explore Real-time Analytics
Airbnb Seasonality Analysis & Trends in Kentallen (2025)
Peak Season (June, May, August)
- Revenue averages $6,209 per month
- Occupancy rates average 54.8%
- Daily rates average $474
Shoulder Season
- Revenue averages $4,489 per month
- Occupancy maintains around 47.1%
- Daily rates hold near $410
Low Season (January, February, March)
- Revenue drops to average $2,824 per month
- Occupancy decreases to average 34.0%
- Daily rates adjust to average $327
Seasonality Insights for Kentallen
- The Airbnb seasonality in Kentallen shows highly seasonal trends requiring careful strategy. While the sections above show seasonal averages, it's also insightful to look at the extremes:
- During the high season, the absolute peak month showcases Kentallen's highest earning potential, with monthly revenues capable of climbing to $6,510, occupancy reaching a high of 60.5%, and ADRs peaking at $514.
- Conversely, the slowest single month of the year, typically falling within the low season, marks the market's lowest point. In this month, revenue might dip to $2,571, occupancy could drop to 30.5%, and ADRs may adjust down to $311.
- Understanding both the seasonal averages and these monthly peaks and troughs in revenue, occupancy, and ADR is crucial for maximizing your Airbnb profit potential in Kentallen.
Seasonal Strategies for Maximizing Profit
- Peak Season: Maximize revenue through premium pricing and potentially longer minimum stays. Ensure high availability.
- Low Season: Offer competitive pricing, special promotions (e.g., extended stay discounts), and flexible cancellation policies. Target off-season travelers like remote workers or budget-conscious guests.
- Shoulder Seasons: Implement dynamic pricing that balances peak and low rates. Target weekend travelers or specific events. Offer slightly more flexible terms than peak season.
- Regularly analyze your own performance against these Kentallen seasonality benchmarks and adjust your pricing and availability strategy accordingly.
Best Areas for Airbnb Investment in Kentallen (2025)
Exploring the top neighborhoods for short-term rentals in Kentallen? This section highlights key areas, outlining why they are attractive for hosts and guests, along with notable local attractions. Consider these locations based on your target guest profile and investment strategy.
| Neighborhood / Area | Why Host Here? (Target Guests & Appeal) | Key Attractions & Landmarks |
|---|---|---|
| Glencoe | Stunning natural beauty and outdoor adventures make Glencoe a perfect destination for nature lovers and hikers. The scenic landscapes attract tourists year-round. | Glencoe Valley, Buachaille Etive Mor, Glencoe Visitor Centre, Lost Valley, Kingshouse Hotel |
| Fort William | Known as the outdoor capital of the UK, Fort William offers various activities, ranging from hiking to skiing, and serves as a gateway to Ben Nevis. | Ben Nevis, Nevis Range Mountain Resort, Loch Linnhe, Steall Waterfall, West Highland Museum |
| Oban | A picturesque coastal town known for its seafood and ferry connections to the Hebrides. Ideal for tourists looking to explore the islands. | Oban Distillery, Gallanachmore Gardens, Dunollie Castle, McCaig's Tower, Ben Nevis Distillery |
| Inveraray | A charming town with a rich history, Inveraray is known for its stunning castle and surrounding landscapes, attracting history buffs and families. | Inveraray Castle, Inveraray Jail, Loch Fyne, Inveraray Bell Tower, The George Hotel |
| Tarbert | A quaint village with a picturesque harbor and rich maritime history, Tarbert offers a relaxing getaway for travelers seeking tranquility and scenic views. | Tarbert Harbour, Tarbert Castle, Kintyre Way, Fisherman's Walk, Local seafood restaurants |
| Ballachulish | Situated near Loch Leven, Ballachulish is a popular spot for hiking and water activities, ideal for those looking to enjoy Scotland's natural beauty. | Ballachulish Bridge, Loch Leven, Pap of Glencoe, Glencoe Mountain Resort, Craft shops |
| Kyle of Lochalsh | An idyllic village that serves as the gateway to the Isle of Skye, popular for its stunning landscapes and outdoor activities. | Eilean Donan Castle, Isle of Skye bridge, Loch Alsh, The Skye Trail, Kyleakin Village |
| Stirling | Rich in historical significance, Stirling has a diverse array of attractions and serves as a perfect base to explore central Scotland's history. | Stirling Castle, Wallace Monument, Battle of Bannockburn Visitor Centre, Falkirk Wheel, The Old Town |
Understanding Airbnb License Requirements & STR Laws in Kentallen (2025)
With 20% of listings showing registration in 2025, understanding potential Airbnb license requirements is crucial in Kentallen. Always verify the latest short term rental regulations and Airbnb license requirements directly with local government authorities for Kentallen to ensure full compliance before hosting.
(Source: AirROI data, 2025, based on 20% licensed listings)
Top Performing Airbnb Properties in Kentallen (2025)
Benchmark your potential! Explore examples of top-performing Airbnb properties in Kentallenbased on Trailing Twelve Month (TTM) revenue. Analyze their characteristics, revenue, occupancy rate, and ADR to understand what drives success in this market.
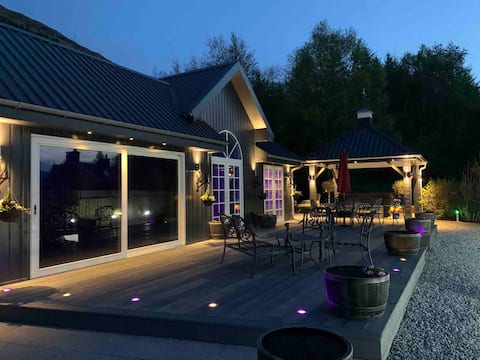
Little Fox Lodge- 5 Star luxury Hideaway GLENCOE
Entire Place • 1 bedroom
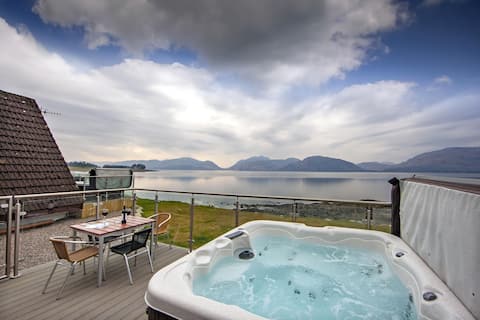
Waterfront Lodge 3 with Hot Tub
Entire Place • 2 bedrooms

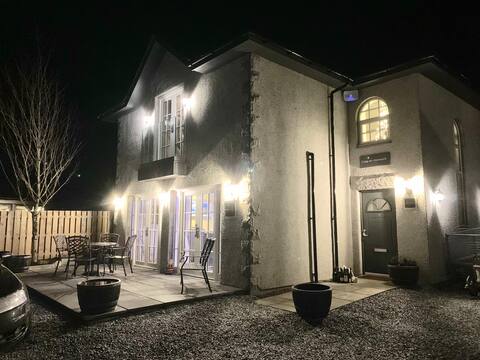
Beach House 1 with Hot Tub
Entire Place • 3 bedrooms

SKYFALL at Creag an t Sionnaich - The Foxes Rock
Entire Place • 1 bedroom

Beach House 2 with Hot Tub
Entire Place • 4 bedrooms
OUTLANDER GLENCOE New - Opening July 2021
Entire Place • 1 bedroom
Note: Performance varies based on location, size, amenities, seasonality, and management quality. Data reflects the past 12 months.
Top Performing Airbnb Hosts in Kentallen (2025)
Learn from the best! This table showcases top-performing Airbnb hosts in Kentallen based on the number of properties managed and estimated total revenue over the past year. Analyze their scale and performance metrics.
| Host Name | Properties | Grossing Revenue | Stay Reviews | Avg Rating |
|---|---|---|---|---|
| Paul | 12 | $388,011 | 506 | 4.67/5.0 |
| Mairi | 4 | $334,729 | 920 | 4.99/5.0 |
| Mourad | 2 | $87,900 | 482 | 4.97/5.0 |
| Fiona | 1 | $52,456 | 36 | 4.86/5.0 |
| Olivia | 1 | $49,970 | 90 | 4.77/5.0 |
| Wendy | 1 | $30,337 | 232 | 4.94/5.0 |
| Adam | 1 | $28,827 | 146 | 4.93/5.0 |
| Lawrence | 1 | $25,779 | 15 | 5.00/5.0 |
| Cottages | 1 | $21,543 | 3 | 4.00/5.0 |
| Host #23701935 | 1 | $2,900 | 0 | 0.00/5.0 |
Analyzing the strategies of top hosts, such as their property selection, pricing, and guest communication, can offer valuable lessons for optimizing your own Airbnb operations in Kentallen.
Dive Deeper: Advanced Kentallen STR Market Data (2025)
Ready to unlock more insights? AirROI provides access to advanced metrics and comprehensive Airbnb data for Kentallen. Explore detailed analytics beyond this report to refine your investment strategy, optimize pricing, and maximize your vacation rental profits.
Explore Advanced MetricsKentallen Short-Term Rental Market Composition (2025): Property & Room Types
Room Type Distribution
Property Type Distribution
Market Composition Insights for Kentallen
- The Kentallen Airbnb market composition is heavily skewed towards Entire Home/Apt listings, which make up 96% of the 25 active rentals. This indicates strong guest preference for privacy and space.
- Looking at the property type distribution in Kentallen, House properties are the most common (48%), reflecting the local real estate landscape.
- Houses represent a significant 48% portion, catering likely to families or larger groups.
- Smaller segments like hotel/boutique, outdoor/unique, others (combined 12.0%) offer potential for unique stay experiences.
Kentallen Airbnb Room Capacity Analysis (2025): Bedroom Distribution
Distribution of Listings by Number of Bedrooms
Room Capacity Insights for Kentallen
- The dominant room capacity in Kentallen is 2 bedrooms listings, making up 40% of the market. This suggests a strong demand for properties suitable for couples or solo travelers.
- Together, 2 bedrooms and 1 bedroom properties represent 68.0% of the active Airbnb listings in Kentallen, indicating a high concentration in these sizes.
- A significant 28.0% of listings offer 3+ bedrooms, catering to larger groups and families seeking more space in Kentallen.
Kentallen Vacation Rental Guest Capacity Trends (2025)
Distribution of Listings by Guest Capacity
Guest Capacity Insights for Kentallen
- The most common guest capacity trend in Kentallen vacation rentals is listings accommodating 5 guests (32%). This suggests the primary traveler segment is likely larger groups.
- Properties designed for 5 guests and 2 guests dominate the Kentallen STR market, accounting for 60.0% of listings.
- 24.0% of properties accommodate 6+ guests, serving the market segment for larger families or group travel in Kentallen.
- On average, properties in Kentallen are equipped to host 4.4 guests.
Kentallen Airbnb Booking Patterns (2025): Available vs. Booked Days
Available Days Distribution
Booked Days Distribution
Booking Pattern Insights for Kentallen
- The most common availability pattern in Kentallen falls within the 271-366 days range, representing 40% of listings. This suggests many properties have significant open periods on their calendars.
- Approximately 56.0% of listings show high availability (181+ days open annually), indicating potential for increased bookings or specific owner usage patterns.
- For booked days, the 181-270 days range is most frequent in Kentallen (44%), reflecting common guest stay durations or potential owner blocking patterns.
- A notable 48.0% of properties secure long booking periods (181+ days booked per year), highlighting successful long-term rental strategies or significant owner usage.
Kentallen Airbnb Minimum Stay Requirements Analysis
Distribution of Listings by Minimum Night Requirement
1 Night
12 listings
48% of total
2 Nights
4 listings
16% of total
3 Nights
1 listings
4% of total
7-29 Nights
1 listings
4% of total
30+ Nights
7 listings
28% of total
Key Insights
- The most prevalent minimum stay requirement in Kentallen is 1 Night, adopted by 48% of listings. This highlights the market's preference for shorter, flexible bookings.
- A strong majority (64.0%) of the Kentallen Airbnb data shows acceptance of very short stays (1-2 nights), indicating a dynamic, high-turnover market.
- A significant segment (28%) caters to monthly stays (30+ nights) in Kentallen, pointing to opportunities in the extended-stay market.
Recommendations
- Align with the market by considering a 1 Night minimum stay, as 48% of Kentallen hosts use this setting.
- Explore offering discounts for stays of 30+ nights to attract the 28% of the market seeking extended stays.
- Adjust minimum nights based on seasonality – potentially shorter during low season and longer during peak demand periods in Kentallen.
Kentallen Airbnb Cancellation Policy Trends Analysis (2025)
Super Strict 60 Days
13 listings
54.2% of total
Flexible
1 listings
4.2% of total
Moderate
2 listings
8.3% of total
Firm
2 listings
8.3% of total
Strict
6 listings
25% of total
Cancellation Policy Insights for Kentallen
- The prevailing Airbnb cancellation policy trend in Kentallen is Super Strict 60 Days, used by 54.2% of listings.
- There's a relatively balanced mix between guest-friendly (12.5%) and stricter (33.3%) policies, offering choices for different guest needs.
Recommendations for Hosts
- Consider adopting a Super Strict 60 Days policy to align with the 54.2% market standard in Kentallen.
- Regularly review your cancellation policy against competitors and market demand shifts in Kentallen.
Kentallen STR Booking Lead Time Analysis (2025)
Average Booking Lead Time by Month
Booking Lead Time Insights for Kentallen
- The overall average booking lead time for vacation rentals in Kentallen is 56 days.
- Guests book furthest in advance for stays during October (average 101 days), likely coinciding with peak travel demand or local events.
- The shortest booking windows occur for stays in November (average 40 days), indicating more last-minute travel plans during this time.
- Seasonally, Fall (70 days avg.) sees the longest lead times, while Spring (57 days avg.) has the shortest, reflecting typical travel planning cycles.
Recommendations for Hosts
- Use the overall average lead time (56 days) as a baseline for your pricing and availability strategy in Kentallen.
- For October stays, consider implementing length-of-stay discounts or slightly higher rates for bookings made less than 101 days out to capitalize on advance planning.
- Target marketing efforts for the Fall season well in advance (at least 70 days) to capture early planners.
- Monitor your own booking lead times against these Kentallen averages to identify opportunities for dynamic pricing adjustments.
Popular & Essential Airbnb Amenities in Kentallen (2025)
Amenity Prevalence
Amenity Insights for Kentallen
- Essential amenities in Kentallen that guests expect include: Smoke alarm, Heating, Free parking on premises, TV, Wifi, Fire extinguisher, Kitchen, Backyard, Essentials, Bed linens. Lacking these (any) could significantly impact bookings.
Recommendations for Hosts
- Ensure your listing includes all essential amenities for Kentallen: Smoke alarm, Heating, Free parking on premises, TV, Wifi, Fire extinguisher, Kitchen, Backyard, Essentials, Bed linens.
- Prioritize adding missing essentials: Fire extinguisher, Kitchen, Backyard, Essentials, Bed linens.
- Highlight unique or less common amenities you offer (e.g., hot tub, dedicated workspace, EV charger) in your listing description and photos.
- Regularly check competitor amenities in Kentallen to stay competitive.
Kentallen Airbnb Guest Demographics & Profile Analysis (2025)
Guest Profile Summary for Kentallen
- The typical guest profile for Airbnb in Kentallen consists of a mix of domestic (45%) and international guests, with top international origins including United States, typically belonging to the Post-2000s (Gen Z/Alpha) group (50%), primarily speaking English or French.
- Domestic travelers account for 45.2% of guests.
- Key international markets include United Kingdom (45.2%) and United States (29.8%).
- Top languages spoken are English (65.5%) followed by French (6.8%).
- A significant demographic segment is the Post-2000s (Gen Z/Alpha) group, representing 50% of guests.
Recommendations for Hosts
- Balance marketing efforts between domestic and international channels based on the guest mix.
- Tailor amenities and listing descriptions to appeal to the dominant Post-2000s (Gen Z/Alpha) demographic (e.g., highlight fast WiFi, smart home features, local guides).
- Highlight unique local experiences or amenities relevant to the primary guest profile.
- Consider seasonal promotions aligned with peak travel times for key origin markets.
Nearby Short-Term Rental Market Comparison
How does the Kentallen Airbnb market stack up against its neighbors? Compare key performance metrics like average monthly revenue, ADR, and occupancy rates in surrounding areas to understand the broader regional STR landscape.
| Market | Active Properties | Monthly Revenue | Daily Rate | Avg. Occupancy |
|---|---|---|---|---|
| Galston | 11 | $7,951 | $676.77 | 46% |
| Fearnan | 19 | $6,440 | $421.92 | 53% |
| Kirkhill | 10 | $5,719 | $700.26 | 44% |
| Glenachulish | 33 | $5,609 | $424.51 | 46% |
| North Kessock | 10 | $5,421 | $380.62 | 58% |
| Carbost | 26 | $5,209 | $324.31 | 62% |
| Foyers | 14 | $5,076 | $274.52 | 64% |
| Arrochar | 33 | $5,045 | $339.11 | 56% |
| Whitebridge | 10 | $4,907 | $417.35 | 42% |
| Port Failthe | 14 | $4,832 | $301.12 | 57% |