Inverurie Airbnb Market Analysis 2025: Short Term Rental Data & Vacation Rental Statistics in Scotland, United Kingdom
Is Airbnb profitable in Inverurie in 2025? Explore comprehensive Airbnb analytics for Inverurie, Scotland, United Kingdom to uncover income potential. This 2025 STR market report for Inverurie, based on AirROI data from April 2024 to March 2025, reveals key trends in the niche market of 18 active listings.
Whether you're considering an Airbnb investment in Inverurie, optimizing your existing vacation rental, or exploring rental arbitrage opportunities, understanding the Inverurie Airbnb data is crucial. Understanding the local regulations is key to maximizing your short term rental income potential. Let's dive into the specifics.
Key Inverurie Airbnb Performance Metrics Overview
Monthly Airbnb Revenue Variations & Income Potential in Inverurie (2025)
Understanding the monthly revenue variations for Airbnb listings in Inverurie is key to maximizing your short term rental income potential. Seasonality significantly impacts earnings. Our analysis, based on data from the past 12 months, shows that the peak revenue month for STRs in Inverurie is typically June, while February often presents the lowest earnings, highlighting opportunities for strategic pricing adjustments during shoulder and low seasons. Explore the typical Airbnb income in Inverurie across different performance tiers:
- Best-in-class properties (Top 10%) achieve $8,288+ monthly, often utilizing dynamic pricing and superior guest experiences.
- Strong performing properties (Top 25%) earn $4,212 or more, indicating effective management and desirable locations/amenities.
- Typical properties (Median) generate around $2,614 per month, representing the average market performance.
- Entry-level properties (Bottom 25%) see earnings around $1,739, often with potential for optimization.
Average Monthly Airbnb Earnings Trend in Inverurie
Inverurie Airbnb Occupancy Rate Trends (2025)
Maximize your bookings by understanding the Inverurie STR occupancy trends. Seasonal demand shifts significantly influence how often properties are booked. Typically, Augustsees the highest demand (peak season occupancy), while March experiences the lowest (low season). Effective strategies, like adjusting minimum stays or offering promotions, can boost occupancy during slower periods. Here's how different property tiers perform in Inverurie:
- Best-in-class properties (Top 10%) achieve 81%+ occupancy, indicating high desirability and potentially optimized availability.
- Strong performing properties (Top 25%) maintain 67% or higher occupancy, suggesting good market fit and guest satisfaction.
- Typical properties (Median) have an occupancy rate around 44%.
- Entry-level properties (Bottom 25%) average 23% occupancy, potentially facing higher vacancy.
Average Monthly Occupancy Rate Trend in Inverurie
Average Daily Rate (ADR) Airbnb Trends in Inverurie (2025)
Effective short term rental pricing strategy in Inverurie involves understanding monthly ADR fluctuations. The Average Daily Rate (ADR) for Airbnb in Inverurie typically peaks in November and dips lowest during April. Leveraging Airbnb dynamic pricing tools or strategies based on this seasonality can significantly boost revenue. Here's a look at the typical nightly rates achieved:
- Best-in-class properties (Top 10%) command rates of $520+ per night, often due to premium features or locations.
- Strong performing properties (Top 25%) achieve nightly rates of $317 or more.
- Typical properties (Median) charge around $160 per night.
- Entry-level properties (Bottom 25%) earn around $129 per night.
Average Daily Rate (ADR) Trend by Month in Inverurie
Get Live Inverurie Market Intelligence 👇

Explore Real-time Analytics
Airbnb Seasonality Analysis & Trends in Inverurie (2025)
Peak Season (June, May, August)
- Revenue averages $5,853 per month
- Occupancy rates average 53.7%
- Daily rates average $255
Shoulder Season
- Revenue averages $3,227 per month
- Occupancy maintains around 45.5%
- Daily rates hold near $286
Low Season (February, March, November)
- Revenue drops to average $2,186 per month
- Occupancy decreases to average 39.2%
- Daily rates adjust to average $318
Seasonality Insights for Inverurie
- The Airbnb seasonality in Inverurie shows highly seasonal trends requiring careful strategy. While the sections above show seasonal averages, it's also insightful to look at the extremes:
- During the high season, the absolute peak month showcases Inverurie's highest earning potential, with monthly revenues capable of climbing to $7,284, occupancy reaching a high of 63.0%, and ADRs peaking at $372.
- Conversely, the slowest single month of the year, typically falling within the low season, marks the market's lowest point. In this month, revenue might dip to $1,975, occupancy could drop to 33.2%, and ADRs may adjust down to $252.
- Understanding both the seasonal averages and these monthly peaks and troughs in revenue, occupancy, and ADR is crucial for maximizing your Airbnb profit potential in Inverurie.
Seasonal Strategies for Maximizing Profit
- Peak Season: Maximize revenue through premium pricing and potentially longer minimum stays. Ensure high availability.
- Low Season: Offer competitive pricing, special promotions (e.g., extended stay discounts), and flexible cancellation policies. Target off-season travelers like remote workers or budget-conscious guests.
- Shoulder Seasons: Implement dynamic pricing that balances peak and low rates. Target weekend travelers or specific events. Offer slightly more flexible terms than peak season.
- Regularly analyze your own performance against these Inverurie seasonality benchmarks and adjust your pricing and availability strategy accordingly.
Best Areas for Airbnb Investment in Inverurie (2025)
Exploring the top neighborhoods for short-term rentals in Inverurie? This section highlights key areas, outlining why they are attractive for hosts and guests, along with notable local attractions. Consider these locations based on your target guest profile and investment strategy.
| Neighborhood / Area | Why Host Here? (Target Guests & Appeal) | Key Attractions & Landmarks |
|---|---|---|
| Inverurie Town Centre | Vibrant hub with shops, restaurants, and direct transport links. Popular among tourists looking for a central location with easy access to local attractions and amenities. | Inverurie Market, Bennachie Viewpoint, Inverurie Golf Club, Gordon Park, The Auld Parish Church |
| Kintore | Picturesque village close to Inverurie, known for its scenic landscape and family-friendly atmosphere. Ideal for visitors seeking a quieter retreat within easy reach of the town. | Kintore Golf Club, Kintore Church, The Lairds House, Bennachie Range, Historical ruins of Kintore Castle |
| Kemnay | Charming village with beautiful countryside surrounding it. Attracts nature lovers and families looking for a peaceful stay with outdoor activities. | Kemnay Golf Club, Kemnay Community Centre, Scenic walks along the River Don, Nearby parks and nature reserves, Historic sites in and around Kemnay |
| Bennachie | A popular destination for hiking and outdoor activities, offering stunning views and trails. Great for adventure seekers and nature enthusiasts. | Bennachie Trails, Mither Tap, The Bennachie Visitor Centre, Local wildlife, Diverse flora and fauna |
| Westhill | Modern suburb of Aberdeen, offering a quieter environment with easy access to city amenities. Attracts those visiting for business or family gatherings in the area. | Westhill Shopping Centre, Parks and greenspaces, Golf courses, Excellent local dining options, Community events |
| Oldmeldrum | Historic village with traditional architecture and local charm. Appeals to visitors interested in history and culture. | Oldmeldrum Castle, Traditional Scottish pubs, Local craft shops, Meldrum House Hotel, Scenic countryside walks |
| Meldrum | Another attractive village close to Inverurie, perfect for those who want a rural escape. Great for families and group retreats. | Meldrum House Country Hotel, Historic landmarks, Local walking trails, Community festivals, Scenic viewpoints |
| Pitmedden | Small village known for its beautiful gardens and countryside. Offers a tranquil stay for those looking to explore nature and local history. | Pitmedden Garden, Local historic sites, Walks around the area, Community gardening initiatives, Scenic landscapes |
Understanding Airbnb License Requirements & STR Laws in Inverurie (2025)
With 17% of listings showing registration in 2025, understanding potential Airbnb license requirements is crucial in Inverurie. Always verify the latest short term rental regulations and Airbnb license requirements directly with local government authorities for Inverurie to ensure full compliance before hosting.
(Source: AirROI data, 2025, based on 17% licensed listings)
Top Performing Airbnb Properties in Inverurie (2025)
Benchmark your potential! Explore examples of top-performing Airbnb properties in Inveruriebased on Trailing Twelve Month (TTM) revenue. Analyze their characteristics, revenue, occupancy rate, and ADR to understand what drives success in this market.

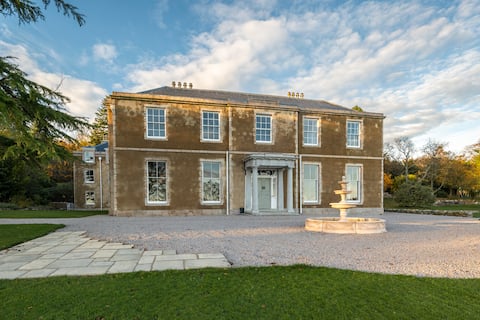
Manar House
Entire Place • 7 bedrooms
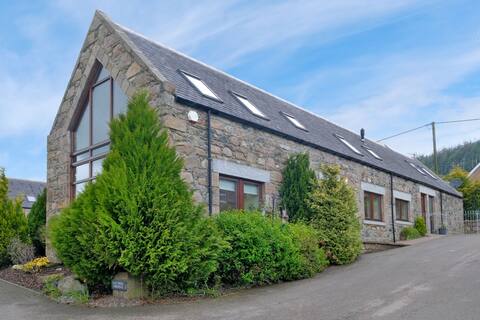
Converted Steading Barn with stunning views
Entire Place • 4 bedrooms
Manar House First Floor Apt
Entire Place • 2 bedrooms
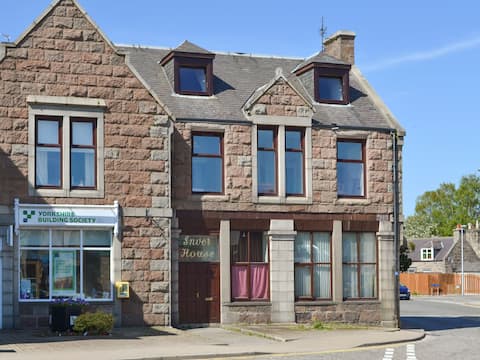
Inver House Apartment
Entire Place • 2 bedrooms
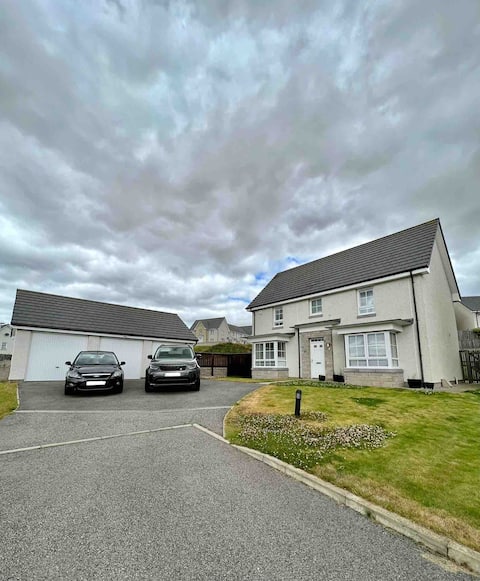
Spacious 4 bedroom home in Inverurie
Entire Place • 4 bedrooms
Manar House Second Floor Luxury Apartment
Entire Place • 3 bedrooms
Note: Performance varies based on location, size, amenities, seasonality, and management quality. Data reflects the past 12 months.
Top Performing Airbnb Hosts in Inverurie (2025)
Learn from the best! This table showcases top-performing Airbnb hosts in Inverurie based on the number of properties managed and estimated total revenue over the past year. Analyze their scale and performance metrics.
| Host Name | Properties | Grossing Revenue | Stay Reviews | Avg Rating |
|---|---|---|---|---|
| Dean | 4 | $218,488 | 5 | 1.25/5.0 |
| Lorraine | 2 | $100,591 | 206 | 4.88/5.0 |
| Cottages | 1 | $60,633 | 23 | 4.74/5.0 |
| Mellissa | 1 | $40,677 | 82 | 4.98/5.0 |
| Ross | 1 | $35,198 | 36 | 5.00/5.0 |
| Fiona | 1 | $33,382 | 40 | 4.98/5.0 |
| Susan | 1 | $28,328 | 62 | 4.97/5.0 |
| Chris | 1 | $26,103 | 82 | 4.96/5.0 |
| Josh | 2 | $23,940 | 71 | 4.88/5.0 |
| Host #288170386 | 1 | $18,810 | 1 | 0.00/5.0 |
Analyzing the strategies of top hosts, such as their property selection, pricing, and guest communication, can offer valuable lessons for optimizing your own Airbnb operations in Inverurie.
Dive Deeper: Advanced Inverurie STR Market Data (2025)
Ready to unlock more insights? AirROI provides access to advanced metrics and comprehensive Airbnb data for Inverurie. Explore detailed analytics beyond this report to refine your investment strategy, optimize pricing, and maximize your vacation rental profits.
Explore Advanced MetricsInverurie Short-Term Rental Market Composition (2025): Property & Room Types
Room Type Distribution
Property Type Distribution
Market Composition Insights for Inverurie
- The Inverurie Airbnb market composition is heavily skewed towards Entire Home/Apt listings, which make up 100% of the 18 active rentals. This indicates strong guest preference for privacy and space.
- Looking at the property type distribution in Inverurie, Apartment/Condo properties are the most common (44.4%), reflecting the local real estate landscape.
- Houses represent a significant 33.3% portion, catering likely to families or larger groups.
Inverurie Airbnb Room Capacity Analysis (2025): Bedroom Distribution
Distribution of Listings by Number of Bedrooms
Room Capacity Insights for Inverurie
- The dominant room capacity in Inverurie is 2 bedrooms listings, making up 44.4% of the market. This suggests a strong demand for properties suitable for couples or solo travelers.
- Together, 2 bedrooms and 1 bedroom properties represent 66.6% of the active Airbnb listings in Inverurie, indicating a high concentration in these sizes.
- A significant 33.4% of listings offer 3+ bedrooms, catering to larger groups and families seeking more space in Inverurie.
Inverurie Vacation Rental Guest Capacity Trends (2025)
Distribution of Listings by Guest Capacity
Guest Capacity Insights for Inverurie
- The most common guest capacity trend in Inverurie vacation rentals is listings accommodating 4 guests (44.4%). This suggests the primary traveler segment is likely small families or groups.
- Properties designed for 4 guests and 8+ guests dominate the Inverurie STR market, accounting for 61.1% of listings.
- 33.4% of properties accommodate 6+ guests, serving the market segment for larger families or group travel in Inverurie.
- On average, properties in Inverurie are equipped to host 4.7 guests.
Inverurie Airbnb Booking Patterns (2025): Available vs. Booked Days
Available Days Distribution
Booked Days Distribution
Booking Pattern Insights for Inverurie
- The most common availability pattern in Inverurie falls within the 91-180 days range, representing 33.3% of listings. This suggests many properties have significant open periods on their calendars.
- Approximately 61.1% of listings show high availability (181+ days open annually), indicating potential for increased bookings or specific owner usage patterns.
- For booked days, the 91-180 days range is most frequent in Inverurie (27.8%), reflecting common guest stay durations or potential owner blocking patterns.
- A notable 38.9% of properties secure long booking periods (181+ days booked per year), highlighting successful long-term rental strategies or significant owner usage.
Inverurie Airbnb Minimum Stay Requirements Analysis
Distribution of Listings by Minimum Night Requirement
1 Night
4 listings
22.2% of total
2 Nights
8 listings
44.4% of total
3 Nights
1 listings
5.6% of total
30+ Nights
5 listings
27.8% of total
Key Insights
- The most prevalent minimum stay requirement in Inverurie is 2 Nights, adopted by 44.4% of listings. This highlights the market's preference for shorter, flexible bookings.
- A strong majority (66.6%) of the Inverurie Airbnb data shows acceptance of very short stays (1-2 nights), indicating a dynamic, high-turnover market.
- A significant segment (27.8%) caters to monthly stays (30+ nights) in Inverurie, pointing to opportunities in the extended-stay market.
Recommendations
- Align with the market by considering a 2 Nights minimum stay, as 44.4% of Inverurie hosts use this setting.
- If feasible, allowing 1-night stays, especially midweek or during low season, could capture last-minute bookings, as only 22.2% currently do.
- Explore offering discounts for stays of 30+ nights to attract the 27.8% of the market seeking extended stays.
- Adjust minimum nights based on seasonality – potentially shorter during low season and longer during peak demand periods in Inverurie.
Inverurie Airbnb Cancellation Policy Trends Analysis (2025)
Super Strict 60 Days
1 listings
7.7% of total
Flexible
4 listings
30.8% of total
Moderate
1 listings
7.7% of total
Firm
4 listings
30.8% of total
Strict
3 listings
23.1% of total
Cancellation Policy Insights for Inverurie
- The prevailing Airbnb cancellation policy trend in Inverurie is Flexible, used by 30.8% of listings.
- A majority (53.9%) of hosts in Inverurie utilize Firm or Strict policies, indicating a market where hosts prioritize booking security.
Recommendations for Hosts
- Consider adopting a Flexible policy to align with the 30.8% market standard in Inverurie.
- Regularly review your cancellation policy against competitors and market demand shifts in Inverurie.
Inverurie STR Booking Lead Time Analysis (2025)
Average Booking Lead Time by Month
Booking Lead Time Insights for Inverurie
- The overall average booking lead time for vacation rentals in Inverurie is 55 days.
- Guests book furthest in advance for stays during July (average 103 days), likely coinciding with peak travel demand or local events.
- The shortest booking windows occur for stays in February (average 34 days), indicating more last-minute travel plans during this time.
- Seasonally, Summer (86 days avg.) sees the longest lead times, while Winter (52 days avg.) has the shortest, reflecting typical travel planning cycles.
Recommendations for Hosts
- Use the overall average lead time (55 days) as a baseline for your pricing and availability strategy in Inverurie.
- For July stays, consider implementing length-of-stay discounts or slightly higher rates for bookings made less than 103 days out to capitalize on advance planning.
- Target marketing efforts for the Summer season well in advance (at least 86 days) to capture early planners.
- Monitor your own booking lead times against these Inverurie averages to identify opportunities for dynamic pricing adjustments.
Popular & Essential Airbnb Amenities in Inverurie (2025)
Amenity Prevalence
Amenity Insights for Inverurie
- Essential amenities in Inverurie that guests expect include: Wifi, Smoke alarm, TV, Heating. Lacking these (any) could significantly impact bookings.
- Popular amenities like Essentials, Kitchen, Washer are common but not universal. Offering these can provide a competitive edge.
Recommendations for Hosts
- Ensure your listing includes all essential amenities for Inverurie: Wifi, Smoke alarm, TV, Heating.
- Consider adding popular differentiators like Essentials or Kitchen to increase appeal.
- Highlight unique or less common amenities you offer (e.g., hot tub, dedicated workspace, EV charger) in your listing description and photos.
- Regularly check competitor amenities in Inverurie to stay competitive.
Inverurie Airbnb Guest Demographics & Profile Analysis (2025)
Guest Profile Summary for Inverurie
- The typical guest profile for Airbnb in Inverurie consists of primarily domestic travelers (77%), often arriving from nearby Scotland, typically belonging to the Post-2000s (Gen Z/Alpha) group (50%), primarily speaking English or French.
- Domestic travelers account for 77.1% of guests.
- Key international markets include United Kingdom (77.1%) and United States (9%).
- Top languages spoken are English (64.6%) followed by French (7.7%).
- A significant demographic segment is the Post-2000s (Gen Z/Alpha) group, representing 50% of guests.
Recommendations for Hosts
- Target domestic marketing efforts towards travelers from Scotland and Glasgow.
- Tailor amenities and listing descriptions to appeal to the dominant Post-2000s (Gen Z/Alpha) demographic (e.g., highlight fast WiFi, smart home features, local guides).
- Highlight unique local experiences or amenities relevant to the primary guest profile.
- Consider seasonal promotions aligned with peak travel times for key origin markets.
Nearby Short-Term Rental Market Comparison
How does the Inverurie Airbnb market stack up against its neighbors? Compare key performance metrics like average monthly revenue, ADR, and occupancy rates in surrounding areas to understand the broader regional STR landscape.
| Market | Active Properties | Monthly Revenue | Daily Rate | Avg. Occupancy |
|---|---|---|---|---|
| Bridge of Cally | 16 | $5,839 | $566.24 | 50% |
| Kenmore | 10 | $4,507 | $430.34 | 41% |
| Insh | 14 | $4,473 | $289.96 | 63% |
| Auchtermuchty | 11 | $3,979 | $365.72 | 50% |
| Gleneagles | 10 | $3,964 | $284.15 | 45% |
| Leuchars | 16 | $3,949 | $400.90 | 43% |
| St Andrews | 359 | $3,908 | $373.13 | 50% |
| North Berwick | 94 | $3,893 | $330.02 | 52% |
| Gilmerton | 10 | $3,872 | $440.46 | 35% |
| Mount Melville | 15 | $3,842 | $264.66 | 46% |