Inverkeithing Airbnb Market Analysis 2025: Short Term Rental Data & Vacation Rental Statistics in Scotland, United Kingdom
Is Airbnb profitable in Inverkeithing in 2025? Explore comprehensive Airbnb analytics for Inverkeithing, Scotland, United Kingdom to uncover income potential. This 2025 STR market report for Inverkeithing, based on AirROI data from April 2024 to March 2025, reveals key trends in the niche market of 19 active listings.
Whether you're considering an Airbnb investment in Inverkeithing, optimizing your existing vacation rental, or exploring rental arbitrage opportunities, understanding the Inverkeithing Airbnb data is crucial. Understanding the local regulations is key to maximizing your short term rental income potential. Let's dive into the specifics.
Key Inverkeithing Airbnb Performance Metrics Overview
Monthly Airbnb Revenue Variations & Income Potential in Inverkeithing (2025)
Understanding the monthly revenue variations for Airbnb listings in Inverkeithing is key to maximizing your short term rental income potential. Seasonality significantly impacts earnings. Our analysis, based on data from the past 12 months, shows that the peak revenue month for STRs in Inverkeithing is typically August, while January often presents the lowest earnings, highlighting opportunities for strategic pricing adjustments during shoulder and low seasons. Explore the typical Airbnb income in Inverkeithing across different performance tiers:
- Best-in-class properties (Top 10%) achieve $4,133+ monthly, often utilizing dynamic pricing and superior guest experiences.
- Strong performing properties (Top 25%) earn $3,278 or more, indicating effective management and desirable locations/amenities.
- Typical properties (Median) generate around $2,038 per month, representing the average market performance.
- Entry-level properties (Bottom 25%) see earnings around $1,314, often with potential for optimization.
Average Monthly Airbnb Earnings Trend in Inverkeithing
Inverkeithing Airbnb Occupancy Rate Trends (2025)
Maximize your bookings by understanding the Inverkeithing STR occupancy trends. Seasonal demand shifts significantly influence how often properties are booked. Typically, Augustsees the highest demand (peak season occupancy), while February experiences the lowest (low season). Effective strategies, like adjusting minimum stays or offering promotions, can boost occupancy during slower periods. Here's how different property tiers perform in Inverkeithing:
- Best-in-class properties (Top 10%) achieve 87%+ occupancy, indicating high desirability and potentially optimized availability.
- Strong performing properties (Top 25%) maintain 70% or higher occupancy, suggesting good market fit and guest satisfaction.
- Typical properties (Median) have an occupancy rate around 53%.
- Entry-level properties (Bottom 25%) average 37% occupancy, potentially facing higher vacancy.
Average Monthly Occupancy Rate Trend in Inverkeithing
Average Daily Rate (ADR) Airbnb Trends in Inverkeithing (2025)
Effective short term rental pricing strategy in Inverkeithing involves understanding monthly ADR fluctuations. The Average Daily Rate (ADR) for Airbnb in Inverkeithing typically peaks in December and dips lowest during April. Leveraging Airbnb dynamic pricing tools or strategies based on this seasonality can significantly boost revenue. Here's a look at the typical nightly rates achieved:
- Best-in-class properties (Top 10%) command rates of $467+ per night, often due to premium features or locations.
- Strong performing properties (Top 25%) achieve nightly rates of $182 or more.
- Typical properties (Median) charge around $137 per night.
- Entry-level properties (Bottom 25%) earn around $80 per night.
Average Daily Rate (ADR) Trend by Month in Inverkeithing
Get Live Inverkeithing Market Intelligence 👇

Explore Real-time Analytics
Airbnb Seasonality Analysis & Trends in Inverkeithing (2025)
Peak Season (August, May, July)
- Revenue averages $3,313 per month
- Occupancy rates average 70.5%
- Daily rates average $170
Shoulder Season
- Revenue averages $2,511 per month
- Occupancy maintains around 59.4%
- Daily rates hold near $184
Low Season (January, February, March)
- Revenue drops to average $1,152 per month
- Occupancy decreases to average 30.1%
- Daily rates adjust to average $213
Seasonality Insights for Inverkeithing
- The Airbnb seasonality in Inverkeithing shows highly seasonal trends requiring careful strategy. While the sections above show seasonal averages, it's also insightful to look at the extremes:
- During the high season, the absolute peak month showcases Inverkeithing's highest earning potential, with monthly revenues capable of climbing to $3,510, occupancy reaching a high of 74.8%, and ADRs peaking at $224.
- Conversely, the slowest single month of the year, typically falling within the low season, marks the market's lowest point. In this month, revenue might dip to $1,001, occupancy could drop to 25.4%, and ADRs may adjust down to $162.
- Understanding both the seasonal averages and these monthly peaks and troughs in revenue, occupancy, and ADR is crucial for maximizing your Airbnb profit potential in Inverkeithing.
Seasonal Strategies for Maximizing Profit
- Peak Season: Maximize revenue through premium pricing and potentially longer minimum stays. Ensure high availability.
- Low Season: Offer competitive pricing, special promotions (e.g., extended stay discounts), and flexible cancellation policies. Target off-season travelers like remote workers or budget-conscious guests.
- Shoulder Seasons: Implement dynamic pricing that balances peak and low rates. Target weekend travelers or specific events. Offer slightly more flexible terms than peak season.
- Regularly analyze your own performance against these Inverkeithing seasonality benchmarks and adjust your pricing and availability strategy accordingly.
Best Areas for Airbnb Investment in Inverkeithing (2025)
Exploring the top neighborhoods for short-term rentals in Inverkeithing? This section highlights key areas, outlining why they are attractive for hosts and guests, along with notable local attractions. Consider these locations based on your target guest profile and investment strategy.
| Neighborhood / Area | Why Host Here? (Target Guests & Appeal) | Key Attractions & Landmarks |
|---|---|---|
| Forth Bridge | A UNESCO World Heritage site known for its iconic design and historical significance. Attracts tourists and history lovers, making it an ideal location for short-term rentals. | Forth Bridge, Firth of Forth, The Queensferry Crossing, Inverkeithing Harbour, Local walking trails |
| Inverkeithing Town Centre | A central area offering easy access to local amenities, shops, and transport. Ideal for visitors looking for convenience and a local experience. | Local shops and cafes, Inverkeithing Town Hall, Historic buildings, Nearby parks, Transport links to Edinburgh |
| Pittencrieff Park | A large public park in nearby Dunfermline, perfect for family outings and nature lovers. Attracts visitors looking for outdoor experiences and tranquility. | Beautiful gardens, Play areas for children, Petanque courts, Walking paths, Events and festivals in the park |
| Culross | A picturesque village known for its preserved plan and stunning views over the Firth of Forth. A favorite spot for visitors seeking historic charm and scenic views. | Culross Palace, Historic streets and buildings, Gardens and viewpoints, Culross Abbey, Sites featured in Outlander |
| Dunfermline | Nearby city with rich history and significant attractions. Well connected to Inverkeithing and attractive to visitors in the Fife area. | Dunfermline Abbey, Andrew Carnegie Birthplace Museum, Pittencrieff Park, Dunfermline Town Centre, Historic architecture |
| Kingdom of Fife | The wider area offers diverse attractions ranging from coastal towns to historic sites. It attracts tourists interested in exploring Scotland. | St Andrews, Anstruther, Falkland Palace, Coastal walks and nature reserves, Fishing villages |
| North Queensferry | Another picturesque village at the foot of the Forth Bridge, offering stunning views and close proximity to attractions and transport. | Deep Sea World, Forth Road Bridge, The nearby beach, Coastal paths, Scenic viewpoints |
| West Fife Woodlands | Perfect for nature lovers and those seeking outdoor adventures with a network of trails and beautiful scenery. | Walking and hiking trails, Wildlife watching, Natural beauty, Local flora and fauna, Peaceful environment |
Understanding Airbnb License Requirements & STR Laws in Inverkeithing (2025)
With 16% of listings showing registration in 2025, understanding potential Airbnb license requirements is crucial in Inverkeithing. Always verify the latest short term rental regulations and Airbnb license requirements directly with local government authorities for Inverkeithing to ensure full compliance before hosting.
(Source: AirROI data, 2025, based on 16% licensed listings)
Top Performing Airbnb Properties in Inverkeithing (2025)
Benchmark your potential! Explore examples of top-performing Airbnb properties in Inverkeithingbased on Trailing Twelve Month (TTM) revenue. Analyze their characteristics, revenue, occupancy rate, and ADR to understand what drives success in this market.
Hillbank, around 20 minutes by train to Edinburgh
Entire Place • 3 bedrooms
Super Prime East Coast Executive Inverkeithing
Entire Place • 2 bedrooms
3 bedroom home-inverkeithing
Entire Place • 3 bedrooms

Executive Apartment By Inverkeithing Train Station
Entire Place • 1 bedroom
Spacious home close to Edinburgh and airport
Entire Place • 2 bedrooms
Luxury flat, 20 minutes by train to Edinburgh
Entire Place • 2 bedrooms
Note: Performance varies based on location, size, amenities, seasonality, and management quality. Data reflects the past 12 months.
Top Performing Airbnb Hosts in Inverkeithing (2025)
Learn from the best! This table showcases top-performing Airbnb hosts in Inverkeithing based on the number of properties managed and estimated total revenue over the past year. Analyze their scale and performance metrics.
| Host Name | Properties | Grossing Revenue | Stay Reviews | Avg Rating |
|---|---|---|---|---|
| Adrian | 2 | $51,950 | 156 | 4.90/5.0 |
| Sarah | 1 | $50,460 | 222 | 4.98/5.0 |
| Kashif | 1 | $46,264 | 20 | 4.85/5.0 |
| Sheza | 1 | $42,684 | 33 | 4.79/5.0 |
| Asif | 1 | $36,707 | 7 | 4.57/5.0 |
| Mike | 1 | $29,506 | 30 | 4.77/5.0 |
| Eric | 1 | $27,576 | 60 | 4.97/5.0 |
| Ian | 2 | $26,208 | 183 | 4.77/5.0 |
| Paul | 1 | $23,252 | 22 | 5.00/5.0 |
| Host #234697273 | 1 | $18,689 | 53 | 4.51/5.0 |
Analyzing the strategies of top hosts, such as their property selection, pricing, and guest communication, can offer valuable lessons for optimizing your own Airbnb operations in Inverkeithing.
Dive Deeper: Advanced Inverkeithing STR Market Data (2025)
Ready to unlock more insights? AirROI provides access to advanced metrics and comprehensive Airbnb data for Inverkeithing. Explore detailed analytics beyond this report to refine your investment strategy, optimize pricing, and maximize your vacation rental profits.
Explore Advanced MetricsInverkeithing Short-Term Rental Market Composition (2025): Property & Room Types
Room Type Distribution
Property Type Distribution
Market Composition Insights for Inverkeithing
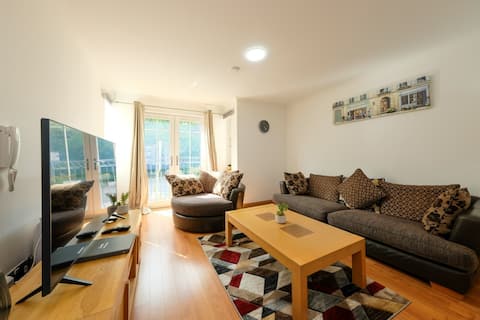
- The Inverkeithing Airbnb market composition is heavily skewed towards Entire Home/Apt listings, which make up 73.7% of the 19 active rentals. This indicates strong guest preference for privacy and space.
- Looking at the property type distribution in Inverkeithing, Apartment/Condo properties are the most common (57.9%), reflecting the local real estate landscape.
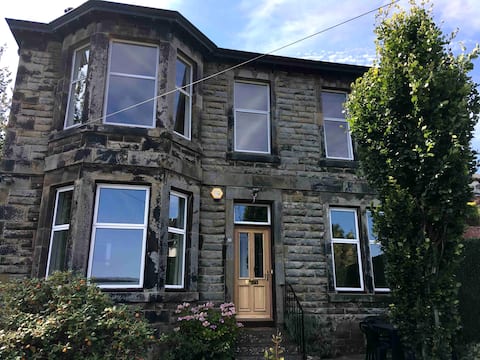
- Houses represent a significant 42.1% portion, catering likely to families or larger groups.
Inverkeithing Airbnb Room Capacity Analysis (2025): Bedroom Distribution
Distribution of Listings by Number of Bedrooms
Room Capacity Insights for Inverkeithing
- The dominant room capacity in Inverkeithing is 2 bedrooms listings, making up 36.8% of the market. This suggests a strong demand for properties suitable for couples or solo travelers.
- Together, 2 bedrooms and 1 bedroom properties represent 57.9% of the active Airbnb listings in Inverkeithing, indicating a high concentration in these sizes.
Inverkeithing Vacation Rental Guest Capacity Trends (2025)
Distribution of Listings by Guest Capacity
Guest Capacity Insights for Inverkeithing
- The most common guest capacity trend in Inverkeithing vacation rentals is listings accommodating 6 guests (26.3%). This suggests the primary traveler segment is likely larger groups.
- Properties designed for 6 guests and 4 guests dominate the Inverkeithing STR market, accounting for 52.6% of listings.
- 31.6% of properties accommodate 6+ guests, serving the market segment for larger families or group travel in Inverkeithing.
- On average, properties in Inverkeithing are equipped to host 3.4 guests.
Inverkeithing Airbnb Booking Patterns (2025): Available vs. Booked Days
Available Days Distribution
Booked Days Distribution
Booking Pattern Insights for Inverkeithing
- The most common availability pattern in Inverkeithing falls within the 181-270 days range, representing 42.1% of listings. This suggests many properties have significant open periods on their calendars.
- Approximately 57.9% of listings show high availability (181+ days open annually), indicating potential for increased bookings or specific owner usage patterns.
- For booked days, the 91-180 days range is most frequent in Inverkeithing (42.1%), reflecting common guest stay durations or potential owner blocking patterns.
- A notable 42.1% of properties secure long booking periods (181+ days booked per year), highlighting successful long-term rental strategies or significant owner usage.
Inverkeithing Airbnb Minimum Stay Requirements Analysis
Distribution of Listings by Minimum Night Requirement
1 Night
4 listings
25% of total
2 Nights
3 listings
18.8% of total
3 Nights
5 listings
31.3% of total
4-6 Nights
2 listings
12.5% of total
7-29 Nights
1 listings
6.3% of total
30+ Nights
1 listings
6.3% of total
Key Insights
- The most prevalent minimum stay requirement in Inverkeithing is 3 Nights, adopted by 31.3% of listings. This highlights the market's preference for longer commitments.
Recommendations
- Align with the market by considering a 3 Nights minimum stay, as 31.3% of Inverkeithing hosts use this setting.
- If feasible, allowing 1-night stays, especially midweek or during low season, could capture last-minute bookings, as only 25% currently do.
- Explore offering discounts for stays of 30+ nights to attract the 6.3% of the market seeking extended stays.
- Adjust minimum nights based on seasonality – potentially shorter during low season and longer during peak demand periods in Inverkeithing.
Inverkeithing Airbnb Cancellation Policy Trends Analysis (2025)
Refundable
1 listings
5.6% of total
Flexible
6 listings
33.3% of total
Moderate
4 listings
22.2% of total
Firm
4 listings
22.2% of total
Strict
3 listings
16.7% of total
Cancellation Policy Insights for Inverkeithing
- The prevailing Airbnb cancellation policy trend in Inverkeithing is Flexible, used by 33.3% of listings.
- There's a relatively balanced mix between guest-friendly (55.5%) and stricter (38.9%) policies, offering choices for different guest needs.
Recommendations for Hosts
- Consider adopting a Flexible policy to align with the 33.3% market standard in Inverkeithing.
- Regularly review your cancellation policy against competitors and market demand shifts in Inverkeithing.
Inverkeithing STR Booking Lead Time Analysis (2025)
Average Booking Lead Time by Month
Booking Lead Time Insights for Inverkeithing
- The overall average booking lead time for vacation rentals in Inverkeithing is 50 days.
- Guests book furthest in advance for stays during June (average 73 days), likely coinciding with peak travel demand or local events.
- The shortest booking windows occur for stays in November (average 40 days), indicating more last-minute travel plans during this time.
- Seasonally, Summer (69 days avg.) sees the longest lead times, while Fall (43 days avg.) has the shortest, reflecting typical travel planning cycles.
Recommendations for Hosts
- Use the overall average lead time (50 days) as a baseline for your pricing and availability strategy in Inverkeithing.
- For June stays, consider implementing length-of-stay discounts or slightly higher rates for bookings made less than 73 days out to capitalize on advance planning.
- Target marketing efforts for the Summer season well in advance (at least 69 days) to capture early planners.
- Monitor your own booking lead times against these Inverkeithing averages to identify opportunities for dynamic pricing adjustments.
Popular & Essential Airbnb Amenities in Inverkeithing (2025)
Amenity Prevalence
Amenity Insights for Inverkeithing
- Essential amenities in Inverkeithing that guests expect include: Hot water, Wifi, Carbon monoxide alarm, Smoke alarm, Heating. Lacking these (any) could significantly impact bookings.
- Popular amenities like Washer, Kitchen, Essentials are common but not universal. Offering these can provide a competitive edge.
Recommendations for Hosts
- Ensure your listing includes all essential amenities for Inverkeithing: Hot water, Wifi, Carbon monoxide alarm, Smoke alarm, Heating.
- Consider adding popular differentiators like Washer or Kitchen to increase appeal.
- Highlight unique or less common amenities you offer (e.g., hot tub, dedicated workspace, EV charger) in your listing description and photos.
- Regularly check competitor amenities in Inverkeithing to stay competitive.
Inverkeithing Airbnb Guest Demographics & Profile Analysis (2025)
Guest Profile Summary for Inverkeithing
- The typical guest profile for Airbnb in Inverkeithing consists of predominantly international visitors (69%), with top international origins including United States, typically belonging to the Post-2000s (Gen Z/Alpha) group (50%), primarily speaking English or French.
- Domestic travelers account for 31.4% of guests.
- Key international markets include United Kingdom (31.4%) and United States (16.5%).
- Top languages spoken are English (53.8%) followed by French (7.2%).
- A significant demographic segment is the Post-2000s (Gen Z/Alpha) group, representing 50% of guests.
Recommendations for Hosts
- Focus marketing internationally, particularly towards travelers from United States.
- Tailor amenities and listing descriptions to appeal to the dominant Post-2000s (Gen Z/Alpha) demographic (e.g., highlight fast WiFi, smart home features, local guides).
- Highlight unique local experiences or amenities relevant to the primary guest profile.
- Consider seasonal promotions aligned with peak travel times for key origin markets.
Nearby Short-Term Rental Market Comparison
How does the Inverkeithing Airbnb market stack up against its neighbors? Compare key performance metrics like average monthly revenue, ADR, and occupancy rates in surrounding areas to understand the broader regional STR landscape.
| Market | Active Properties | Monthly Revenue | Daily Rate | Avg. Occupancy |
|---|---|---|---|---|
| Galston | 11 | $7,951 | $676.77 | 46% |
| Fearnan | 19 | $6,440 | $421.92 | 53% |
| Gorebridge | 12 | $6,209 | $493.62 | 54% |
| Bridge of Cally | 16 | $5,839 | $566.24 | 50% |
| Kirkhill | 10 | $5,719 | $700.26 | 44% |
| North Kessock | 10 | $5,421 | $380.62 | 58% |
| Foyers | 14 | $5,076 | $274.52 | 64% |
| Arrochar | 33 | $5,045 | $339.11 | 56% |
| Whitebridge | 10 | $4,907 | $417.35 | 42% |
| Acharn | 10 | $4,813 | $278.43 | 57% |