Glendale Airbnb Market Analysis 2025: Short Term Rental Data & Vacation Rental Statistics in Scotland, United Kingdom
Is Airbnb profitable in Glendale in 2025? Explore comprehensive Airbnb analytics for Glendale, Scotland, United Kingdom to uncover income potential. This 2025 STR market report for Glendale, based on AirROI data from April 2024 to March 2025, reveals key trends in the niche market of 46 active listings.
Whether you're considering an Airbnb investment in Glendale, optimizing your existing vacation rental, or exploring rental arbitrage opportunities, understanding the Glendale Airbnb data is crucial. Navigating the high regulation landscape is key to maximizing your short term rental income potential. Let's dive into the specifics.
Key Glendale Airbnb Performance Metrics Overview
Monthly Airbnb Revenue Variations & Income Potential in Glendale (2025)
Understanding the monthly revenue variations for Airbnb listings in Glendale is key to maximizing your short term rental income potential. Seasonality significantly impacts earnings. Our analysis, based on data from the past 12 months, shows that the peak revenue month for STRs in Glendale is typically August, while March often presents the lowest earnings, highlighting opportunities for strategic pricing adjustments during shoulder and low seasons. Explore the typical Airbnb income in Glendale across different performance tiers:
- Best-in-class properties (Top 10%) achieve $9,146+ monthly, often utilizing dynamic pricing and superior guest experiences.
- Strong performing properties (Top 25%) earn $5,801 or more, indicating effective management and desirable locations/amenities.
- Typical properties (Median) generate around $3,624 per month, representing the average market performance.
- Entry-level properties (Bottom 25%) see earnings around $2,540, often with potential for optimization.
Average Monthly Airbnb Earnings Trend in Glendale
Glendale Airbnb Occupancy Rate Trends (2025)
Maximize your bookings by understanding the Glendale STR occupancy trends. Seasonal demand shifts significantly influence how often properties are booked. Typically, Augustsees the highest demand (peak season occupancy), while March experiences the lowest (low season). Effective strategies, like adjusting minimum stays or offering promotions, can boost occupancy during slower periods. Here's how different property tiers perform in Glendale:
- Best-in-class properties (Top 10%) achieve 87%+ occupancy, indicating high desirability and potentially optimized availability.
- Strong performing properties (Top 25%) maintain 73% or higher occupancy, suggesting good market fit and guest satisfaction.
- Typical properties (Median) have an occupancy rate around 60%.
- Entry-level properties (Bottom 25%) average 39% occupancy, potentially facing higher vacancy.
Average Monthly Occupancy Rate Trend in Glendale
Average Daily Rate (ADR) Airbnb Trends in Glendale (2025)
Effective short term rental pricing strategy in Glendale involves understanding monthly ADR fluctuations. The Average Daily Rate (ADR) for Airbnb in Glendale typically peaks in July and dips lowest during November. Leveraging Airbnb dynamic pricing tools or strategies based on this seasonality can significantly boost revenue. Here's a look at the typical nightly rates achieved:
- Best-in-class properties (Top 10%) command rates of $505+ per night, often due to premium features or locations.
- Strong performing properties (Top 25%) achieve nightly rates of $337 or more.
- Typical properties (Median) charge around $188 per night.
- Entry-level properties (Bottom 25%) earn around $140 per night.
Average Daily Rate (ADR) Trend by Month in Glendale
Get Live Glendale Market Intelligence 👇

Explore Real-time Analytics
Airbnb Seasonality Analysis & Trends in Glendale (2025)
Peak Season (August, May, July)
- Revenue averages $6,987 per month
- Occupancy rates average 77.1%
- Daily rates average $302
Shoulder Season
- Revenue averages $4,519 per month
- Occupancy maintains around 58.5%
- Daily rates hold near $269
Low Season (January, February, March)
- Revenue drops to average $2,428 per month
- Occupancy decreases to average 32.9%
- Daily rates adjust to average $242
Seasonality Insights for Glendale
- The Airbnb seasonality in Glendale shows highly seasonal trends requiring careful strategy. While the sections above show seasonal averages, it's also insightful to look at the extremes:
- During the high season, the absolute peak month showcases Glendale's highest earning potential, with monthly revenues capable of climbing to $7,637, occupancy reaching a high of 81.7%, and ADRs peaking at $307.
- Conversely, the slowest single month of the year, typically falling within the low season, marks the market's lowest point. In this month, revenue might dip to $1,912, occupancy could drop to 30.1%, and ADRs may adjust down to $233.
- Understanding both the seasonal averages and these monthly peaks and troughs in revenue, occupancy, and ADR is crucial for maximizing your Airbnb profit potential in Glendale.
Seasonal Strategies for Maximizing Profit
- Peak Season: Maximize revenue through premium pricing and potentially longer minimum stays. Ensure high availability.
- Low Season: Offer competitive pricing, special promotions (e.g., extended stay discounts), and flexible cancellation policies. Target off-season travelers like remote workers or budget-conscious guests.
- Shoulder Seasons: Implement dynamic pricing that balances peak and low rates. Target weekend travelers or specific events. Offer slightly more flexible terms than peak season.
- Regularly analyze your own performance against these Glendale seasonality benchmarks and adjust your pricing and availability strategy accordingly.
Best Areas for Airbnb Investment in Glendale (2025)
Exploring the top neighborhoods for short-term rentals in Glendale? This section highlights key areas, outlining why they are attractive for hosts and guests, along with notable local attractions. Consider these locations based on your target guest profile and investment strategy.
| Neighborhood / Area | Why Host Here? (Target Guests & Appeal) | Key Attractions & Landmarks |
|---|---|---|
| Glendale Town Centre | The heart of Glendale, offering a mix of shops, restaurants, and cultural attractions. Ideal for visitors looking for convenience and local experiences. | Glendale Gallery, Glendale Park, The Historic Alex Theatre, City Hall, Shopping at The Americana at Brand |
| Verdugo Mountains | A serene and scenic area perfect for nature lovers and outdoor enthusiasts. A great location for hosting guests looking to escape the city and explore nature. | Griffith Park, Hiking Trails, Observation Points, Picnic Areas, Natural Scenery |
| Montrose Shopping Park | A quaint area filled with unique boutiques and cozy cafes. A scenic spot that attracts visitors looking for a charming shopping experience. | Artisan Shops, Local Cafes, Montrose Farmers Market, Community Events, Historic Village |
| Glendale Galleria | One of the largest shopping malls in California, popular with tourists and locals alike. A hub of activity with plenty of dining options. | Glendale Galleria, Dining Options, Entertainment Venues, Fashion Stores, Family-friendly Spaces |
| Forest Lawn Memorial Park | Famous for its beautiful landscapes and art. This location attracts visitors interested in art, culture, and history. | Forest Lawn Museum, Scenic Views, Art Exhibitions, Historical Significance, Cultural Events |
| Crescenta Valley | A residential area that offers a peaceful and family-friendly environment. Ideal for hosting families seeking a quiet stay. | Local Parks, Schools and Libraries, Community Events, Quiet Streets, Affordable Accommodations |
| Brand Park | Known for its beautiful gardens and historical sites. A perfect place for tourists and those seeking a tranquil environment. | Brand Library, Gardens, Picnic Areas, Walking Trails, Art Installations |
| South Glendale | A diverse area with various dining options and local culture. This neighborhood offers a vibrant community experience for visitors. | Local Diners and Cafes, Cultural Festivals, Art Exhibitions, Shopping Areas, Community Parks |
Understanding Airbnb License Requirements & STR Laws in Glendale (2025)
Yes, Glendale, Scotland, United Kingdom enforces high STR regulations. Obtaining a license and ensuring compliance is almost certainly required according to current 2025 STR laws. Always verify the latest short term rental regulations and Airbnb license requirements directly with local government authorities for Glendale to ensure full compliance before hosting.
(Source: AirROI data, 2025, based on 41% licensed listings)
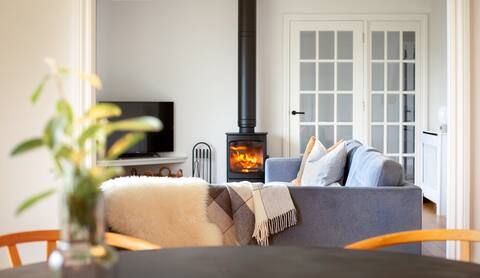
Top Performing Airbnb Properties in Glendale (2025)
Benchmark your potential! Explore examples of top-performing Airbnb properties in Glendalebased on Trailing Twelve Month (TTM) revenue. Analyze their characteristics, revenue, occupancy rate, and ADR to understand what drives success in this market.
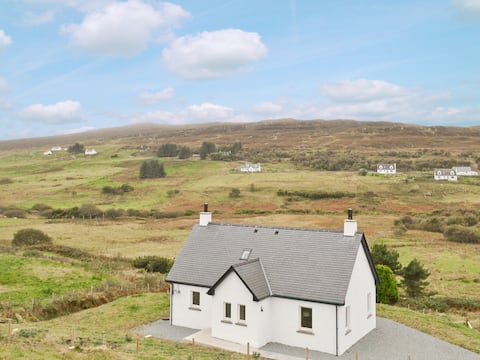
The West Nest - A luxury cottage with sea views
Entire Place • 2 bedrooms
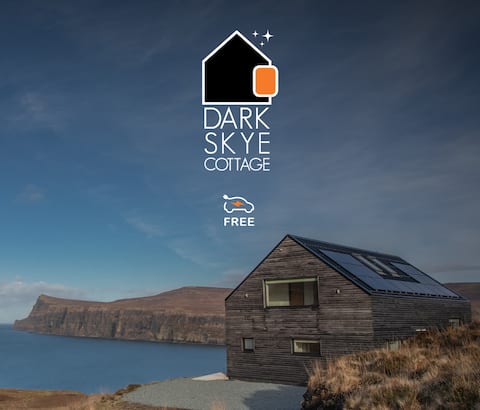
Dark Skye Cottage
Entire Place • 2 bedrooms
Springburn Cottage
Entire Place • 2 bedrooms

Luxury Bed & Breakfast Sleeps 4, Dinner available.
Private Room • 2 bedrooms

Skye eco house fab location views lochs,mountains
Entire Place • 2 bedrooms

Lochview
Entire Place • 2 bedrooms
Note: Performance varies based on location, size, amenities, seasonality, and management quality. Data reflects the past 12 months.
Top Performing Airbnb Hosts in Glendale (2025)
Learn from the best! This table showcases top-performing Airbnb hosts in Glendale based on the number of properties managed and estimated total revenue over the past year. Analyze their scale and performance metrics.
| Host Name | Properties | Grossing Revenue | Stay Reviews | Avg Rating |
|---|---|---|---|---|
| Cottages | 9 | $461,399 | 99 | 4.23/5.0 |
| Alan & Gill | 2 | $148,300 | 134 | 4.92/5.0 |
| Gordon | 1 | $114,410 | 35 | 5.00/5.0 |
| Sally | 1 | $107,145 | 23 | 5.00/5.0 |
| Ann | 2 | $99,126 | 67 | 4.96/5.0 |
| Graham | 1 | $91,306 | 38 | 4.97/5.0 |
| Jeni | 3 | $90,149 | 457 | 4.88/5.0 |
| Juliet | 1 | $88,528 | 35 | 4.77/5.0 |
| Heidi | 2 | $79,155 | 447 | 4.95/5.0 |
| Wendy | 1 | $73,136 | 13 | 4.77/5.0 |
Analyzing the strategies of top hosts, such as their property selection, pricing, and guest communication, can offer valuable lessons for optimizing your own Airbnb operations in Glendale.
Dive Deeper: Advanced Glendale STR Market Data (2025)
Ready to unlock more insights? AirROI provides access to advanced metrics and comprehensive Airbnb data for Glendale. Explore detailed analytics beyond this report to refine your investment strategy, optimize pricing, and maximize your vacation rental profits.
Explore Advanced MetricsGlendale Short-Term Rental Market Composition (2025): Property & Room Types
Room Type Distribution
Property Type Distribution
Market Composition Insights for Glendale
- The Glendale Airbnb market composition is heavily skewed towards Entire Home/Apt listings, which make up 93.5% of the 46 active rentals. This indicates strong guest preference for privacy and space.
- Looking at the property type distribution in Glendale, House properties are the most common (76.1%), reflecting the local real estate landscape.
- Houses represent a significant 76.1% portion, catering likely to families or larger groups.
- Smaller segments like others, unique stays, hotel/boutique (combined 8.7%) offer potential for unique stay experiences.
Glendale Airbnb Room Capacity Analysis (2025): Bedroom Distribution
Distribution of Listings by Number of Bedrooms
Room Capacity Insights for Glendale
- The dominant room capacity in Glendale is 1 bedroom listings, making up 43.5% of the market. This suggests a strong demand for properties suitable for couples or solo travelers.
- Together, 1 bedroom and 2 bedrooms properties represent 80.5% of the active Airbnb listings in Glendale, indicating a high concentration in these sizes.
Glendale Vacation Rental Guest Capacity Trends (2025)
Distribution of Listings by Guest Capacity
Guest Capacity Insights for Glendale
- The most common guest capacity trend in Glendale vacation rentals is listings accommodating 2 guests (47.8%). This suggests the primary traveler segment is likely couples or solo travelers.
- Properties designed for 2 guests and 4 guests dominate the Glendale STR market, accounting for 78.2% of listings.
- A significant 47.8% of listings cater specifically to 1-2 guests, highlighting strong demand from couples and solo travelers in Glendale.
- On average, properties in Glendale are equipped to host 3.0 guests.
Glendale Airbnb Booking Patterns (2025): Available vs. Booked Days
Available Days Distribution
Booked Days Distribution
Booking Pattern Insights for Glendale
- The most common availability pattern in Glendale falls within the 91-180 days range, representing 47.8% of listings. This suggests many properties have significant open periods on their calendars.
- Approximately 39.2% of listings show high availability (181+ days open annually), indicating potential for increased bookings or specific owner usage patterns.
- For booked days, the 181-270 days range is most frequent in Glendale (50%), reflecting common guest stay durations or potential owner blocking patterns.
- A notable 63.0% of properties secure long booking periods (181+ days booked per year), highlighting successful long-term rental strategies or significant owner usage.
Glendale Airbnb Minimum Stay Requirements Analysis
Distribution of Listings by Minimum Night Requirement
1 Night
11 listings
24.4% of total
2 Nights
6 listings
13.3% of total
3 Nights
10 listings
22.2% of total
4-6 Nights
9 listings
20% of total
7-29 Nights
1 listings
2.2% of total
30+ Nights
8 listings
17.8% of total
Key Insights
- The most prevalent minimum stay requirement in Glendale is 1 Night, adopted by 24.4% of listings. This highlights the market's preference for shorter, flexible bookings.
- A significant segment (17.8%) caters to monthly stays (30+ nights) in Glendale, pointing to opportunities in the extended-stay market.
Recommendations
- Align with the market by considering a 1 Night minimum stay, as 24.4% of Glendale hosts use this setting.
- If feasible, allowing 1-night stays, especially midweek or during low season, could capture last-minute bookings, as only 24.4% currently do.
- Explore offering discounts for stays of 30+ nights to attract the 17.8% of the market seeking extended stays.
- Adjust minimum nights based on seasonality – potentially shorter during low season and longer during peak demand periods in Glendale.
Glendale Airbnb Cancellation Policy Trends Analysis (2025)
Super Strict 60 Days
9 listings
20.5% of total
Super Strict 30 Days
2 listings
4.5% of total
Flexible
8 listings
18.2% of total
Moderate
8 listings
18.2% of total
Firm
10 listings
22.7% of total
Strict
7 listings
15.9% of total
Cancellation Policy Insights for Glendale
- The prevailing Airbnb cancellation policy trend in Glendale is Firm, used by 22.7% of listings.
- There's a relatively balanced mix between guest-friendly (36.4%) and stricter (38.6%) policies, offering choices for different guest needs.
Recommendations for Hosts
- Consider adopting a Firm policy to align with the 22.7% market standard in Glendale.
- Regularly review your cancellation policy against competitors and market demand shifts in Glendale.
Glendale STR Booking Lead Time Analysis (2025)
Average Booking Lead Time by Month
Booking Lead Time Insights for Glendale
- The overall average booking lead time for vacation rentals in Glendale is 84 days.
- Guests book furthest in advance for stays during May (average 123 days), likely coinciding with peak travel demand or local events.
- The shortest booking windows occur for stays in February (average 65 days), indicating more last-minute travel plans during this time.
- Seasonally, Summer (104 days avg.) sees the longest lead times, while Winter (72 days avg.) has the shortest, reflecting typical travel planning cycles.
Recommendations for Hosts
- Use the overall average lead time (84 days) as a baseline for your pricing and availability strategy in Glendale.
- For May stays, consider implementing length-of-stay discounts or slightly higher rates for bookings made less than 123 days out to capitalize on advance planning.
- Target marketing efforts for the Summer season well in advance (at least 104 days) to capture early planners.
- Monitor your own booking lead times against these Glendale averages to identify opportunities for dynamic pricing adjustments.
Popular & Essential Airbnb Amenities in Glendale (2025)
Amenity Prevalence
Amenity Insights for Glendale
- Essential amenities in Glendale that guests expect include: Heating, Smoke alarm, Free parking on premises. Lacking these (any) could significantly impact bookings.
- Popular amenities like Wifi, Fire extinguisher, TV are common but not universal. Offering these can provide a competitive edge.
- Warning: Wifi is not universally provided but is considered essential globally. Ensure reliable Wifi is offered.
Recommendations for Hosts
- Ensure your listing includes all essential amenities for Glendale: Heating, Smoke alarm, Free parking on premises.
- Prioritize adding missing essentials: Free parking on premises.
- Consider adding popular differentiators like Wifi or Fire extinguisher to increase appeal.
- Highlight unique or less common amenities you offer (e.g., hot tub, dedicated workspace, EV charger) in your listing description and photos.
- Regularly check competitor amenities in Glendale to stay competitive.
Glendale Airbnb Guest Demographics & Profile Analysis (2025)
Guest Profile Summary for Glendale
- The typical guest profile for Airbnb in Glendale consists of predominantly international visitors (71%), with top international origins including United States, typically belonging to the Post-2000s (Gen Z/Alpha) group (50%), primarily speaking English or French.
- Domestic travelers account for 29.4% of guests.
- Key international markets include United Kingdom (29.4%) and United States (23.8%).
- Top languages spoken are English (50.7%) followed by French (12.9%).
- A significant demographic segment is the Post-2000s (Gen Z/Alpha) group, representing 50% of guests.
Recommendations for Hosts
- Focus marketing internationally, particularly towards travelers from United States.
- Tailor amenities and listing descriptions to appeal to the dominant Post-2000s (Gen Z/Alpha) demographic (e.g., highlight fast WiFi, smart home features, local guides).
- Highlight unique local experiences or amenities relevant to the primary guest profile.
- Consider seasonal promotions aligned with peak travel times for key origin markets.
Nearby Short-Term Rental Market Comparison
How does the Glendale Airbnb market stack up against its neighbors? Compare key performance metrics like average monthly revenue, ADR, and occupancy rates in surrounding areas to understand the broader regional STR landscape.
| Market | Active Properties | Monthly Revenue | Daily Rate | Avg. Occupancy |
|---|---|---|---|---|
| Glenachulish | 33 | $5,609 | $424.51 | 46% |
| Carbost | 26 | $5,209 | $324.31 | 62% |
| Port Failthe | 14 | $4,832 | $301.12 | 57% |
| Camuscross | 11 | $4,649 | $300.59 | 61% |
| Culnacnoc | 16 | $4,576 | $299.16 | 60% |
| Corran | 24 | $4,576 | $370.68 | 45% |
| Portree | 190 | $4,227 | $258.97 | 60% |
| Benderloch | 14 | $4,218 | $364.53 | 55% |
| Stein | 14 | $4,160 | $249.21 | 72% |
| North Ballachulish | 34 | $4,144 | $288.28 | 47% |