Glenachulish Airbnb Market Analysis 2025: Short Term Rental Data & Vacation Rental Statistics in Scotland, United Kingdom
Is Airbnb profitable in Glenachulish in 2025? Explore comprehensive Airbnb analytics for Glenachulish, Scotland, United Kingdom to uncover income potential. This 2025 STR market report for Glenachulish, based on AirROI data from April 2024 to March 2025, reveals key trends in the niche market of 33 active listings.
Whether you're considering an Airbnb investment in Glenachulish, optimizing your existing vacation rental, or exploring rental arbitrage opportunities, understanding the Glenachulish Airbnb data is crucial. Understanding the local regulations is key to maximizing your short term rental income potential. Let's dive into the specifics.
Key Glenachulish Airbnb Performance Metrics Overview
Monthly Airbnb Revenue Variations & Income Potential in Glenachulish (2025)
Understanding the monthly revenue variations for Airbnb listings in Glenachulish is key to maximizing your short term rental income potential. Seasonality significantly impacts earnings. Our analysis, based on data from the past 12 months, shows that the peak revenue month for STRs in Glenachulish is typically May, while February often presents the lowest earnings, highlighting opportunities for strategic pricing adjustments during shoulder and low seasons. Explore the typical Airbnb income in Glenachulish across different performance tiers:
- Best-in-class properties (Top 10%) achieve $15,310+ monthly, often utilizing dynamic pricing and superior guest experiences.
- Strong performing properties (Top 25%) earn $8,652 or more, indicating effective management and desirable locations/amenities.
- Typical properties (Median) generate around $5,115 per month, representing the average market performance.
- Entry-level properties (Bottom 25%) see earnings around $2,755, often with potential for optimization.
Average Monthly Airbnb Earnings Trend in Glenachulish
Glenachulish Airbnb Occupancy Rate Trends (2025)
Maximize your bookings by understanding the Glenachulish STR occupancy trends. Seasonal demand shifts significantly influence how often properties are booked. Typically, Augustsees the highest demand (peak season occupancy), while February experiences the lowest (low season). Effective strategies, like adjusting minimum stays or offering promotions, can boost occupancy during slower periods. Here's how different property tiers perform in Glenachulish:
- Best-in-class properties (Top 10%) achieve 80%+ occupancy, indicating high desirability and potentially optimized availability.
- Strong performing properties (Top 25%) maintain 64% or higher occupancy, suggesting good market fit and guest satisfaction.
- Typical properties (Median) have an occupancy rate around 47%.
- Entry-level properties (Bottom 25%) average 25% occupancy, potentially facing higher vacancy.
Average Monthly Occupancy Rate Trend in Glenachulish
Average Daily Rate (ADR) Airbnb Trends in Glenachulish (2025)
Effective short term rental pricing strategy in Glenachulish involves understanding monthly ADR fluctuations. The Average Daily Rate (ADR) for Airbnb in Glenachulish typically peaks in August and dips lowest during March. Leveraging Airbnb dynamic pricing tools or strategies based on this seasonality can significantly boost revenue. Here's a look at the typical nightly rates achieved:
- Best-in-class properties (Top 10%) command rates of $837+ per night, often due to premium features or locations.
- Strong performing properties (Top 25%) achieve nightly rates of $604 or more.
- Typical properties (Median) charge around $284 per night.
- Entry-level properties (Bottom 25%) earn around $236 per night.
Average Daily Rate (ADR) Trend by Month in Glenachulish
Get Live Glenachulish Market Intelligence 👇

Explore Real-time Analytics
Airbnb Seasonality Analysis & Trends in Glenachulish (2025)
Peak Season (May, April, August)
- Revenue averages $9,205 per month
- Occupancy rates average 55.2%
- Daily rates average $446
Shoulder Season
- Revenue averages $6,646 per month
- Occupancy maintains around 47.3%
- Daily rates hold near $433
Low Season (February, March, November)
- Revenue drops to average $4,079 per month
- Occupancy decreases to average 35.3%
- Daily rates adjust to average $349
Seasonality Insights for Glenachulish
- The Airbnb seasonality in Glenachulish shows highly seasonal trends requiring careful strategy. While the sections above show seasonal averages, it's also insightful to look at the extremes:
- During the high season, the absolute peak month showcases Glenachulish's highest earning potential, with monthly revenues capable of climbing to $9,983, occupancy reaching a high of 59.5%, and ADRs peaking at $475.
- Conversely, the slowest single month of the year, typically falling within the low season, marks the market's lowest point. In this month, revenue might dip to $3,496, occupancy could drop to 29.6%, and ADRs may adjust down to $336.
- Understanding both the seasonal averages and these monthly peaks and troughs in revenue, occupancy, and ADR is crucial for maximizing your Airbnb profit potential in Glenachulish.
Seasonal Strategies for Maximizing Profit
- Peak Season: Maximize revenue through premium pricing and potentially longer minimum stays. Ensure high availability.
- Low Season: Offer competitive pricing, special promotions (e.g., extended stay discounts), and flexible cancellation policies. Target off-season travelers like remote workers or budget-conscious guests.
- Shoulder Seasons: Implement dynamic pricing that balances peak and low rates. Target weekend travelers or specific events. Offer slightly more flexible terms than peak season.
- Regularly analyze your own performance against these Glenachulish seasonality benchmarks and adjust your pricing and availability strategy accordingly.
Best Areas for Airbnb Investment in Glenachulish (2025)
Exploring the top neighborhoods for short-term rentals in Glenachulish? This section highlights key areas, outlining why they are attractive for hosts and guests, along with notable local attractions. Consider these locations based on your target guest profile and investment strategy.
| Neighborhood / Area | Why Host Here? (Target Guests & Appeal) | Key Attractions & Landmarks |
|---|---|---|
| Loch Leven | Stunning scenery and outdoor activities around the Loch make it a popular destination for nature enthusiasts and families. Great for those looking for tranquil lakeside retreats. | Loch Leven Castle, RSPB Loch Leven Nature Reserve, Cycling around the Loch, Fishing in Loch Leven, Walking trails around the area |
| Glencoe | Famous for its breathtaking glens and towering mountains, Glencoe attracts hikers and climbers. Known for dramatic landscapes, it is ideal for adventure tourism. | Three Sisters of Glencoe, Glencoe Visitor Centre, Hiking and climbing routes, Scenic drives, Photography opportunities |
| Fort William | The outdoor capital of the UK with access to numerous adventure sports and stunning landscapes. | Ben Nevis, West Highland Museum, Steam train rides on the Jacobite, Outdoor activities |
| Oban | A bustling seaside town known for its seafood and ferry links to the Hebrides, Oban is a popular base for exploring the west coast of Scotland. | Oban Distillery, McCaig's Tower, Oban War and Peace Museum, Ferry trips to the islands |
| Ballachulish | A picturesque village located near Glencoe, ideal for those looking for both beautiful scenery and access to hiking trails and outdoor adventures. | Ballachulish Bridge, Nearby hiking routes, The Pap of Glencoe, Local shops and restaurants |
| Tyndrum | A small village known for its spectacular views and as a stop on the West Highland Way, attracting walkers and outdoor lovers. | The West Highland Way, Nearby hills and lochs, Historic sites nearby |
| Inveraray | A charming town on the shores of Loch Fyne, known for its historic castle and beautiful scenery, perfect for romantic getaways and family trips. | Inveraray Castle, Inveraray Jail, Loch Fyne |
| Dalmally | A quieter spot surrounded by beautiful nature, ideal for those wanting to escape the crowds and enjoy a peaceful stay with good access to the Highlands. | Glen Orchy, St Conan's Kirk, Walking and cycling paths |
Understanding Airbnb License Requirements & STR Laws in Glenachulish (2025)
With 21% of listings showing registration in 2025, understanding potential Airbnb license requirements is crucial in Glenachulish. Always verify the latest short term rental regulations and Airbnb license requirements directly with local government authorities for Glenachulish to ensure full compliance before hosting.
(Source: AirROI data, 2025, based on 21% licensed listings)
Top Performing Airbnb Properties in Glenachulish (2025)
Benchmark your potential! Explore examples of top-performing Airbnb properties in Glenachulishbased on Trailing Twelve Month (TTM) revenue. Analyze their characteristics, revenue, occupancy rate, and ADR to understand what drives success in this market.
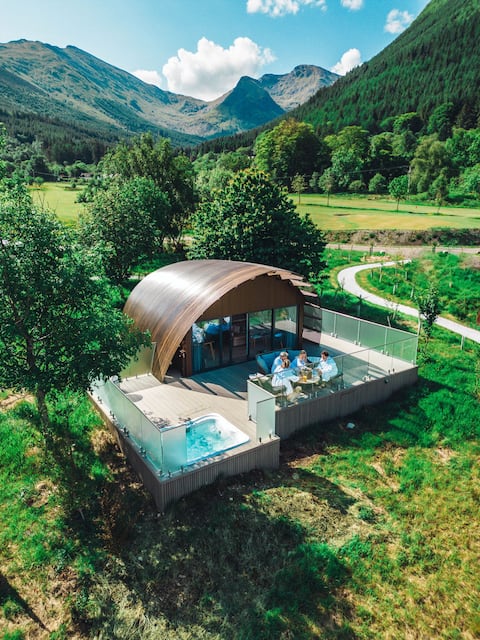
SeaBed Luxury Lookout with Hot Tub "Wave"
Entire Place • 1 bedroom
SeaBed Luxury Lookout with Hot Tub "Samphire"
Entire Place • 1 bedroom

SeaBeds, Luxury Lookouts with Hot Tub "Heron"
Entire Place • 1 bedroom
SeaBed Luxury Lookout with Hot Tub "Moonglade"
Entire Place • 1 bedroom

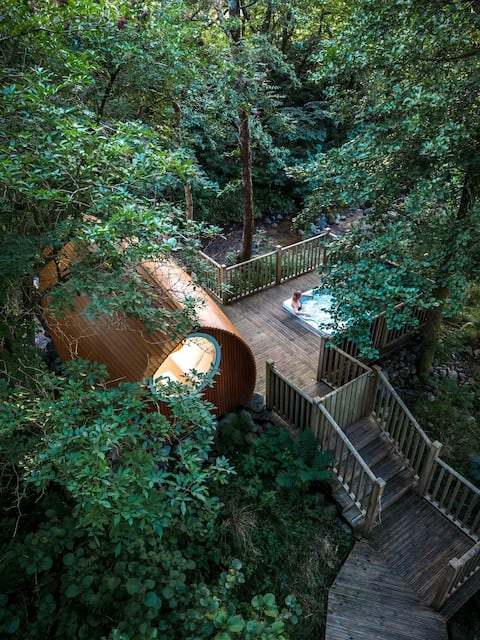
RiverBeds Luxury Lodge & Hot Tub "Rowan"
Entire Place • 1 bedroom
RiverBeds Luxury Wee Lodge with Hot Tub "Hawthorn"
Private Room • 1 bedroom
Note: Performance varies based on location, size, amenities, seasonality, and management quality. Data reflects the past 12 months.
Top Performing Airbnb Hosts in Glenachulish (2025)
Learn from the best! This table showcases top-performing Airbnb hosts in Glenachulish based on the number of properties managed and estimated total revenue over the past year. Analyze their scale and performance metrics.
| Host Name | Properties | Grossing Revenue | Stay Reviews | Avg Rating |
|---|---|---|---|---|
| Woodlands | 15 | $1,604,113 | 806 | 4.72/5.0 |
| Regina | 2 | $143,325 | 401 | 4.80/5.0 |
| Pete | 1 | $81,117 | 254 | 4.68/5.0 |
| Elizabeth | 2 | $78,597 | 327 | 4.96/5.0 |
| Caroline | 2 | $73,931 | 324 | 4.89/5.0 |
| Paul | 2 | $55,651 | 98 | 4.84/5.0 |
| Mary | 1 | $53,771 | 165 | 5.00/5.0 |
| Ashley | 2 | $43,141 | 1257 | 4.88/5.0 |
| Lawrence | 1 | $33,601 | 67 | 5.00/5.0 |
| Michael | 1 | $30,143 | 196 | 4.80/5.0 |
Analyzing the strategies of top hosts, such as their property selection, pricing, and guest communication, can offer valuable lessons for optimizing your own Airbnb operations in Glenachulish.
Dive Deeper: Advanced Glenachulish STR Market Data (2025)
Ready to unlock more insights? AirROI provides access to advanced metrics and comprehensive Airbnb data for Glenachulish. Explore detailed analytics beyond this report to refine your investment strategy, optimize pricing, and maximize your vacation rental profits.
Explore Advanced MetricsGlenachulish Short-Term Rental Market Composition (2025): Property & Room Types
Room Type Distribution
Property Type Distribution
Market Composition Insights for Glenachulish
- The Glenachulish Airbnb market composition is heavily skewed towards Entire Home/Apt listings, which make up 69.7% of the 33 active rentals. This indicates strong guest preference for privacy and space.
- However, a notable 30.3% share for Private Rooms suggests opportunities for budget-conscious travelers or hosts renting out spare rooms.
- Looking at the property type distribution in Glenachulish, House properties are the most common (51.5%), reflecting the local real estate landscape.
- Houses represent a significant 51.5% portion, catering likely to families or larger groups.
- The presence of 6.1% Hotel/Boutique listings indicates integration with traditional hospitality.
- Smaller segments like others (combined 3.0%) offer potential for unique stay experiences.
Glenachulish Airbnb Room Capacity Analysis (2025): Bedroom Distribution
Distribution of Listings by Number of Bedrooms
Room Capacity Insights for Glenachulish
- The dominant room capacity in Glenachulish is 1 bedroom listings, making up 51.5% of the market. This suggests a strong demand for properties suitable for couples or solo travelers.
- Together, 1 bedroom and 2 bedrooms properties represent 69.7% of the active Airbnb listings in Glenachulish, indicating a high concentration in these sizes.
- With over half the market (51.5%) consisting of studios or 1-bedroom units, Glenachulish is particularly well-suited for individuals or couples.
- Listings with 3+ bedrooms (9.0%) represent a smaller niche, potentially indicating an underserved market for larger group accommodations in Glenachulish.
Glenachulish Vacation Rental Guest Capacity Trends (2025)
Distribution of Listings by Guest Capacity
Guest Capacity Insights for Glenachulish
- The most common guest capacity trend in Glenachulish vacation rentals is listings accommodating 2 guests (30.3%). This suggests the primary traveler segment is likely couples or solo travelers.
- Properties designed for 2 guests and 4 guests dominate the Glenachulish STR market, accounting for 57.6% of listings.
- 18.2% of properties accommodate 6+ guests, serving the market segment for larger families or group travel in Glenachulish.
- On average, properties in Glenachulish are equipped to host 3.1 guests.
Glenachulish Airbnb Booking Patterns (2025): Available vs. Booked Days
Available Days Distribution
Booked Days Distribution
Booking Pattern Insights for Glenachulish
- The most common availability pattern in Glenachulish falls within the 91-180 days range, representing 45.5% of listings. This suggests many properties have significant open periods on their calendars.
- Approximately 54.6% of listings show high availability (181+ days open annually), indicating potential for increased bookings or specific owner usage patterns.
- For booked days, the 181-270 days range is most frequent in Glenachulish (45.5%), reflecting common guest stay durations or potential owner blocking patterns.
- A notable 45.5% of properties secure long booking periods (181+ days booked per year), highlighting successful long-term rental strategies or significant owner usage.
Glenachulish Airbnb Minimum Stay Requirements Analysis
Distribution of Listings by Minimum Night Requirement
1 Night
22 listings
68.8% of total
2 Nights
5 listings
15.6% of total
3 Nights
1 listings
3.1% of total
30+ Nights
4 listings
12.5% of total
Key Insights
- The most prevalent minimum stay requirement in Glenachulish is 1 Night, adopted by 68.8% of listings. This highlights the market's preference for shorter, flexible bookings.
- A strong majority (84.4%) of the Glenachulish Airbnb data shows acceptance of very short stays (1-2 nights), indicating a dynamic, high-turnover market.
- A significant segment (12.5%) caters to monthly stays (30+ nights) in Glenachulish, pointing to opportunities in the extended-stay market.
Recommendations
- Align with the market by considering a 1 Night minimum stay, as 68.8% of Glenachulish hosts use this setting.
- Explore offering discounts for stays of 30+ nights to attract the 12.5% of the market seeking extended stays.
- Adjust minimum nights based on seasonality – potentially shorter during low season and longer during peak demand periods in Glenachulish.
Glenachulish Airbnb Cancellation Policy Trends Analysis (2025)
Super Strict 60 Days
2 listings
6.1% of total
Super Strict 30 Days
5 listings
15.2% of total
Flexible
2 listings
6.1% of total
Moderate
3 listings
9.1% of total
Firm
2 listings
6.1% of total
Strict
19 listings
57.6% of total
Cancellation Policy Insights for Glenachulish
- The prevailing Airbnb cancellation policy trend in Glenachulish is Strict, used by 57.6% of listings.
- A majority (63.7%) of hosts in Glenachulish utilize Firm or Strict policies, indicating a market where hosts prioritize booking security.
Recommendations for Hosts
- Consider adopting a Strict policy to align with the 57.6% market standard in Glenachulish.
- With 57.6% using Strict terms, this is a viable option in Glenachulish, particularly for high-value properties or during peak demand periods.
- Regularly review your cancellation policy against competitors and market demand shifts in Glenachulish.
Glenachulish STR Booking Lead Time Analysis (2025)
Average Booking Lead Time by Month
Booking Lead Time Insights for Glenachulish
- The overall average booking lead time for vacation rentals in Glenachulish is 50 days.
- Guests book furthest in advance for stays during July (average 80 days), likely coinciding with peak travel demand or local events.
- The shortest booking windows occur for stays in March (average 22 days), indicating more last-minute travel plans during this time.
- Seasonally, Summer (71 days avg.) sees the longest lead times, while Winter (35 days avg.) has the shortest, reflecting typical travel planning cycles.
Recommendations for Hosts
- Use the overall average lead time (50 days) as a baseline for your pricing and availability strategy in Glenachulish.
- For July stays, consider implementing length-of-stay discounts or slightly higher rates for bookings made less than 80 days out to capitalize on advance planning.
- Target marketing efforts for the Summer season well in advance (at least 71 days) to capture early planners.
- Monitor your own booking lead times against these Glenachulish averages to identify opportunities for dynamic pricing adjustments.
Popular & Essential Airbnb Amenities in Glenachulish (2025)
Amenity Prevalence
Amenity Insights for Glenachulish
- Essential amenities in Glenachulish that guests expect include: Smoke alarm, Essentials, Wifi, Heating, Free parking on premises, TV. Lacking these (any) could significantly impact bookings.
- Popular amenities like Bed linens, Hangers, Hair dryer are common but not universal. Offering these can provide a competitive edge.
Recommendations for Hosts
- Ensure your listing includes all essential amenities for Glenachulish: Smoke alarm, Essentials, Wifi, Heating, Free parking on premises, TV.
- Prioritize adding missing essentials: TV.
- Consider adding popular differentiators like Bed linens or Hangers to increase appeal.
- Highlight unique or less common amenities you offer (e.g., hot tub, dedicated workspace, EV charger) in your listing description and photos.
- Regularly check competitor amenities in Glenachulish to stay competitive.
Glenachulish Airbnb Guest Demographics & Profile Analysis (2025)
Guest Profile Summary for Glenachulish
- The typical guest profile for Airbnb in Glenachulish consists of a mix of domestic (36%) and international guests, with top international origins including United States, typically belonging to the Post-2000s (Gen Z/Alpha) group (50%), primarily speaking English or French.
- Domestic travelers account for 36.2% of guests.
- Key international markets include United Kingdom (36.2%) and United States (24.8%).
- Top languages spoken are English (56.6%) followed by French (11%).
- A significant demographic segment is the Post-2000s (Gen Z/Alpha) group, representing 50% of guests.
Recommendations for Hosts
- Focus marketing internationally, particularly towards travelers from United States.
- Tailor amenities and listing descriptions to appeal to the dominant Post-2000s (Gen Z/Alpha) demographic (e.g., highlight fast WiFi, smart home features, local guides).
- Highlight unique local experiences or amenities relevant to the primary guest profile.
- Consider seasonal promotions aligned with peak travel times for key origin markets.
Nearby Short-Term Rental Market Comparison
How does the Glenachulish Airbnb market stack up against its neighbors? Compare key performance metrics like average monthly revenue, ADR, and occupancy rates in surrounding areas to understand the broader regional STR landscape.
| Market | Active Properties | Monthly Revenue | Daily Rate | Avg. Occupancy |
|---|---|---|---|---|
| Galston | 11 | $7,951 | $676.77 | 46% |
| Fearnan | 19 | $6,440 | $421.92 | 53% |
| Kirkhill | 10 | $5,719 | $700.26 | 44% |
| North Kessock | 10 | $5,421 | $380.62 | 58% |
| Carbost | 26 | $5,209 | $324.31 | 62% |
| Foyers | 14 | $5,076 | $274.52 | 64% |
| Arrochar | 33 | $5,045 | $339.11 | 56% |
| Whitebridge | 10 | $4,907 | $417.35 | 42% |
| Port Failthe | 14 | $4,832 | $301.12 | 57% |
| Acharn | 10 | $4,813 | $278.43 | 57% |