Fortrose Airbnb Market Analysis 2025: Short Term Rental Data & Vacation Rental Statistics in Scotland, United Kingdom
Is Airbnb profitable in Fortrose in 2025? Explore comprehensive Airbnb analytics for Fortrose, Scotland, United Kingdom to uncover income potential. This 2025 STR market report for Fortrose, based on AirROI data from April 2024 to March 2025, reveals key trends in the niche market of 20 active listings.
Whether you're considering an Airbnb investment in Fortrose, optimizing your existing vacation rental, or exploring rental arbitrage opportunities, understanding the Fortrose Airbnb data is crucial. Understanding the local regulations is key to maximizing your short term rental income potential. Let's dive into the specifics.
Key Fortrose Airbnb Performance Metrics Overview
Monthly Airbnb Revenue Variations & Income Potential in Fortrose (2025)
Understanding the monthly revenue variations for Airbnb listings in Fortrose is key to maximizing your short term rental income potential. Seasonality significantly impacts earnings. Our analysis, based on data from the past 12 months, shows that the peak revenue month for STRs in Fortrose is typically August, while January often presents the lowest earnings, highlighting opportunities for strategic pricing adjustments during shoulder and low seasons. Explore the typical Airbnb income in Fortrose across different performance tiers:
- Best-in-class properties (Top 10%) achieve $5,621+ monthly, often utilizing dynamic pricing and superior guest experiences.
- Strong performing properties (Top 25%) earn $3,722 or more, indicating effective management and desirable locations/amenities.
- Typical properties (Median) generate around $2,482 per month, representing the average market performance.
- Entry-level properties (Bottom 25%) see earnings around $1,599, often with potential for optimization.
Average Monthly Airbnb Earnings Trend in Fortrose
Fortrose Airbnb Occupancy Rate Trends (2025)
Maximize your bookings by understanding the Fortrose STR occupancy trends. Seasonal demand shifts significantly influence how often properties are booked. Typically, Julysees the highest demand (peak season occupancy), while January experiences the lowest (low season). Effective strategies, like adjusting minimum stays or offering promotions, can boost occupancy during slower periods. Here's how different property tiers perform in Fortrose:
- Best-in-class properties (Top 10%) achieve 83%+ occupancy, indicating high desirability and potentially optimized availability.
- Strong performing properties (Top 25%) maintain 70% or higher occupancy, suggesting good market fit and guest satisfaction.
- Typical properties (Median) have an occupancy rate around 54%.
- Entry-level properties (Bottom 25%) average 30% occupancy, potentially facing higher vacancy.
Average Monthly Occupancy Rate Trend in Fortrose
Average Daily Rate (ADR) Airbnb Trends in Fortrose (2025)
Effective short term rental pricing strategy in Fortrose involves understanding monthly ADR fluctuations. The Average Daily Rate (ADR) for Airbnb in Fortrose typically peaks in August and dips lowest during February. Leveraging Airbnb dynamic pricing tools or strategies based on this seasonality can significantly boost revenue. Here's a look at the typical nightly rates achieved:
- Best-in-class properties (Top 10%) command rates of $427+ per night, often due to premium features or locations.
- Strong performing properties (Top 25%) achieve nightly rates of $229 or more.
- Typical properties (Median) charge around $142 per night.
- Entry-level properties (Bottom 25%) earn around $113 per night.
Average Daily Rate (ADR) Trend by Month in Fortrose
Get Live Fortrose Market Intelligence 👇

Explore Real-time Analytics
Airbnb Seasonality Analysis & Trends in Fortrose (2025)
Peak Season (August, July, September)
- Revenue averages $4,428 per month
- Occupancy rates average 69.8%
- Daily rates average $244
Shoulder Season
- Revenue averages $2,849 per month
- Occupancy maintains around 52.6%
- Daily rates hold near $212
Low Season (January, March, November)
- Revenue drops to average $1,766 per month
- Occupancy decreases to average 34.4%
- Daily rates adjust to average $157
Seasonality Insights for Fortrose
- The Airbnb seasonality in Fortrose shows highly seasonal trends requiring careful strategy. While the sections above show seasonal averages, it's also insightful to look at the extremes:
- During the high season, the absolute peak month showcases Fortrose's highest earning potential, with monthly revenues capable of climbing to $4,982, occupancy reaching a high of 77.0%, and ADRs peaking at $246.
- Conversely, the slowest single month of the year, typically falling within the low season, marks the market's lowest point. In this month, revenue might dip to $1,670, occupancy could drop to 27.0%, and ADRs may adjust down to $151.
- Understanding both the seasonal averages and these monthly peaks and troughs in revenue, occupancy, and ADR is crucial for maximizing your Airbnb profit potential in Fortrose.
Seasonal Strategies for Maximizing Profit
- Peak Season: Maximize revenue through premium pricing and potentially longer minimum stays. Ensure high availability.
- Low Season: Offer competitive pricing, special promotions (e.g., extended stay discounts), and flexible cancellation policies. Target off-season travelers like remote workers or budget-conscious guests.
- Shoulder Seasons: Implement dynamic pricing that balances peak and low rates. Target weekend travelers or specific events. Offer slightly more flexible terms than peak season.
- Regularly analyze your own performance against these Fortrose seasonality benchmarks and adjust your pricing and availability strategy accordingly.
Best Areas for Airbnb Investment in Fortrose (2025)
Exploring the top neighborhoods for short-term rentals in Fortrose? This section highlights key areas, outlining why they are attractive for hosts and guests, along with notable local attractions. Consider these locations based on your target guest profile and investment strategy.
| Neighborhood / Area | Why Host Here? (Target Guests & Appeal) | Key Attractions & Landmarks |
|---|---|---|
| East Fortrose | A picturesque coastal area known for its stunning views of the Moray Firth. Ideal for guests looking for tranquility and natural beauty, with opportunities for dolphin watching and scenic walks. | Fortrose Cathedral, Chanonry Point, Rosemarkie Beach, Fortrose Harbour, Moray Firth Dolphins |
| Rosemarkie | Offering beautiful sandy beaches and a charming village atmosphere, Rosemarkie attracts families and beachgoers looking for a relaxing getaway close to nature. | Rosemarkie Beach, Groam House Museum, Chanonry Point, Fortrose Tidal Pool, Cliffs and coastal paths |
| Black Isle | The Black Isle region is renowned for its rural charm and proximity to both countryside and coastline. It's appealing for those looking to explore the scenic beauty and local wildlife. | Black Isle Brewery, Cromarty Firth, Local farms and markets, Historic sites and castles, Wildlife observing |
| Chanonry Point | Famous for its lighthouse and regular sightings of dolphins, Chanonry Point is a hotspot for visitors interested in marine life and stunning coastal scenery. | Chanonry Lighthouse, Dolphin watching tours, Fortrose Beach, East Coast walking trails, Scenic picnic spots |
| Fortrose Town Centre | The heart of Fortrose, with shops, restaurants, and cafes, making it convenient for guests who appreciate easy access to local amenities and community events. | Local shops, Restaurants and cafes, Fortrose Golf Club, Community events, Historic buildings |
| Avoch | A charming fishing village with a welcoming atmosphere, Avoch is appealing due to its local culture and proximity to outdoor activities and coastal experiences. | Avoch Harbour, Moray Firth views, Walking trails, Local fishing opportunities, Community events |
| Nigg | Offering a more rural experience, Nigg is great for guests looking for solitude and natural landscapes, while still being within reach of Fortrose’s attractions. | Nigg Heritage Centre, Nigg Bay, Walking trails, Wildlife watching, Peaceful countryside |
| Cromarty | Although a bit further away, Cromarty is a popular destination known for its historical significance and stunning coastal landscapes, attracting visitors with rich history and outdoor activities. | Cromarty Courthouse Museum, Cromarty Firth, Historic sites, Local art galleries, Beautiful coastal walks |
Understanding Airbnb License Requirements & STR Laws in Fortrose (2025)
With 15% of listings showing registration in 2025, understanding potential Airbnb license requirements is crucial in Fortrose. Always verify the latest short term rental regulations and Airbnb license requirements directly with local government authorities for Fortrose to ensure full compliance before hosting.
(Source: AirROI data, 2025, based on 15% licensed listings)
Top Performing Airbnb Properties in Fortrose (2025)
Benchmark your potential! Explore examples of top-performing Airbnb properties in Fortrosebased on Trailing Twelve Month (TTM) revenue. Analyze their characteristics, revenue, occupancy rate, and ADR to understand what drives success in this market.
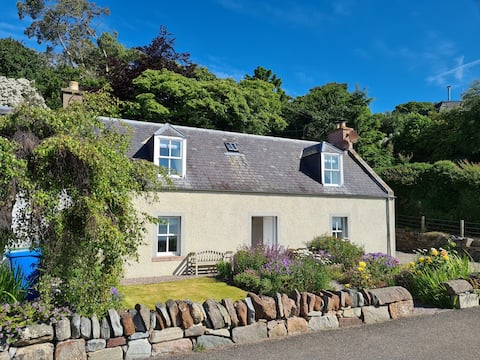
Braefoot
Entire Place • 2 bedrooms

Newly renovated character cottage close to beach
Entire Place • 3 bedrooms
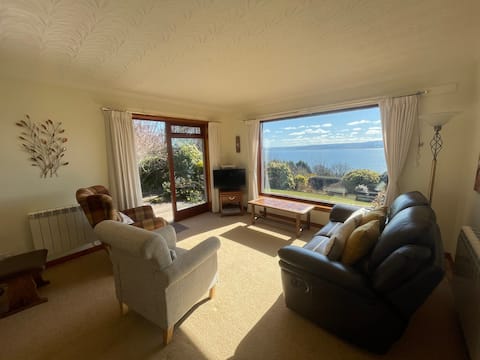
Chanonry View, Fortrose, Black Isle, Highlands
Entire Place • 2 bedrooms
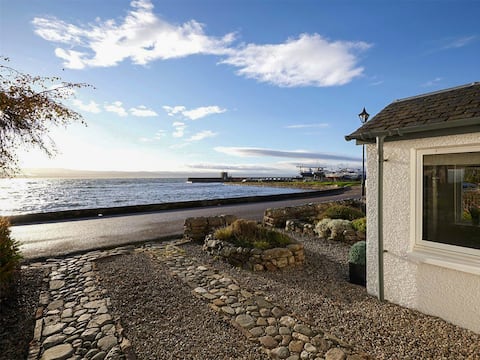
The Shore
Entire Place • 3 bedrooms
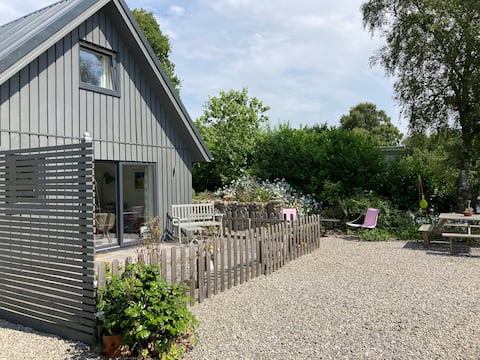
2 Bedroom Garden Studio On The Stunning Black Isle
Entire Place • 2 bedrooms

The Harbour
Entire Place • 4 bedrooms
Note: Performance varies based on location, size, amenities, seasonality, and management quality. Data reflects the past 12 months.
Top Performing Airbnb Hosts in Fortrose (2025)
Learn from the best! This table showcases top-performing Airbnb hosts in Fortrose based on the number of properties managed and estimated total revenue over the past year. Analyze their scale and performance metrics.
| Host Name | Properties | Grossing Revenue | Stay Reviews | Avg Rating |
|---|---|---|---|---|
| Cottages | 4 | $147,985 | 15 | 3.68/5.0 |
| Simon | 1 | $61,793 | 103 | 4.90/5.0 |
| Jenye | 2 | $56,387 | 342 | 5.00/5.0 |
| Jacqueline | 1 | $54,046 | 37 | 4.97/5.0 |
| Rachel | 1 | $37,252 | 55 | 4.78/5.0 |
| Elaine Lindsay | 1 | $30,271 | 143 | 4.99/5.0 |
| Andrew | 1 | $28,436 | 137 | 4.99/5.0 |
| Jim | 3 | $27,910 | 327 | 4.73/5.0 |
| Jane | 1 | $24,127 | 66 | 4.77/5.0 |
| Jane | 1 | $23,803 | 58 | 4.86/5.0 |
Analyzing the strategies of top hosts, such as their property selection, pricing, and guest communication, can offer valuable lessons for optimizing your own Airbnb operations in Fortrose.
Dive Deeper: Advanced Fortrose STR Market Data (2025)
Ready to unlock more insights? AirROI provides access to advanced metrics and comprehensive Airbnb data for Fortrose. Explore detailed analytics beyond this report to refine your investment strategy, optimize pricing, and maximize your vacation rental profits.
Explore Advanced MetricsFortrose Short-Term Rental Market Composition (2025): Property & Room Types
Room Type Distribution
Property Type Distribution
Market Composition Insights for Fortrose
- The Fortrose Airbnb market composition is heavily skewed towards Entire Home/Apt listings, which make up 85% of the 20 active rentals. This indicates strong guest preference for privacy and space.
- Looking at the property type distribution in Fortrose, House properties are the most common (55%), reflecting the local real estate landscape.
- Houses represent a significant 55% portion, catering likely to families or larger groups.
- The presence of 20% Hotel/Boutique listings indicates integration with traditional hospitality.
Fortrose Airbnb Room Capacity Analysis (2025): Bedroom Distribution
Distribution of Listings by Number of Bedrooms
Room Capacity Insights for Fortrose
- The dominant room capacity in Fortrose is 1 bedroom listings, making up 45% of the market. This suggests a strong demand for properties suitable for couples or solo travelers.
- Together, 1 bedroom and 2 bedrooms properties represent 80.0% of the active Airbnb listings in Fortrose, indicating a high concentration in these sizes.
Fortrose Vacation Rental Guest Capacity Trends (2025)
Distribution of Listings by Guest Capacity
Guest Capacity Insights for Fortrose
- The most common guest capacity trend in Fortrose vacation rentals is listings accommodating 2 guests (35%). This suggests the primary traveler segment is likely couples or solo travelers.
- Properties designed for 2 guests and 4 guests dominate the Fortrose STR market, accounting for 70.0% of listings.
- 25.0% of properties accommodate 6+ guests, serving the market segment for larger families or group travel in Fortrose.
- On average, properties in Fortrose are equipped to host 4.0 guests.
Fortrose Airbnb Booking Patterns (2025): Available vs. Booked Days
Available Days Distribution
Booked Days Distribution
Booking Pattern Insights for Fortrose
- The most common availability pattern in Fortrose falls within the 181-270 days range, representing 35% of listings. This suggests many properties have significant open periods on their calendars.
- Approximately 55.0% of listings show high availability (181+ days open annually), indicating potential for increased bookings or specific owner usage patterns.
- For booked days, the 181-270 days range is most frequent in Fortrose (35%), reflecting common guest stay durations or potential owner blocking patterns.
- A notable 55.0% of properties secure long booking periods (181+ days booked per year), highlighting successful long-term rental strategies or significant owner usage.
Fortrose Airbnb Minimum Stay Requirements Analysis
Distribution of Listings by Minimum Night Requirement
1 Night
4 listings
23.5% of total
2 Nights
8 listings
47.1% of total
3 Nights
1 listings
5.9% of total
4-6 Nights
1 listings
5.9% of total
30+ Nights
3 listings
17.6% of total
Key Insights
- The most prevalent minimum stay requirement in Fortrose is 2 Nights, adopted by 47.1% of listings. This highlights the market's preference for shorter, flexible bookings.
- A strong majority (70.6%) of the Fortrose Airbnb data shows acceptance of very short stays (1-2 nights), indicating a dynamic, high-turnover market.
- A significant segment (17.6%) caters to monthly stays (30+ nights) in Fortrose, pointing to opportunities in the extended-stay market.
Recommendations
- Align with the market by considering a 2 Nights minimum stay, as 47.1% of Fortrose hosts use this setting.
- If feasible, allowing 1-night stays, especially midweek or during low season, could capture last-minute bookings, as only 23.5% currently do.
- Explore offering discounts for stays of 30+ nights to attract the 17.6% of the market seeking extended stays.
- Adjust minimum nights based on seasonality – potentially shorter during low season and longer during peak demand periods in Fortrose.
Fortrose Airbnb Cancellation Policy Trends Analysis (2025)
Non-refundable
1 listings
5% of total
Super Strict 60 Days
4 listings
20% of total
Flexible
6 listings
30% of total
Moderate
8 listings
40% of total
Strict
1 listings
5% of total
Cancellation Policy Insights for Fortrose
- The prevailing Airbnb cancellation policy trend in Fortrose is Moderate, used by 40% of listings.
- There's a relatively balanced mix between guest-friendly (70.0%) and stricter (5.0%) policies, offering choices for different guest needs.
- Strict cancellation policies are quite rare (5%), potentially making listings with this policy less competitive unless justified by high demand or property type.
Recommendations for Hosts
- Consider adopting a Moderate policy to align with the 40% market standard in Fortrose.
- Using a Strict policy might deter some guests, as only 5% of listings use it. Evaluate if potential revenue protection outweighs possible lower booking rates.
- Regularly review your cancellation policy against competitors and market demand shifts in Fortrose.
Fortrose STR Booking Lead Time Analysis (2025)
Average Booking Lead Time by Month
Booking Lead Time Insights for Fortrose
- The overall average booking lead time for vacation rentals in Fortrose is 110 days.
- Guests book furthest in advance for stays during August (average 154 days), likely coinciding with peak travel demand or local events.
- The shortest booking windows occur for stays in March (average 35 days), indicating more last-minute travel plans during this time.
- Seasonally, Summer (150 days avg.) sees the longest lead times, while Winter (67 days avg.) has the shortest, reflecting typical travel planning cycles.
Recommendations for Hosts
- Use the overall average lead time (110 days) as a baseline for your pricing and availability strategy in Fortrose.
- For August stays, consider implementing length-of-stay discounts or slightly higher rates for bookings made less than 154 days out to capitalize on advance planning.
- Target marketing efforts for the Summer season well in advance (at least 150 days) to capture early planners.
- Monitor your own booking lead times against these Fortrose averages to identify opportunities for dynamic pricing adjustments.
Popular & Essential Airbnb Amenities in Fortrose (2025)
Amenity Prevalence
Amenity Insights for Fortrose
- Essential amenities in Fortrose that guests expect include: TV, Heating, Smoke alarm, Wifi, Washer. Lacking these (any) could significantly impact bookings.
- Popular amenities like Hangers, Fire extinguisher, Iron are common but not universal. Offering these can provide a competitive edge.
Recommendations for Hosts
- Ensure your listing includes all essential amenities for Fortrose: TV, Heating, Smoke alarm, Wifi, Washer.
- Prioritize adding missing essentials: Wifi, Washer.
- Consider adding popular differentiators like Hangers or Fire extinguisher to increase appeal.
- Highlight unique or less common amenities you offer (e.g., hot tub, dedicated workspace, EV charger) in your listing description and photos.
- Regularly check competitor amenities in Fortrose to stay competitive.
Fortrose Airbnb Guest Demographics & Profile Analysis (2025)
Guest Profile Summary for Fortrose
- The typical guest profile for Airbnb in Fortrose consists of a mix of domestic (59%) and international guests, often arriving from nearby England, typically belonging to the Post-2000s (Gen Z/Alpha) group (50%), primarily speaking English or French.
- Domestic travelers account for 58.9% of guests.
- Key international markets include United Kingdom (58.9%) and United States (16.5%).
- Top languages spoken are English (61.6%) followed by French (8.8%).
- A significant demographic segment is the Post-2000s (Gen Z/Alpha) group, representing 50% of guests.
Recommendations for Hosts
- Balance marketing efforts between domestic and international channels based on the guest mix.
- Tailor amenities and listing descriptions to appeal to the dominant Post-2000s (Gen Z/Alpha) demographic (e.g., highlight fast WiFi, smart home features, local guides).
- Highlight unique local experiences or amenities relevant to the primary guest profile.
- Consider seasonal promotions aligned with peak travel times for key origin markets.
Nearby Short-Term Rental Market Comparison
How does the Fortrose Airbnb market stack up against its neighbors? Compare key performance metrics like average monthly revenue, ADR, and occupancy rates in surrounding areas to understand the broader regional STR landscape.
| Market | Active Properties | Monthly Revenue | Daily Rate | Avg. Occupancy |
|---|---|---|---|---|
| Fearnan | 19 | $6,440 | $421.92 | 53% |
| Bridge of Cally | 16 | $5,839 | $566.24 | 50% |
| Kirkhill | 10 | $5,719 | $700.26 | 44% |
| Glenachulish | 33 | $5,609 | $424.51 | 46% |
| North Kessock | 10 | $5,421 | $380.62 | 58% |
| Foyers | 14 | $5,076 | $274.52 | 64% |
| Arrochar | 33 | $5,045 | $339.11 | 56% |
| Whitebridge | 10 | $4,907 | $417.35 | 42% |
| Acharn | 10 | $4,813 | $278.43 | 57% |
| Camuscross | 11 | $4,649 | $300.59 | 61% |