Findhorn Airbnb Market Analysis 2025: Short Term Rental Data & Vacation Rental Statistics in Scotland, United Kingdom
Is Airbnb profitable in Findhorn in 2025? Explore comprehensive Airbnb analytics for Findhorn, Scotland, United Kingdom to uncover income potential. This 2025 STR market report for Findhorn, based on AirROI data from April 2024 to March 2025, reveals key trends in the niche market of 44 active listings.
Whether you're considering an Airbnb investment in Findhorn, optimizing your existing vacation rental, or exploring rental arbitrage opportunities, understanding the Findhorn Airbnb data is crucial. Understanding the local regulations is key to maximizing your short term rental income potential. Let's dive into the specifics.
Key Findhorn Airbnb Performance Metrics Overview
Monthly Airbnb Revenue Variations & Income Potential in Findhorn (2025)
Understanding the monthly revenue variations for Airbnb listings in Findhorn is key to maximizing your short term rental income potential. Seasonality significantly impacts earnings. Our analysis, based on data from the past 12 months, shows that the peak revenue month for STRs in Findhorn is typically July, while March often presents the lowest earnings, highlighting opportunities for strategic pricing adjustments during shoulder and low seasons. Explore the typical Airbnb income in Findhorn across different performance tiers:
- Best-in-class properties (Top 10%) achieve $5,768+ monthly, often utilizing dynamic pricing and superior guest experiences.
- Strong performing properties (Top 25%) earn $4,505 or more, indicating effective management and desirable locations/amenities.
- Typical properties (Median) generate around $2,661 per month, representing the average market performance.
- Entry-level properties (Bottom 25%) see earnings around $1,456, often with potential for optimization.
Average Monthly Airbnb Earnings Trend in Findhorn
Findhorn Airbnb Occupancy Rate Trends (2025)
Maximize your bookings by understanding the Findhorn STR occupancy trends. Seasonal demand shifts significantly influence how often properties are booked. Typically, Julysees the highest demand (peak season occupancy), while March experiences the lowest (low season). Effective strategies, like adjusting minimum stays or offering promotions, can boost occupancy during slower periods. Here's how different property tiers perform in Findhorn:
- Best-in-class properties (Top 10%) achieve 82%+ occupancy, indicating high desirability and potentially optimized availability.
- Strong performing properties (Top 25%) maintain 68% or higher occupancy, suggesting good market fit and guest satisfaction.
- Typical properties (Median) have an occupancy rate around 48%.
- Entry-level properties (Bottom 25%) average 29% occupancy, potentially facing higher vacancy.
Average Monthly Occupancy Rate Trend in Findhorn
Average Daily Rate (ADR) Airbnb Trends in Findhorn (2025)
Effective short term rental pricing strategy in Findhorn involves understanding monthly ADR fluctuations. The Average Daily Rate (ADR) for Airbnb in Findhorn typically peaks in November and dips lowest during April. Leveraging Airbnb dynamic pricing tools or strategies based on this seasonality can significantly boost revenue. Here's a look at the typical nightly rates achieved:
- Best-in-class properties (Top 10%) command rates of $309+ per night, often due to premium features or locations.
- Strong performing properties (Top 25%) achieve nightly rates of $235 or more.
- Typical properties (Median) charge around $166 per night.
- Entry-level properties (Bottom 25%) earn around $118 per night.
Average Daily Rate (ADR) Trend by Month in Findhorn
Get Live Findhorn Market Intelligence 👇
Explore Real-time Analytics
Airbnb Seasonality Analysis & Trends in Findhorn (2025)
Peak Season (July, August, May)
- Revenue averages $4,095 per month
- Occupancy rates average 64.4%
- Daily rates average $182
Shoulder Season
- Revenue averages $3,171 per month
- Occupancy maintains around 48.1%
- Daily rates hold near $186
Low Season (February, March, November)
- Revenue drops to average $1,842 per month
- Occupancy decreases to average 31.0%
- Daily rates adjust to average $190
Seasonality Insights for Findhorn
- The Airbnb seasonality in Findhorn shows highly seasonal trends requiring careful strategy. While the sections above show seasonal averages, it's also insightful to look at the extremes:
- During the high season, the absolute peak month showcases Findhorn's highest earning potential, with monthly revenues capable of climbing to $4,293, occupancy reaching a high of 70.2%, and ADRs peaking at $197.
- Conversely, the slowest single month of the year, typically falling within the low season, marks the market's lowest point. In this month, revenue might dip to $1,570, occupancy could drop to 29.3%, and ADRs may adjust down to $178.
- Understanding both the seasonal averages and these monthly peaks and troughs in revenue, occupancy, and ADR is crucial for maximizing your Airbnb profit potential in Findhorn.
Seasonal Strategies for Maximizing Profit
- Peak Season: Maximize revenue through premium pricing and potentially longer minimum stays. Ensure high availability.
- Low Season: Offer competitive pricing, special promotions (e.g., extended stay discounts), and flexible cancellation policies. Target off-season travelers like remote workers or budget-conscious guests.
- Shoulder Seasons: Implement dynamic pricing that balances peak and low rates. Target weekend travelers or specific events. Offer slightly more flexible terms than peak season.
- Regularly analyze your own performance against these Findhorn seasonality benchmarks and adjust your pricing and availability strategy accordingly.
Best Areas for Airbnb Investment in Findhorn (2025)
Exploring the top neighborhoods for short-term rentals in Findhorn? This section highlights key areas, outlining why they are attractive for hosts and guests, along with notable local attractions. Consider these locations based on your target guest profile and investment strategy.
| Neighborhood / Area | Why Host Here? (Target Guests & Appeal) | Key Attractions & Landmarks |
|---|---|---|
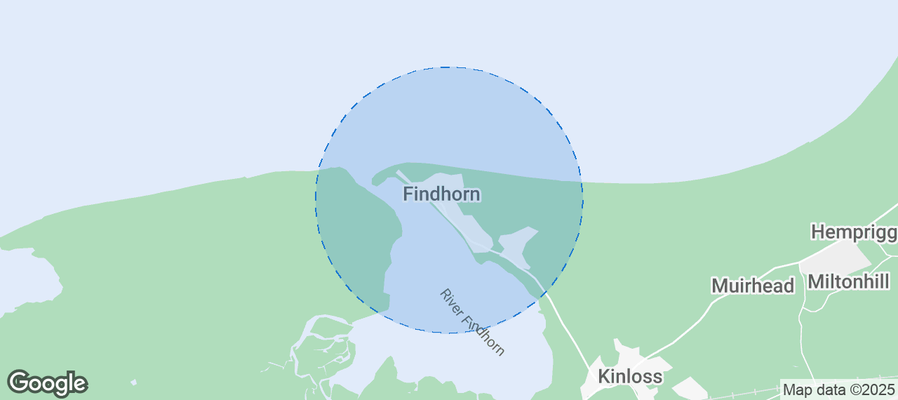
| Findhorn Village | Charming coastal village known for its beautiful beaches, unique eco-community, and artistic vibe. Ideal for travelers seeking a peaceful retreat with opportunities for nature walks and local crafts. | Findhorn Beach, Findhorn Foundation, The Eco Village, Local artisan shops, Findhorn Bay |
| Rainbow Waters | A scenic area popular for its serene atmosphere and water activities. Great for families and nature enthusiasts looking to explore the natural beauty of the Moray Firth. | Private beaches, Kayaking opportunities, Wildlife watching, Scenic walks, Fishing spots |
| Local Nature Reserve | Surrounded by remarkable natural landscapes, this area is appealing for tourists interested in hiking, birdwatching, and outdoor adventures. | Culbin Forest, Findhorn Bay Local Nature Reserve, Sand dunes, Wildflower trails |
| Historic Findhorn | Offers a glimpse into the rich history and culture of Findhorn, with charming old buildings and local stories that attract history buffs. | Findhorn Heritage Centre, Old Kirk, Historic architecture, Village festivals |
| Moray Firth Coast | This stunning coastal area is famous for its marine wildlife and offers adventure tourism. Ideal for those looking to explore the sea and surrounding nature. | Dolphin watching, Coastal walks, Fishing tours, Scenic views of the firth, Beaches |
| Forest of Findhorn | A tranquil and lush forest area perfect for hiking and outdoor exploration, attracting nature lovers, hikers, and those seeking solitude. | Forest trails, Nature photography, Outdoor picnics, Camping opportunities |
| Findhorn Golf Club | For golf enthusiasts, this area provides a relaxing environment with beautiful views, attracting players and their families looking for leisure activities. | Golf courses, Clubhouse amenities, Scenic landscapes, Golf tournaments |
| Findhorn Fishing Community | For anglers and fishing enthusiasts, this community showcases local fishing practices and attracts those interested in fresh seafood and fishing experiences. | Fishing trips, Local seafood markets, Fishing festivals, Fishing tips from locals |
Understanding Airbnb License Requirements & STR Laws in Findhorn (2025)
With 14% of listings showing registration in 2025, understanding potential Airbnb license requirements is crucial in Findhorn. Always verify the latest short term rental regulations and Airbnb license requirements directly with local government authorities for Findhorn to ensure full compliance before hosting.
(Source: AirROI data, 2025, based on 14% licensed listings)
Top Performing Airbnb Properties in Findhorn (2025)
Benchmark your potential! Explore examples of top-performing Airbnb properties in Findhornbased on Trailing Twelve Month (TTM) revenue. Analyze their characteristics, revenue, occupancy rate, and ADR to understand what drives success in this market.
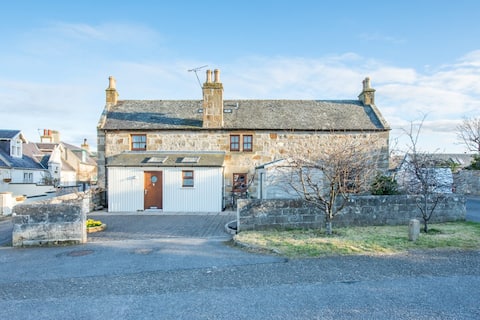
Dumella House, Findhorn
Entire Place • 5 bedrooms
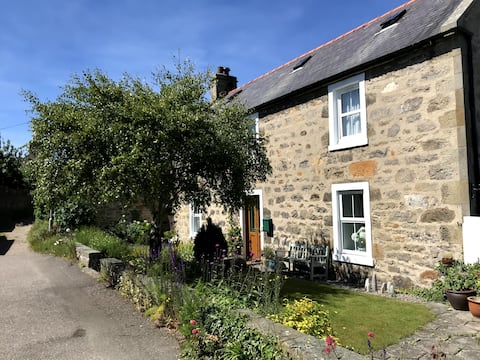
Boisdale Cottage, Findhorn
Entire Place • 4 bedrooms

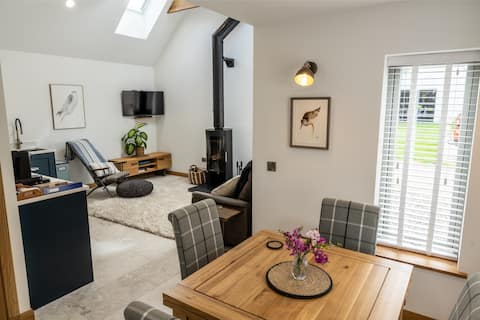
Nanas Cottage - Brand new luxury 1 bedroom Cottage
Entire Place • 1 bedroom

Cottage with views to Findhorn Bay
Entire Place • 3 bedrooms
Lily Cottage - Brand new 1 bedroom
Entire Place • 1 bedroom
A unique destination for cosy retreats in Findhorn
Entire Place • 3 bedrooms
Note: Performance varies based on location, size, amenities, seasonality, and management quality. Data reflects the past 12 months.
Top Performing Airbnb Hosts in Findhorn (2025)
Learn from the best! This table showcases top-performing Airbnb hosts in Findhorn based on the number of properties managed and estimated total revenue over the past year. Analyze their scale and performance metrics.
| Host Name | Properties | Grossing Revenue | Stay Reviews | Avg Rating |
|---|---|---|---|---|
| David | 2 | $126,883 | 107 | 4.99/5.0 |
| Alban | 1 | $81,871 | 88 | 4.92/5.0 |
| Lorraine | 2 | $79,522 | 179 | 4.96/5.0 |
| Andy | 1 | $68,003 | 62 | 4.97/5.0 |
| Jude | 1 | $63,770 | 16 | 4.94/5.0 |
| Heather | 2 | $53,925 | 54 | 2.33/5.0 |
| Andy | 1 | $50,785 | 28 | 4.93/5.0 |
| Lucy | 1 | $47,992 | 27 | 5.00/5.0 |
| Kenneth | 1 | $45,197 | 112 | 4.97/5.0 |
| Charlotte | 1 | $42,420 | 70 | 4.97/5.0 |
Analyzing the strategies of top hosts, such as their property selection, pricing, and guest communication, can offer valuable lessons for optimizing your own Airbnb operations in Findhorn.
Dive Deeper: Advanced Findhorn STR Market Data (2025)
Ready to unlock more insights? AirROI provides access to advanced metrics and comprehensive Airbnb data for Findhorn. Explore detailed analytics beyond this report to refine your investment strategy, optimize pricing, and maximize your vacation rental profits.
Explore Advanced MetricsFindhorn Short-Term Rental Market Composition (2025): Property & Room Types
Room Type Distribution
Property Type Distribution
Market Composition Insights for Findhorn
- The Findhorn Airbnb market composition is heavily skewed towards Entire Home/Apt listings, which make up 81.8% of the 44 active rentals. This indicates strong guest preference for privacy and space.
- Looking at the property type distribution in Findhorn, House properties are the most common (70.5%), reflecting the local real estate landscape.
- Houses represent a significant 70.5% portion, catering likely to families or larger groups.
- The presence of 6.8% Hotel/Boutique listings indicates integration with traditional hospitality.
- Smaller segments like outdoor/unique (combined 2.3%) offer potential for unique stay experiences.
Findhorn Airbnb Room Capacity Analysis (2025): Bedroom Distribution
Distribution of Listings by Number of Bedrooms
Room Capacity Insights for Findhorn
- The dominant room capacity in Findhorn is 2 bedrooms listings, making up 36.4% of the market. This suggests a strong demand for properties suitable for couples or solo travelers.
- Together, 2 bedrooms and 1 bedroom properties represent 56.9% of the active Airbnb listings in Findhorn, indicating a high concentration in these sizes.
- A significant 31.8% of listings offer 3+ bedrooms, catering to larger groups and families seeking more space in Findhorn.
Findhorn Vacation Rental Guest Capacity Trends (2025)
Distribution of Listings by Guest Capacity
Guest Capacity Insights for Findhorn
- The most common guest capacity trend in Findhorn vacation rentals is listings accommodating 4 guests (27.3%). This suggests the primary traveler segment is likely small families or groups.
- Properties designed for 4 guests and 6 guests dominate the Findhorn STR market, accounting for 45.5% of listings.
- 34.1% of properties accommodate 6+ guests, serving the market segment for larger families or group travel in Findhorn.
- On average, properties in Findhorn are equipped to host 4.1 guests.
Findhorn Airbnb Booking Patterns (2025): Available vs. Booked Days
Available Days Distribution
Booked Days Distribution
Booking Pattern Insights for Findhorn
- The most common availability pattern in Findhorn falls within the 271-366 days range, representing 36.4% of listings. This suggests many properties have significant open periods on their calendars.
- Approximately 65.9% of listings show high availability (181+ days open annually), indicating potential for increased bookings or specific owner usage patterns.
- For booked days, the 91-180 days range is most frequent in Findhorn (29.5%), reflecting common guest stay durations or potential owner blocking patterns.
- A notable 34.1% of properties secure long booking periods (181+ days booked per year), highlighting successful long-term rental strategies or significant owner usage.
Findhorn Airbnb Minimum Stay Requirements Analysis
Distribution of Listings by Minimum Night Requirement
1 Night
3 listings
7.1% of total
2 Nights
10 listings
23.8% of total
3 Nights
13 listings
31% of total
4-6 Nights
8 listings
19% of total
7-29 Nights
1 listings
2.4% of total
30+ Nights
7 listings
16.7% of total
Key Insights
- The most prevalent minimum stay requirement in Findhorn is 3 Nights, adopted by 31% of listings. This highlights the market's preference for longer commitments.
- A significant segment (16.7%) caters to monthly stays (30+ nights) in Findhorn, pointing to opportunities in the extended-stay market.
Recommendations
- Align with the market by considering a 3 Nights minimum stay, as 31% of Findhorn hosts use this setting.
- If feasible, allowing 1-night stays, especially midweek or during low season, could capture last-minute bookings, as only 7.1% currently do.
- Explore offering discounts for stays of 30+ nights to attract the 16.7% of the market seeking extended stays.
- Adjust minimum nights based on seasonality – potentially shorter during low season and longer during peak demand periods in Findhorn.
Findhorn Airbnb Cancellation Policy Trends Analysis (2025)
Super Strict 60 Days
1 listings
2.7% of total
Flexible
4 listings
10.8% of total
Moderate
4 listings
10.8% of total
Firm
11 listings
29.7% of total
Strict
17 listings
45.9% of total
Cancellation Policy Insights for Findhorn
- The prevailing Airbnb cancellation policy trend in Findhorn is Strict, used by 45.9% of listings.
- A majority (75.6%) of hosts in Findhorn utilize Firm or Strict policies, indicating a market where hosts prioritize booking security.
Recommendations for Hosts
- Consider adopting a Strict policy to align with the 45.9% market standard in Findhorn.
- With 45.9% using Strict terms, this is a viable option in Findhorn, particularly for high-value properties or during peak demand periods.
- Regularly review your cancellation policy against competitors and market demand shifts in Findhorn.
Findhorn STR Booking Lead Time Analysis (2025)
Average Booking Lead Time by Month
Booking Lead Time Insights for Findhorn
- The overall average booking lead time for vacation rentals in Findhorn is 71 days.
- Guests book furthest in advance for stays during July (average 122 days), likely coinciding with peak travel demand or local events.
- The shortest booking windows occur for stays in March (average 41 days), indicating more last-minute travel plans during this time.
- Seasonally, Summer (106 days avg.) sees the longest lead times, while Fall (69 days avg.) has the shortest, reflecting typical travel planning cycles.
Recommendations for Hosts
- Use the overall average lead time (71 days) as a baseline for your pricing and availability strategy in Findhorn.
- For July stays, consider implementing length-of-stay discounts or slightly higher rates for bookings made less than 122 days out to capitalize on advance planning.
- Target marketing efforts for the Summer season well in advance (at least 106 days) to capture early planners.
- Monitor your own booking lead times against these Findhorn averages to identify opportunities for dynamic pricing adjustments.
Popular & Essential Airbnb Amenities in Findhorn (2025)
Amenity Prevalence
Amenity Insights for Findhorn
- Essential amenities in Findhorn that guests expect include: Smoke alarm, Wifi, Hot water, Heating. Lacking these (any) could significantly impact bookings.
- Popular amenities like Essentials, Kitchen, Hangers are common but not universal. Offering these can provide a competitive edge.
Recommendations for Hosts
- Ensure your listing includes all essential amenities for Findhorn: Smoke alarm, Wifi, Hot water, Heating.
- Prioritize adding missing essentials: Hot water, Heating.
- Consider adding popular differentiators like Essentials or Kitchen to increase appeal.
- Highlight unique or less common amenities you offer (e.g., hot tub, dedicated workspace, EV charger) in your listing description and photos.
- Regularly check competitor amenities in Findhorn to stay competitive.
Findhorn Airbnb Guest Demographics & Profile Analysis (2025)
Guest Profile Summary for Findhorn
- The typical guest profile for Airbnb in Findhorn consists of primarily domestic travelers (78%), often arriving from nearby Scotland, typically belonging to the Post-2000s (Gen Z/Alpha) group (50%), primarily speaking English or French.
- Domestic travelers account for 77.6% of guests.
- Key international markets include United Kingdom (77.6%) and United States (9.4%).
- Top languages spoken are English (65%) followed by French (12.9%).
- A significant demographic segment is the Post-2000s (Gen Z/Alpha) group, representing 50% of guests.
Recommendations for Hosts
- Target domestic marketing efforts towards travelers from Scotland and Edinburgh.
- Tailor amenities and listing descriptions to appeal to the dominant Post-2000s (Gen Z/Alpha) demographic (e.g., highlight fast WiFi, smart home features, local guides).
- Highlight unique local experiences or amenities relevant to the primary guest profile.
- Consider seasonal promotions aligned with peak travel times for key origin markets.
Nearby Short-Term Rental Market Comparison
How does the Findhorn Airbnb market stack up against its neighbors? Compare key performance metrics like average monthly revenue, ADR, and occupancy rates in surrounding areas to understand the broader regional STR landscape.
| Market | Active Properties | Monthly Revenue | Daily Rate | Avg. Occupancy |
|---|---|---|---|---|
| Fearnan | 19 | $6,440 | $421.92 | 53% |
| Bridge of Cally | 16 | $5,839 | $566.24 | 50% |
| Kirkhill | 10 | $5,719 | $700.26 | 44% |
| North Kessock | 10 | $5,421 | $380.62 | 58% |
| Foyers | 14 | $5,076 | $274.52 | 64% |
| Arrochar | 33 | $5,045 | $339.11 | 56% |
| Whitebridge | 10 | $4,907 | $417.35 | 42% |
| Acharn | 10 | $4,813 | $278.43 | 57% |
| Croftamie | 19 | $4,609 | $267.39 | 52% |
| Carrick Castle | 11 | $4,591 | $586.01 | 42% |