Falkland Airbnb Market Analysis 2025: Short Term Rental Data & Vacation Rental Statistics in Scotland, United Kingdom
Is Airbnb profitable in Falkland in 2025? Explore comprehensive Airbnb analytics for Falkland, Scotland, United Kingdom to uncover income potential. This 2025 STR market report for Falkland, based on AirROI data from April 2024 to March 2025, reveals key trends in the niche market of 17 active listings.
Whether you're considering an Airbnb investment in Falkland, optimizing your existing vacation rental, or exploring rental arbitrage opportunities, understanding the Falkland Airbnb data is crucial. Understanding the local regulations is key to maximizing your short term rental income potential. Let's dive into the specifics.
Key Falkland Airbnb Performance Metrics Overview
Monthly Airbnb Revenue Variations & Income Potential in Falkland (2025)
Understanding the monthly revenue variations for Airbnb listings in Falkland is key to maximizing your short term rental income potential. Seasonality significantly impacts earnings. Our analysis, based on data from the past 12 months, shows that the peak revenue month for STRs in Falkland is typically August, while January often presents the lowest earnings, highlighting opportunities for strategic pricing adjustments during shoulder and low seasons. Explore the typical Airbnb income in Falkland across different performance tiers:
- Best-in-class properties (Top 10%) achieve $5,469+ monthly, often utilizing dynamic pricing and superior guest experiences.
- Strong performing properties (Top 25%) earn $4,293 or more, indicating effective management and desirable locations/amenities.
- Typical properties (Median) generate around $2,968 per month, representing the average market performance.
- Entry-level properties (Bottom 25%) see earnings around $1,853, often with potential for optimization.
Average Monthly Airbnb Earnings Trend in Falkland
Falkland Airbnb Occupancy Rate Trends (2025)
Maximize your bookings by understanding the Falkland STR occupancy trends. Seasonal demand shifts significantly influence how often properties are booked. Typically, Augustsees the highest demand (peak season occupancy), while January experiences the lowest (low season). Effective strategies, like adjusting minimum stays or offering promotions, can boost occupancy during slower periods. Here's how different property tiers perform in Falkland:
- Best-in-class properties (Top 10%) achieve 76%+ occupancy, indicating high desirability and potentially optimized availability.
- Strong performing properties (Top 25%) maintain 68% or higher occupancy, suggesting good market fit and guest satisfaction.
- Typical properties (Median) have an occupancy rate around 53%.
- Entry-level properties (Bottom 25%) average 28% occupancy, potentially facing higher vacancy.
Average Monthly Occupancy Rate Trend in Falkland
Average Daily Rate (ADR) Airbnb Trends in Falkland (2025)
Effective short term rental pricing strategy in Falkland involves understanding monthly ADR fluctuations. The Average Daily Rate (ADR) for Airbnb in Falkland typically peaks in July and dips lowest during November. Leveraging Airbnb dynamic pricing tools or strategies based on this seasonality can significantly boost revenue. Here's a look at the typical nightly rates achieved:
- Best-in-class properties (Top 10%) command rates of $306+ per night, often due to premium features or locations.
- Strong performing properties (Top 25%) achieve nightly rates of $253 or more.
- Typical properties (Median) charge around $200 per night.
- Entry-level properties (Bottom 25%) earn around $136 per night.
Average Daily Rate (ADR) Trend by Month in Falkland
Get Live Falkland Market Intelligence 👇

Explore Real-time Analytics
Airbnb Seasonality Analysis & Trends in Falkland (2025)
Peak Season (August, July, May)
- Revenue averages $4,348 per month
- Occupancy rates average 60.8%
- Daily rates average $222
Shoulder Season
- Revenue averages $3,321 per month
- Occupancy maintains around 50.5%
- Daily rates hold near $215
Low Season (January, February, March)
- Revenue drops to average $2,066 per month
- Occupancy decreases to average 34.6%
- Daily rates adjust to average $203
Seasonality Insights for Falkland
- The Airbnb seasonality in Falkland shows highly seasonal trends requiring careful strategy. While the sections above show seasonal averages, it's also insightful to look at the extremes:
- During the high season, the absolute peak month showcases Falkland's highest earning potential, with monthly revenues capable of climbing to $4,828, occupancy reaching a high of 70.0%, and ADRs peaking at $226.
- Conversely, the slowest single month of the year, typically falling within the low season, marks the market's lowest point. In this month, revenue might dip to $2,022, occupancy could drop to 31.6%, and ADRs may adjust down to $196.
- Understanding both the seasonal averages and these monthly peaks and troughs in revenue, occupancy, and ADR is crucial for maximizing your Airbnb profit potential in Falkland.
Seasonal Strategies for Maximizing Profit
- Peak Season: Maximize revenue through premium pricing and potentially longer minimum stays. Ensure high availability.
- Low Season: Offer competitive pricing, special promotions (e.g., extended stay discounts), and flexible cancellation policies. Target off-season travelers like remote workers or budget-conscious guests.
- Shoulder Seasons: Implement dynamic pricing that balances peak and low rates. Target weekend travelers or specific events. Offer slightly more flexible terms than peak season.
- Regularly analyze your own performance against these Falkland seasonality benchmarks and adjust your pricing and availability strategy accordingly.
Best Areas for Airbnb Investment in Falkland (2025)
Exploring the top neighborhoods for short-term rentals in Falkland? This section highlights key areas, outlining why they are attractive for hosts and guests, along with notable local attractions. Consider these locations based on your target guest profile and investment strategy.
| Neighborhood / Area | Why Host Here? (Target Guests & Appeal) | Key Attractions & Landmarks |
|---|---|---|
| Stanley | The capital and largest settlement of the Falkland Islands, offering a rich history and a variety of amenities. Attracts tourists interested in learning about the islands' past and experiencing local culture. | Falkland Islands Museum, Christ Church Cathedral, Port Stanley Harbour, The War Memorial, Battle Memorial |
| West Falkland | A less populated area with beautiful landscapes and opportunities for outdoor activities. Ideal for travelers seeking wildlife and adventure away from the hustle of urban settings. | Pebble Island, Viscount Island, Sealions, Historic Whalebone Cove, Wildlife Watching |
| East Falkland | Home to diverse landscapes and numerous farms, East Falkland appeals to those interested in agriculture, local lifestyle, and traditional island activities. | Mount Pleasant Airfield, The Farm Museum, Launceston, Punta Arenas, Beautiful coastal hikes |
| Bleaker Island | Known for its stunning vistas and rich wildlife, this area appeals to nature lovers and those seeking tranquility and seclusion. | Wildlife reserves, Bird watching, Beaches, Scenic walking trails, Historical shipwrecks |
| Saunders Island | A popular destination for its wildlife and hiking trails. Perfect for those looking to explore natural beauty and observe diverse species. | Yorke Bay, Green Hill, Wildlife photography, Hiking paths, Seabird colonies |
| Return Island | Ideal for guests looking for a true escape with an intimate and homely atmosphere among nature while providing unique experiences. | Stargazing, Nature trails, Fishing, Outdoor cabins, Isolated beaches |
| Carcass Island | Renowned for its scenic beauty and natural wildlife habitats, making it a prime spot for eco-tourists and those wanting a quiet retreat. | Carcass Island Nature Reserve, Beach access, Bird watching, Historical sites, Tranquil environment |
| Sea Lion Island | A wildlife lover’s paradise with seals and various birds; it's popular for ecotourism and offers a unique, immersive experience in nature. | Seal colonies, Birds watching, Beach walks, Guided tours, Scenic spots |
Understanding Airbnb License Requirements & STR Laws in Falkland (2025)
With 18% of listings showing registration in 2025, understanding potential Airbnb license requirements is crucial in Falkland. Always verify the latest short term rental regulations and Airbnb license requirements directly with local government authorities for Falkland to ensure full compliance before hosting.
(Source: AirROI data, 2025, based on 18% licensed listings)
Top Performing Airbnb Properties in Falkland (2025)
Benchmark your potential! Explore examples of top-performing Airbnb properties in Falklandbased on Trailing Twelve Month (TTM) revenue. Analyze their characteristics, revenue, occupancy rate, and ADR to understand what drives success in this market.
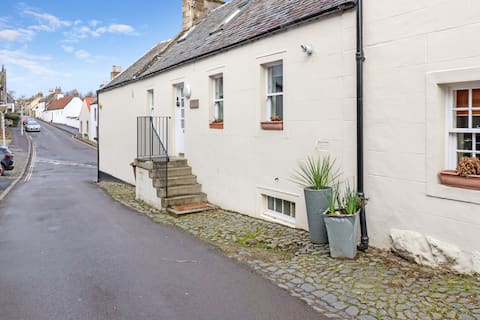
Whinstone Holiday Home in Falkland
Entire Place • 4 bedrooms
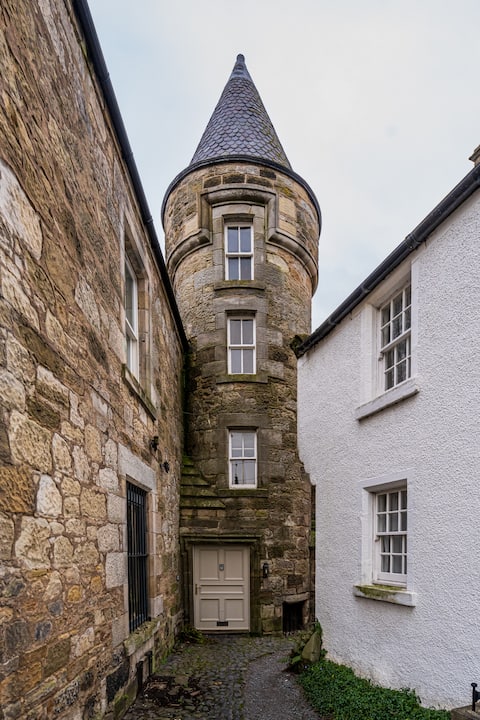
Warbeck House
Entire Place • 3 bedrooms
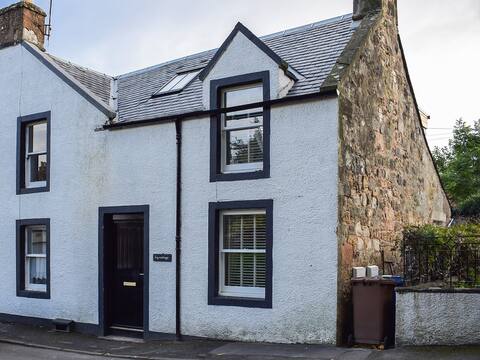
Ivy Cottage
Entire Place • 2 bedrooms

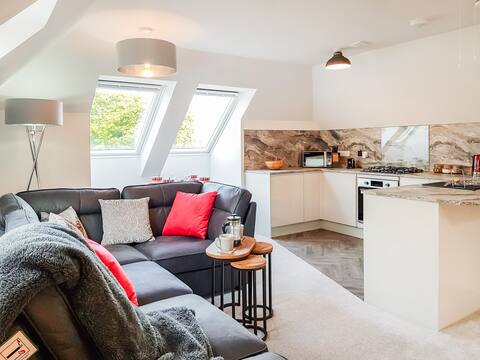
Corner Cottage, Falkland, Fife
Entire Place • 2 bedrooms

Theưer Hotel " Mrs Bairds B&B "
Private Room • 1 bedroom
Palace View - uk40569
Entire Place • 2 bedrooms
Note: Performance varies based on location, size, amenities, seasonality, and management quality. Data reflects the past 12 months.
Top Performing Airbnb Hosts in Falkland (2025)
Learn from the best! This table showcases top-performing Airbnb hosts in Falkland based on the number of properties managed and estimated total revenue over the past year. Analyze their scale and performance metrics.
| Host Name | Properties | Grossing Revenue | Stay Reviews | Avg Rating |
|---|---|---|---|---|
| Cottages | 4 | $131,111 | 34 | 3.64/5.0 |
| Maryanne | 1 | $85,118 | 13 | 4.77/5.0 |
| Shirley | 1 | $65,316 | 23 | 5.00/5.0 |
| Nicolle | 2 | $59,228 | 30 | 2.27/5.0 |
| Michaella | 1 | $50,525 | 254 | 4.99/5.0 |
| Johnny | 1 | $33,522 | 63 | 4.98/5.0 |
| Annie | 1 | $33,183 | 103 | 4.95/5.0 |
| Host #34297219 | 1 | $32,627 | 101 | 4.86/5.0 |
| Dave | 1 | $27,623 | 124 | 4.98/5.0 |
| Natasha | 1 | $26,659 | 113 | 4.73/5.0 |
Analyzing the strategies of top hosts, such as their property selection, pricing, and guest communication, can offer valuable lessons for optimizing your own Airbnb operations in Falkland.
Dive Deeper: Advanced Falkland STR Market Data (2025)
Ready to unlock more insights? AirROI provides access to advanced metrics and comprehensive Airbnb data for Falkland. Explore detailed analytics beyond this report to refine your investment strategy, optimize pricing, and maximize your vacation rental profits.
Explore Advanced MetricsFalkland Short-Term Rental Market Composition (2025): Property & Room Types
Room Type Distribution
Property Type Distribution
Market Composition Insights for Falkland
- The Falkland Airbnb market composition is heavily skewed towards Entire Home/Apt listings, which make up 94.1% of the 17 active rentals. This indicates strong guest preference for privacy and space.
- Looking at the property type distribution in Falkland, House properties are the most common (64.7%), reflecting the local real estate landscape.
- Houses represent a significant 64.7% portion, catering likely to families or larger groups.
- The presence of 23.5% Hotel/Boutique listings indicates integration with traditional hospitality.
Falkland Airbnb Room Capacity Analysis (2025): Bedroom Distribution
Distribution of Listings by Number of Bedrooms
Room Capacity Insights for Falkland
- The dominant room capacity in Falkland is 1 bedroom listings, making up 35.3% of the market. This suggests a strong demand for properties suitable for couples or solo travelers.
- Together, 1 bedroom and 2 bedrooms properties represent 70.6% of the active Airbnb listings in Falkland, indicating a high concentration in these sizes.
- A significant 29.4% of listings offer 3+ bedrooms, catering to larger groups and families seeking more space in Falkland.
Falkland Vacation Rental Guest Capacity Trends (2025)
Distribution of Listings by Guest Capacity
Guest Capacity Insights for Falkland
- The most common guest capacity trend in Falkland vacation rentals is listings accommodating 4 guests (35.3%). This suggests the primary traveler segment is likely small families or groups.
- Properties designed for 4 guests and 2 guests dominate the Falkland STR market, accounting for 64.7% of listings.
- 29.4% of properties accommodate 6+ guests, serving the market segment for larger families or group travel in Falkland.
- On average, properties in Falkland are equipped to host 4.4 guests.
Falkland Airbnb Booking Patterns (2025): Available vs. Booked Days
Available Days Distribution
Booked Days Distribution
Booking Pattern Insights for Falkland
- The most common availability pattern in Falkland falls within the 91-180 days range, representing 41.2% of listings. This suggests many properties have significant open periods on their calendars.
- Approximately 53.0% of listings show high availability (181+ days open annually), indicating potential for increased bookings or specific owner usage patterns.
- For booked days, the 181-270 days range is most frequent in Falkland (52.9%), reflecting common guest stay durations or potential owner blocking patterns.
- A notable 58.8% of properties secure long booking periods (181+ days booked per year), highlighting successful long-term rental strategies or significant owner usage.
Falkland Airbnb Minimum Stay Requirements Analysis
Distribution of Listings by Minimum Night Requirement
1 Night
3 listings
20% of total
2 Nights
7 listings
46.7% of total
3 Nights
2 listings
13.3% of total
30+ Nights
3 listings
20% of total
Key Insights
- The most prevalent minimum stay requirement in Falkland is 2 Nights, adopted by 46.7% of listings. This highlights the market's preference for shorter, flexible bookings.
- A strong majority (66.7%) of the Falkland Airbnb data shows acceptance of very short stays (1-2 nights), indicating a dynamic, high-turnover market.
- A significant segment (20%) caters to monthly stays (30+ nights) in Falkland, pointing to opportunities in the extended-stay market.
Recommendations
- Align with the market by considering a 2 Nights minimum stay, as 46.7% of Falkland hosts use this setting.
- If feasible, allowing 1-night stays, especially midweek or during low season, could capture last-minute bookings, as only 20% currently do.
- Explore offering discounts for stays of 30+ nights to attract the 20% of the market seeking extended stays.
- Adjust minimum nights based on seasonality – potentially shorter during low season and longer during peak demand periods in Falkland.
Falkland Airbnb Cancellation Policy Trends Analysis (2025)
Super Strict 60 Days
3 listings
20% of total
Flexible
3 listings
20% of total
Moderate
3 listings
20% of total
Firm
2 listings
13.3% of total
Strict
4 listings
26.7% of total
Cancellation Policy Insights for Falkland
- The prevailing Airbnb cancellation policy trend in Falkland is Strict, used by 26.7% of listings.
- There's a relatively balanced mix between guest-friendly (40.0%) and stricter (40.0%) policies, offering choices for different guest needs.
Recommendations for Hosts
- Consider adopting a Strict policy to align with the 26.7% market standard in Falkland.
- Regularly review your cancellation policy against competitors and market demand shifts in Falkland.
Falkland STR Booking Lead Time Analysis (2025)
Average Booking Lead Time by Month
Booking Lead Time Insights for Falkland
- The overall average booking lead time for vacation rentals in Falkland is 73 days.
- Guests book furthest in advance for stays during May (average 126 days), likely coinciding with peak travel demand or local events.
- The shortest booking windows occur for stays in February (average 34 days), indicating more last-minute travel plans during this time.
- Seasonally, Summer (90 days avg.) sees the longest lead times, while Winter (51 days avg.) has the shortest, reflecting typical travel planning cycles.
Recommendations for Hosts
- Use the overall average lead time (73 days) as a baseline for your pricing and availability strategy in Falkland.
- For May stays, consider implementing length-of-stay discounts or slightly higher rates for bookings made less than 126 days out to capitalize on advance planning.
- Target marketing efforts for the Summer season well in advance (at least 90 days) to capture early planners.
- Monitor your own booking lead times against these Falkland averages to identify opportunities for dynamic pricing adjustments.
Popular & Essential Airbnb Amenities in Falkland (2025)
Amenity Prevalence
Amenity Insights for Falkland
- Essential amenities in Falkland that guests expect include: Wifi, TV, Smoke alarm, Private entrance, Hangers. Lacking these (any) could significantly impact bookings.
- Popular amenities like Heating, Bed linens, Essentials are common but not universal. Offering these can provide a competitive edge.
Recommendations for Hosts
- Ensure your listing includes all essential amenities for Falkland: Wifi, TV, Smoke alarm, Private entrance, Hangers.
- Consider adding popular differentiators like Heating or Bed linens to increase appeal.
- Highlight unique or less common amenities you offer (e.g., hot tub, dedicated workspace, EV charger) in your listing description and photos.
- Regularly check competitor amenities in Falkland to stay competitive.
Falkland Airbnb Guest Demographics & Profile Analysis (2025)
Guest Profile Summary for Falkland
- The typical guest profile for Airbnb in Falkland consists of a mix of domestic (61%) and international guests, often arriving from nearby Scotland, typically belonging to the Post-2000s (Gen Z/Alpha) group (50%), primarily speaking English or French.
- Domestic travelers account for 61.1% of guests.
- Key international markets include United Kingdom (61.1%) and United States (21%).
- Top languages spoken are English (67.9%) followed by French (14.8%).
- A significant demographic segment is the Post-2000s (Gen Z/Alpha) group, representing 50% of guests.
Recommendations for Hosts
- Target domestic marketing efforts towards travelers from Scotland and England.
- Tailor amenities and listing descriptions to appeal to the dominant Post-2000s (Gen Z/Alpha) demographic (e.g., highlight fast WiFi, smart home features, local guides).
- Highlight unique local experiences or amenities relevant to the primary guest profile.
- Consider seasonal promotions aligned with peak travel times for key origin markets.
Nearby Short-Term Rental Market Comparison
How does the Falkland Airbnb market stack up against its neighbors? Compare key performance metrics like average monthly revenue, ADR, and occupancy rates in surrounding areas to understand the broader regional STR landscape.
| Market | Active Properties | Monthly Revenue | Daily Rate | Avg. Occupancy |
|---|---|---|---|---|
| Galston | 11 | $7,951 | $676.77 | 46% |
| Fearnan | 19 | $6,440 | $421.92 | 53% |
| Gorebridge | 12 | $6,209 | $493.62 | 54% |
| Bridge of Cally | 16 | $5,839 | $566.24 | 50% |
| Kirkhill | 10 | $5,719 | $700.26 | 44% |
| North Kessock | 10 | $5,421 | $380.62 | 58% |
| Foyers | 14 | $5,076 | $274.52 | 64% |
| Arrochar | 33 | $5,045 | $339.11 | 56% |
| Whitebridge | 10 | $4,907 | $417.35 | 42% |
| Acharn | 10 | $4,813 | $278.43 | 57% |