Evanton Airbnb Market Analysis 2025: Short Term Rental Data & Vacation Rental Statistics in Scotland, United Kingdom
Is Airbnb profitable in Evanton in 2025? Explore comprehensive Airbnb analytics for Evanton, Scotland, United Kingdom to uncover income potential. This 2025 STR market report for Evanton, based on AirROI data from April 2024 to March 2025, reveals key trends in the niche market of 18 active listings.
Whether you're considering an Airbnb investment in Evanton, optimizing your existing vacation rental, or exploring rental arbitrage opportunities, understanding the Evanton Airbnb data is crucial. Understanding the local regulations is key to maximizing your short term rental income potential. Let's dive into the specifics.
Key Evanton Airbnb Performance Metrics Overview
Monthly Airbnb Revenue Variations & Income Potential in Evanton (2025)
Understanding the monthly revenue variations for Airbnb listings in Evanton is key to maximizing your short term rental income potential. Seasonality significantly impacts earnings. Our analysis, based on data from the past 12 months, shows that the peak revenue month for STRs in Evanton is typically September, while February often presents the lowest earnings, highlighting opportunities for strategic pricing adjustments during shoulder and low seasons. Explore the typical Airbnb income in Evanton across different performance tiers:
- Best-in-class properties (Top 10%) achieve $8,601+ monthly, often utilizing dynamic pricing and superior guest experiences.
- Strong performing properties (Top 25%) earn $4,729 or more, indicating effective management and desirable locations/amenities.
- Typical properties (Median) generate around $2,723 per month, representing the average market performance.
- Entry-level properties (Bottom 25%) see earnings around $1,575, often with potential for optimization.
Average Monthly Airbnb Earnings Trend in Evanton
Evanton Airbnb Occupancy Rate Trends (2025)
Maximize your bookings by understanding the Evanton STR occupancy trends. Seasonal demand shifts significantly influence how often properties are booked. Typically, Augustsees the highest demand (peak season occupancy), while January experiences the lowest (low season). Effective strategies, like adjusting minimum stays or offering promotions, can boost occupancy during slower periods. Here's how different property tiers perform in Evanton:
- Best-in-class properties (Top 10%) achieve 75%+ occupancy, indicating high desirability and potentially optimized availability.
- Strong performing properties (Top 25%) maintain 64% or higher occupancy, suggesting good market fit and guest satisfaction.
- Typical properties (Median) have an occupancy rate around 47%.
- Entry-level properties (Bottom 25%) average 22% occupancy, potentially facing higher vacancy.
Average Monthly Occupancy Rate Trend in Evanton
Average Daily Rate (ADR) Airbnb Trends in Evanton (2025)
Effective short term rental pricing strategy in Evanton involves understanding monthly ADR fluctuations. The Average Daily Rate (ADR) for Airbnb in Evanton typically peaks in August and dips lowest during March. Leveraging Airbnb dynamic pricing tools or strategies based on this seasonality can significantly boost revenue. Here's a look at the typical nightly rates achieved:
- Best-in-class properties (Top 10%) command rates of $606+ per night, often due to premium features or locations.
- Strong performing properties (Top 25%) achieve nightly rates of $239 or more.
- Typical properties (Median) charge around $158 per night.
- Entry-level properties (Bottom 25%) earn around $114 per night.
Average Daily Rate (ADR) Trend by Month in Evanton
Get Live Evanton Market Intelligence 👇

Explore Real-time Analytics
Airbnb Seasonality Analysis & Trends in Evanton (2025)
Peak Season (September, July, May)
- Revenue averages $6,443 per month
- Occupancy rates average 60.3%
- Daily rates average $357
Shoulder Season
- Revenue averages $4,168 per month
- Occupancy maintains around 47.4%
- Daily rates hold near $317
Low Season (January, February, March)
- Revenue drops to average $2,093 per month
- Occupancy decreases to average 25.3%
- Daily rates adjust to average $222
Seasonality Insights for Evanton
- The Airbnb seasonality in Evanton shows highly seasonal trends requiring careful strategy. While the sections above show seasonal averages, it's also insightful to look at the extremes:
- During the high season, the absolute peak month showcases Evanton's highest earning potential, with monthly revenues capable of climbing to $6,790, occupancy reaching a high of 67.0%, and ADRs peaking at $368.
- Conversely, the slowest single month of the year, typically falling within the low season, marks the market's lowest point. In this month, revenue might dip to $1,713, occupancy could drop to 20.3%, and ADRs may adjust down to $218.
- Understanding both the seasonal averages and these monthly peaks and troughs in revenue, occupancy, and ADR is crucial for maximizing your Airbnb profit potential in Evanton.
Seasonal Strategies for Maximizing Profit
- Peak Season: Maximize revenue through premium pricing and potentially longer minimum stays. Ensure high availability.
- Low Season: Offer competitive pricing, special promotions (e.g., extended stay discounts), and flexible cancellation policies. Target off-season travelers like remote workers or budget-conscious guests.
- Shoulder Seasons: Implement dynamic pricing that balances peak and low rates. Target weekend travelers or specific events. Offer slightly more flexible terms than peak season.
- Regularly analyze your own performance against these Evanton seasonality benchmarks and adjust your pricing and availability strategy accordingly.
Best Areas for Airbnb Investment in Evanton (2025)
Exploring the top neighborhoods for short-term rentals in Evanton? This section highlights key areas, outlining why they are attractive for hosts and guests, along with notable local attractions. Consider these locations based on your target guest profile and investment strategy.
| Neighborhood / Area | Why Host Here? (Target Guests & Appeal) | Key Attractions & Landmarks |
|---|---|---|
| Inverness | The cultural capital of the Scottish Highlands, Inverness offers stunning scenery and rich history, making it a favorite for tourists. | Loch Ness, Inverness Castle, Culloden Battlefield, River Ness, Inverness Museum and Art Gallery |
| Loch Ness | Famous for its legendary monster, Loch Ness attracts visitors seeking beautiful landscapes and outdoor activities like hiking and boating. | Loch Ness, Urquhart Castle, Nessie excursions, The Great Glen Way, Fort Augustus |
| Fort William | Known as the outdoor capital of the UK, Fort William offers access to the Ben Nevis mountain and a variety of outdoor sports. | Ben Nevis, West Highland Museum, Glen Nevis, Nevis Range Mountain Resort, Steall Waterfall |
| Skye | Isle of Skye is renowned for its dramatic landscapes and picturesque villages, perfect for nature lovers and photographers. | The Old Man of Storr, Fairy Pools, Portree, Quiraing, Dunvegan Castle |
| Oban | A charming seaside town known as the 'Gateway to the Isles', Oban is popular for its seafood and ferry links to the Hebrides. | Oban Distillery, McCaig's Tower, Dunstaffnage Castle, Oban Ferry Terminal, The Esplanade |
| St Andrews | Famous for its university and golf courses, St Andrews draws tourists interested in history, education, and coastal beauty. | St Andrews Links, St Andrews Cathedral, The Old Course, University of St Andrews, West Sands |
| Dornoch | A picturesque coastal town renowned for its historic church and golf course, attracting visitors looking for a quaint seaside escape. | Dornoch Cathedral, Royal Dornoch Golf Club, Dornoch Beach, Historylinks Museum, Skibo Castle |
| Pitlochry | This charming town is known for its outdoor activities, festivals, and scenic surroundings in the heart of Scotland. | Pitlochry Festival Theatre, Blair Athol Distillery, Faskally Wood, The Enchanted Forest, Edradour Distillery |
Understanding Airbnb License Requirements & STR Laws in Evanton (2025)
With 22% of listings showing registration in 2025, understanding potential Airbnb license requirements is crucial in Evanton. Always verify the latest short term rental regulations and Airbnb license requirements directly with local government authorities for Evanton to ensure full compliance before hosting.
(Source: AirROI data, 2025, based on 22% licensed listings)
Top Performing Airbnb Properties in Evanton (2025)
Benchmark your potential! Explore examples of top-performing Airbnb properties in Evantonbased on Trailing Twelve Month (TTM) revenue. Analyze their characteristics, revenue, occupancy rate, and ADR to understand what drives success in this market.
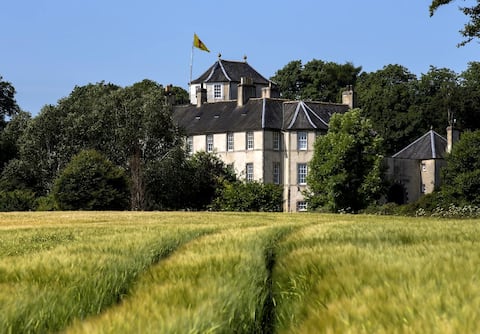
The Bakehouse, Foulis Castle, Highland Scotland
Entire Place • 4 bedrooms

The Pavilion, Foulis Castle, Highland Scotland
Entire Place • 2 bedrooms
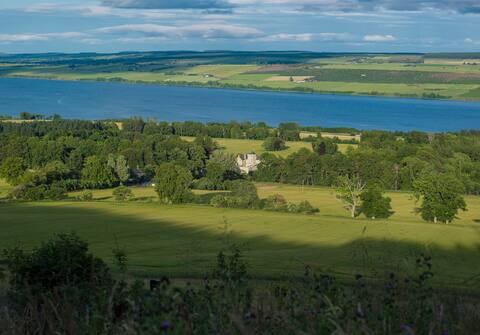
Luxury Highlands Cottage on the Cromarty Firth
Entire Place • 1 bedroom

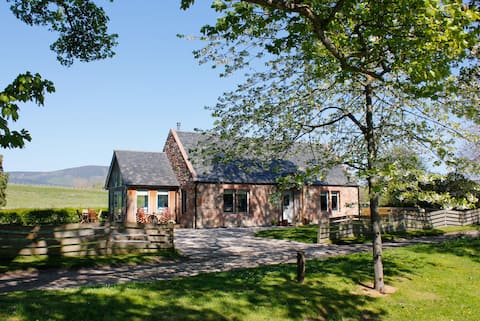
19th Century Miller's Cottage with stunning views
Entire Place • 4 bedrooms
Foulis Cottage, Foulis Estate, Highland Scotland
Entire Place • 2 bedrooms
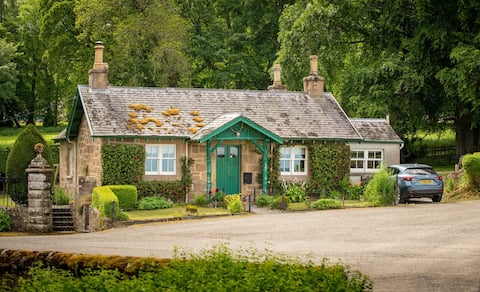
Foulis Castle Gate Lodge
Entire Place • 2 bedrooms
Note: Performance varies based on location, size, amenities, seasonality, and management quality. Data reflects the past 12 months.
Top Performing Airbnb Hosts in Evanton (2025)
Learn from the best! This table showcases top-performing Airbnb hosts in Evanton based on the number of properties managed and estimated total revenue over the past year. Analyze their scale and performance metrics.
| Host Name | Properties | Grossing Revenue | Stay Reviews | Avg Rating |
|---|---|---|---|---|
| Ohma | 5 | $322,012 | 2855 | 4.88/5.0 |
| Gabrielle | 1 | $70,455 | 81 | 5.00/5.0 |
| Reece | 2 | $47,330 | 45 | 4.88/5.0 |
| Piers | 1 | $47,245 | 50 | 5.00/5.0 |
| Natalie | 1 | $33,139 | 75 | 4.97/5.0 |
| Gabrielle | 1 | $29,619 | 144 | 4.82/5.0 |
| Host #442905678 | 1 | $29,172 | 0 | 0.00/5.0 |
| Donna | 1 | $28,968 | 61 | 4.93/5.0 |
| Cynthia | 1 | $19,432 | 169 | 4.77/5.0 |
| Emily | 2 | $12,221 | 5 | 2.50/5.0 |
Analyzing the strategies of top hosts, such as their property selection, pricing, and guest communication, can offer valuable lessons for optimizing your own Airbnb operations in Evanton.
Dive Deeper: Advanced Evanton STR Market Data (2025)
Ready to unlock more insights? AirROI provides access to advanced metrics and comprehensive Airbnb data for Evanton. Explore detailed analytics beyond this report to refine your investment strategy, optimize pricing, and maximize your vacation rental profits.
Explore Advanced MetricsEvanton Short-Term Rental Market Composition (2025): Property & Room Types
Room Type Distribution
Property Type Distribution
Market Composition Insights for Evanton
- The Evanton Airbnb market composition is heavily skewed towards Entire Home/Apt listings, which make up 88.9% of the 18 active rentals. This indicates strong guest preference for privacy and space.
- Looking at the property type distribution in Evanton, House properties are the most common (61.1%), reflecting the local real estate landscape.
- Houses represent a significant 61.1% portion, catering likely to families or larger groups.
- The presence of 11.1% Hotel/Boutique listings indicates integration with traditional hospitality.
Evanton Airbnb Room Capacity Analysis (2025): Bedroom Distribution
Distribution of Listings by Number of Bedrooms
Room Capacity Insights for Evanton
- The dominant room capacity in Evanton is 2 bedrooms listings, making up 38.9% of the market. This suggests a strong demand for properties suitable for couples or solo travelers.
- Together, 2 bedrooms and 1 bedroom properties represent 61.1% of the active Airbnb listings in Evanton, indicating a high concentration in these sizes.
- A significant 33.3% of listings offer 3+ bedrooms, catering to larger groups and families seeking more space in Evanton.
Evanton Vacation Rental Guest Capacity Trends (2025)
Distribution of Listings by Guest Capacity
Guest Capacity Insights for Evanton
- The most common guest capacity trend in Evanton vacation rentals is listings accommodating 6 guests (27.8%). This suggests the primary traveler segment is likely larger groups.
- Properties designed for 6 guests and 4 guests dominate the Evanton STR market, accounting for 44.5% of listings.
- 38.9% of properties accommodate 6+ guests, serving the market segment for larger families or group travel in Evanton.
- On average, properties in Evanton are equipped to host 4.6 guests.
Evanton Airbnb Booking Patterns (2025): Available vs. Booked Days
Available Days Distribution
Booked Days Distribution
Booking Pattern Insights for Evanton
- The most common availability pattern in Evanton falls within the 91-180 days range, representing 44.4% of listings. This suggests many properties have significant open periods on their calendars.
- Approximately 44.5% of listings show high availability (181+ days open annually), indicating potential for increased bookings or specific owner usage patterns.
- For booked days, the 181-270 days range is most frequent in Evanton (44.4%), reflecting common guest stay durations or potential owner blocking patterns.
- A notable 55.5% of properties secure long booking periods (181+ days booked per year), highlighting successful long-term rental strategies or significant owner usage.
Evanton Airbnb Minimum Stay Requirements Analysis
Distribution of Listings by Minimum Night Requirement
1 Night
6 listings
35.3% of total
2 Nights
4 listings
23.5% of total
3 Nights
3 listings
17.6% of total
4-6 Nights
2 listings
11.8% of total
7-29 Nights
1 listings
5.9% of total
30+ Nights
1 listings
5.9% of total
Key Insights
- The most prevalent minimum stay requirement in Evanton is 1 Night, adopted by 35.3% of listings. This highlights the market's preference for shorter, flexible bookings.
Recommendations
- Align with the market by considering a 1 Night minimum stay, as 35.3% of Evanton hosts use this setting.
- Explore offering discounts for stays of 30+ nights to attract the 5.9% of the market seeking extended stays.
- Adjust minimum nights based on seasonality – potentially shorter during low season and longer during peak demand periods in Evanton.
Evanton Airbnb Cancellation Policy Trends Analysis (2025)
Flexible
8 listings
47.1% of total
Moderate
3 listings
17.6% of total
Firm
4 listings
23.5% of total
Strict
2 listings
11.8% of total
Cancellation Policy Insights for Evanton
- The prevailing Airbnb cancellation policy trend in Evanton is Flexible, used by 47.1% of listings.
- There's a relatively balanced mix between guest-friendly (64.7%) and stricter (35.3%) policies, offering choices for different guest needs.
Recommendations for Hosts
- Consider adopting a Flexible policy to align with the 47.1% market standard in Evanton.
- Using a Strict policy might deter some guests, as only 11.8% of listings use it. Evaluate if potential revenue protection outweighs possible lower booking rates.
- Regularly review your cancellation policy against competitors and market demand shifts in Evanton.
Evanton STR Booking Lead Time Analysis (2025)
Average Booking Lead Time by Month
Booking Lead Time Insights for Evanton
- The overall average booking lead time for vacation rentals in Evanton is 78 days.
- Guests book furthest in advance for stays during June (average 132 days), likely coinciding with peak travel demand or local events.
- The shortest booking windows occur for stays in February (average 31 days), indicating more last-minute travel plans during this time.
- Seasonally, Summer (116 days avg.) sees the longest lead times, while Winter (56 days avg.) has the shortest, reflecting typical travel planning cycles.
Recommendations for Hosts
- Use the overall average lead time (78 days) as a baseline for your pricing and availability strategy in Evanton.
- For June stays, consider implementing length-of-stay discounts or slightly higher rates for bookings made less than 132 days out to capitalize on advance planning.
- Target marketing efforts for the Summer season well in advance (at least 116 days) to capture early planners.
- Monitor your own booking lead times against these Evanton averages to identify opportunities for dynamic pricing adjustments.
Popular & Essential Airbnb Amenities in Evanton (2025)
Amenity Prevalence
Amenity Insights for Evanton
- Essential amenities in Evanton that guests expect include: Iron, Hot water, Wifi, Smoke alarm, Heating, Hair dryer. Lacking these (any) could significantly impact bookings.
- Popular amenities like TV, Bed linens, Essentials are common but not universal. Offering these can provide a competitive edge.
Recommendations for Hosts
- Ensure your listing includes all essential amenities for Evanton: Iron, Hot water, Wifi, Smoke alarm, Heating, Hair dryer.
- Consider adding popular differentiators like TV or Bed linens to increase appeal.
- Highlight unique or less common amenities you offer (e.g., hot tub, dedicated workspace, EV charger) in your listing description and photos.
- Regularly check competitor amenities in Evanton to stay competitive.
Evanton Airbnb Guest Demographics & Profile Analysis (2025)
Guest Profile Summary for Evanton
- The typical guest profile for Airbnb in Evanton consists of predominantly international visitors (80%), with top international origins including United Kingdom, typically belonging to the Post-2000s (Gen Z/Alpha) group (50%), primarily speaking English or French.
- Domestic travelers account for 20.3% of guests.
- Key international markets include United States (48.3%) and United Kingdom (20.3%).
- Top languages spoken are English (68.4%) followed by French (5.2%).
- A significant demographic segment is the Post-2000s (Gen Z/Alpha) group, representing 50% of guests.
Recommendations for Hosts
- Focus marketing internationally, particularly towards travelers from United Kingdom.
- Tailor amenities and listing descriptions to appeal to the dominant Post-2000s (Gen Z/Alpha) demographic (e.g., highlight fast WiFi, smart home features, local guides).
- Highlight unique local experiences or amenities relevant to the primary guest profile.
- Consider seasonal promotions aligned with peak travel times for key origin markets.
Nearby Short-Term Rental Market Comparison
How does the Evanton Airbnb market stack up against its neighbors? Compare key performance metrics like average monthly revenue, ADR, and occupancy rates in surrounding areas to understand the broader regional STR landscape.
| Market | Active Properties | Monthly Revenue | Daily Rate | Avg. Occupancy |
|---|---|---|---|---|
| Fearnan | 19 | $6,440 | $421.92 | 53% |
| Bridge of Cally | 16 | $5,839 | $566.24 | 50% |
| Kirkhill | 10 | $5,719 | $700.26 | 44% |
| Glenachulish | 33 | $5,609 | $424.51 | 46% |
| North Kessock | 10 | $5,421 | $380.62 | 58% |
| Foyers | 14 | $5,076 | $274.52 | 64% |
| Arrochar | 33 | $5,045 | $339.11 | 56% |
| Whitebridge | 10 | $4,907 | $417.35 | 42% |
| Acharn | 10 | $4,813 | $278.43 | 57% |
| Camuscross | 11 | $4,649 | $300.59 | 61% |