Durness Airbnb Market Analysis 2025: Short Term Rental Data & Vacation Rental Statistics in Scotland, United Kingdom
Is Airbnb profitable in Durness in 2025? Explore comprehensive Airbnb analytics for Durness, Scotland, United Kingdom to uncover income potential. This 2025 STR market report for Durness, based on AirROI data from April 2024 to March 2025, reveals key trends in the niche market of 25 active listings.
Whether you're considering an Airbnb investment in Durness, optimizing your existing vacation rental, or exploring rental arbitrage opportunities, understanding the Durness Airbnb data is crucial. Navigating the high regulation landscape is key to maximizing your short term rental income potential. Let's dive into the specifics.
Key Durness Airbnb Performance Metrics Overview
Monthly Airbnb Revenue Variations & Income Potential in Durness (2025)
Understanding the monthly revenue variations for Airbnb listings in Durness is key to maximizing your short term rental income potential. Seasonality significantly impacts earnings. Our analysis, based on data from the past 12 months, shows that the peak revenue month for STRs in Durness is typically August, while February often presents the lowest earnings, highlighting opportunities for strategic pricing adjustments during shoulder and low seasons. Explore the typical Airbnb income in Durness across different performance tiers:
- Best-in-class properties (Top 10%) achieve $5,044+ monthly, often utilizing dynamic pricing and superior guest experiences.
- Strong performing properties (Top 25%) earn $4,118 or more, indicating effective management and desirable locations/amenities.
- Typical properties (Median) generate around $2,784 per month, representing the average market performance.
- Entry-level properties (Bottom 25%) see earnings around $1,808, often with potential for optimization.
Average Monthly Airbnb Earnings Trend in Durness
Durness Airbnb Occupancy Rate Trends (2025)
Maximize your bookings by understanding the Durness STR occupancy trends. Seasonal demand shifts significantly influence how often properties are booked. Typically, Aprilsees the highest demand (peak season occupancy), while January experiences the lowest (low season). Effective strategies, like adjusting minimum stays or offering promotions, can boost occupancy during slower periods. Here's how different property tiers perform in Durness:
- Best-in-class properties (Top 10%) achieve 83%+ occupancy, indicating high desirability and potentially optimized availability.
- Strong performing properties (Top 25%) maintain 66% or higher occupancy, suggesting good market fit and guest satisfaction.
- Typical properties (Median) have an occupancy rate around 49%.
- Entry-level properties (Bottom 25%) average 27% occupancy, potentially facing higher vacancy.
Average Monthly Occupancy Rate Trend in Durness
Average Daily Rate (ADR) Airbnb Trends in Durness (2025)
Effective short term rental pricing strategy in Durness involves understanding monthly ADR fluctuations. The Average Daily Rate (ADR) for Airbnb in Durness typically peaks in July and dips lowest during February. Leveraging Airbnb dynamic pricing tools or strategies based on this seasonality can significantly boost revenue. Here's a look at the typical nightly rates achieved:
- Best-in-class properties (Top 10%) command rates of $434+ per night, often due to premium features or locations.
- Strong performing properties (Top 25%) achieve nightly rates of $250 or more.
- Typical properties (Median) charge around $204 per night.
- Entry-level properties (Bottom 25%) earn around $148 per night.
Average Daily Rate (ADR) Trend by Month in Durness
Get Live Durness Market Intelligence 👇

Explore Real-time Analytics
Airbnb Seasonality Analysis & Trends in Durness (2025)
Peak Season (August, September, July)
- Revenue averages $4,591 per month
- Occupancy rates average 63.4%
- Daily rates average $260
Shoulder Season
- Revenue averages $3,202 per month
- Occupancy maintains around 52.9%
- Daily rates hold near $249
Low Season (January, February, December)
- Revenue drops to average $1,289 per month
- Occupancy decreases to average 24.5%
- Daily rates adjust to average $234
Seasonality Insights for Durness
- The Airbnb seasonality in Durness shows highly seasonal trends requiring careful strategy. While the sections above show seasonal averages, it's also insightful to look at the extremes:
- During the high season, the absolute peak month showcases Durness's highest earning potential, with monthly revenues capable of climbing to $4,803, occupancy reaching a high of 69.6%, and ADRs peaking at $261.
- Conversely, the slowest single month of the year, typically falling within the low season, marks the market's lowest point. In this month, revenue might dip to $1,015, occupancy could drop to 22.3%, and ADRs may adjust down to $232.
- Understanding both the seasonal averages and these monthly peaks and troughs in revenue, occupancy, and ADR is crucial for maximizing your Airbnb profit potential in Durness.
Seasonal Strategies for Maximizing Profit
- Peak Season: Maximize revenue through premium pricing and potentially longer minimum stays. Ensure high availability.
- Low Season: Offer competitive pricing, special promotions (e.g., extended stay discounts), and flexible cancellation policies. Target off-season travelers like remote workers or budget-conscious guests.
- Shoulder Seasons: Implement dynamic pricing that balances peak and low rates. Target weekend travelers or specific events. Offer slightly more flexible terms than peak season.
- Regularly analyze your own performance against these Durness seasonality benchmarks and adjust your pricing and availability strategy accordingly.
Best Areas for Airbnb Investment in Durness (2025)
Exploring the top neighborhoods for short-term rentals in Durness? This section highlights key areas, outlining why they are attractive for hosts and guests, along with notable local attractions. Consider these locations based on your target guest profile and investment strategy.
| Neighborhood / Area | Why Host Here? (Target Guests & Appeal) | Key Attractions & Landmarks |
|---|---|---|
| Sango Sands | Popular for its stunning sandy beaches and dramatic cliffs. Attracts tourists looking for scenic views and outdoor activities like hiking and beachcombing. | Sango Bay, Durness Beach, Cape Wrath, John Lennon Memorial, Smoo Cave |
| Balnakeil Beach | Beautiful and serene beach location, perfect for those seeking tranquility and natural beauty. It's a hidden gem for travelers who love the outdoors. | Balnakeil Beach, Balnakeil Craft Village, Durness Golf Club, Ceannabeinne Beach, Smoo Cave |
| Durness Village | The heart of Durness, offering local shops, cafes, and accommodations. A great base for tourists exploring the surrounding region. | Durness Village Hall, Local cafes, Durness Beach, Smoo Cave, Near Cape Wrath |
| Cape Wrath | Remote and dramatic cliffs, perfect for adventure seekers and those wishing to explore the rugged beauty of Scotland's coastline. A popular destination for nature lovers. | Cape Wrath Lighthouse, Cape Wrath Trail, Beautiful coastal views, Wildlife watching, Historic landmarks |
| Loch Eriboll | Stunning loch area with amazing views and opportunities for outdoor activities. Popular for fishing, kayaking, and sightseeing. | Loch Eriboll, Peatlands, Wildlife viewing, Hiking trails, Scenic photography |
| Foinaven | A beautiful mountain area for hikers and nature enthusiasts. Known for its stunning landscapes and diverse wildlife. | Foinaven Mountain, Hiking routes, Wild flora and fauna, Stunning landscapes, Kayaking opportunities |
| Smoo Cave | An impressive sea cave that attracts visitors interested in geology and adventure. A popular tourist site for those exploring the Durness area. | Smoo Cave, Guided tours, Natural beauty, Historical significance, Nearby beaches |
| Durness Golf Club | A hidden gem for golf lovers, offering spectacular views and a challenging course. Draws both local and traveling golfers. | Durness Golf Course, Scenic views, Pro shop, Clubhouse, Nearby beaches |
Understanding Airbnb License Requirements & STR Laws in Durness (2025)
Yes, Durness, Scotland, United Kingdom enforces high STR regulations. Obtaining a license and ensuring compliance is almost certainly required according to current 2025 STR laws. Always verify the latest short term rental regulations and Airbnb license requirements directly with local government authorities for Durness to ensure full compliance before hosting.
(Source: AirROI data, 2025, based on 36% licensed listings)
Top Performing Airbnb Properties in Durness (2025)
Benchmark your potential! Explore examples of top-performing Airbnb properties in Durnessbased on Trailing Twelve Month (TTM) revenue. Analyze their characteristics, revenue, occupancy rate, and ADR to understand what drives success in this market.
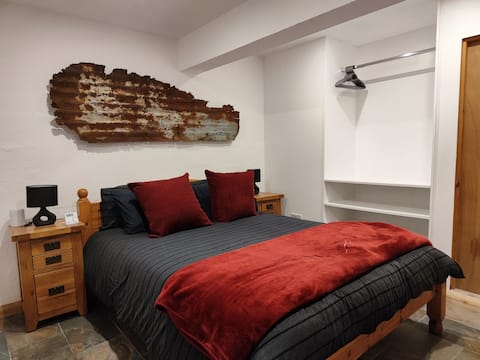
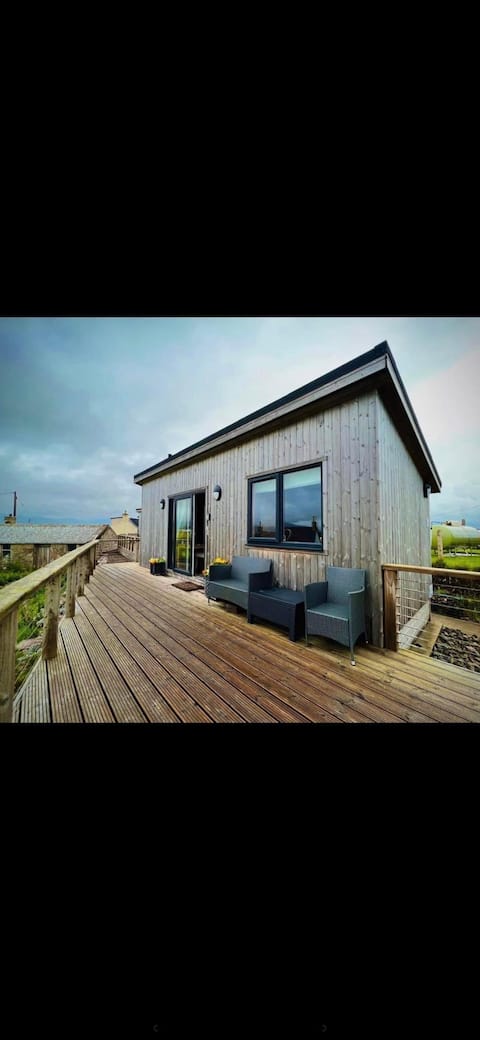
Kempies-Cozy house on the NC500 (Self Catering)
Entire Place • 2 bedrooms

The Bunkhouse at Mackay's in beautiful Durness
Private Room • 4 bedrooms
Acacia shepherd hut @ Aiden House B&B, Durness
Entire Place • 1 bedroom
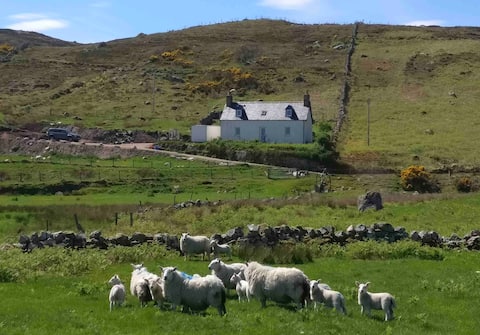
TIGH CEIT (Kate's House) a traditional croft house
Entire Place • 3 bedrooms

Holiday House with garden & sauna (Self Catering)
Entire Place • 2 bedrooms
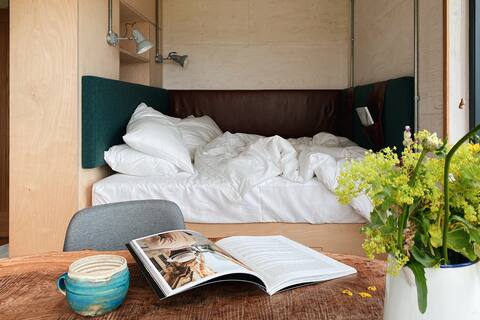
THE BOTHAN - unique Tiny House @ Mackay's
Entire Place • N/A
Note: Performance varies based on location, size, amenities, seasonality, and management quality. Data reflects the past 12 months.
Top Performing Airbnb Hosts in Durness (2025)
Learn from the best! This table showcases top-performing Airbnb hosts in Durness based on the number of properties managed and estimated total revenue over the past year. Analyze their scale and performance metrics.
| Host Name | Properties | Grossing Revenue | Stay Reviews | Avg Rating |
|---|---|---|---|---|
| Alexandra | 6 | $212,349 | 872 | 4.93/5.0 |
| Fiona | 6 | $194,289 | 684 | 4.55/5.0 |
| Kirsteen | 3 | $106,975 | 459 | 4.95/5.0 |
| Philipp | 2 | $102,586 | 1442 | 4.67/5.0 |
| Donald | 2 | $66,474 | 223 | 4.91/5.0 |
| Merlin | 2 | $44,901 | 83 | 4.96/5.0 |
| Ewen | 1 | $41,041 | 56 | 4.96/5.0 |
| Sally | 1 | $11,618 | 4 | 5.00/5.0 |
| Fiona | 1 | $7,652 | 3 | 5.00/5.0 |
| Elliot Houses | 1 | $6,458 | 3 | 5.00/5.0 |
Analyzing the strategies of top hosts, such as their property selection, pricing, and guest communication, can offer valuable lessons for optimizing your own Airbnb operations in Durness.
Dive Deeper: Advanced Durness STR Market Data (2025)
Ready to unlock more insights? AirROI provides access to advanced metrics and comprehensive Airbnb data for Durness. Explore detailed analytics beyond this report to refine your investment strategy, optimize pricing, and maximize your vacation rental profits.
Explore Advanced MetricsDurness Short-Term Rental Market Composition (2025): Property & Room Types
Room Type Distribution
Property Type Distribution
Market Composition Insights for Durness
- The Durness Airbnb market composition is heavily skewed towards Entire Home/Apt listings, which make up 60% of the 25 active rentals. This indicates strong guest preference for privacy and space.
- However, a notable 40% share for Private Rooms suggests opportunities for budget-conscious travelers or hosts renting out spare rooms.
- Looking at the property type distribution in Durness, House properties are the most common (56%), reflecting the local real estate landscape.
- Houses represent a significant 56% portion, catering likely to families or larger groups.
- The presence of 28% Hotel/Boutique listings indicates integration with traditional hospitality.
- Smaller segments like outdoor/unique (combined 4.0%) offer potential for unique stay experiences.
Durness Airbnb Room Capacity Analysis (2025): Bedroom Distribution
Distribution of Listings by Number of Bedrooms
Room Capacity Insights for Durness
- The dominant room capacity in Durness is 1 bedroom listings, making up 48% of the market. This suggests a strong demand for properties suitable for couples or solo travelers.
- Together, 1 bedroom and 2 bedrooms properties represent 64.0% of the active Airbnb listings in Durness, indicating a high concentration in these sizes.
Durness Vacation Rental Guest Capacity Trends (2025)
Distribution of Listings by Guest Capacity
Guest Capacity Insights for Durness
- The most common guest capacity trend in Durness vacation rentals is listings accommodating 2 guests (44%). This suggests the primary traveler segment is likely couples or solo travelers.
- Properties designed for 2 guests and 8+ guests dominate the Durness STR market, accounting for 64.0% of listings.
- A significant 44.0% of listings cater specifically to 1-2 guests, highlighting strong demand from couples and solo travelers in Durness.
- 32.0% of properties accommodate 6+ guests, serving the market segment for larger families or group travel in Durness.
- On average, properties in Durness are equipped to host 3.7 guests.
Durness Airbnb Booking Patterns (2025): Available vs. Booked Days
Available Days Distribution
Booked Days Distribution
Booking Pattern Insights for Durness
- The most common availability pattern in Durness falls within the 91-180 days range, representing 32% of listings. This suggests many properties have significant open periods on their calendars.
- Approximately 56.0% of listings show high availability (181+ days open annually), indicating potential for increased bookings or specific owner usage patterns.
- For booked days, the 181-270 days range is most frequent in Durness (36%), reflecting common guest stay durations or potential owner blocking patterns.
- A notable 48.0% of properties secure long booking periods (181+ days booked per year), highlighting successful long-term rental strategies or significant owner usage.
Durness Airbnb Minimum Stay Requirements Analysis
Distribution of Listings by Minimum Night Requirement
1 Night
12 listings
50% of total
2 Nights
3 listings
12.5% of total
3 Nights
3 listings
12.5% of total
4-6 Nights
1 listings
4.2% of total
30+ Nights
5 listings
20.8% of total
Key Insights
- The most prevalent minimum stay requirement in Durness is 1 Night, adopted by 50% of listings. This highlights the market's preference for shorter, flexible bookings.
- A strong majority (62.5%) of the Durness Airbnb data shows acceptance of very short stays (1-2 nights), indicating a dynamic, high-turnover market.
- A significant segment (20.8%) caters to monthly stays (30+ nights) in Durness, pointing to opportunities in the extended-stay market.
Recommendations
- Align with the market by considering a 1 Night minimum stay, as 50% of Durness hosts use this setting.
- Explore offering discounts for stays of 30+ nights to attract the 20.8% of the market seeking extended stays.
- Adjust minimum nights based on seasonality – potentially shorter during low season and longer during peak demand periods in Durness.
Durness Airbnb Cancellation Policy Trends Analysis (2025)
Super Strict 60 Days
1 listings
4% of total
Flexible
6 listings
24% of total
Moderate
2 listings
8% of total
Strict
16 listings
64% of total
Cancellation Policy Insights for Durness
- The prevailing Airbnb cancellation policy trend in Durness is Strict, used by 64% of listings.
- A majority (64.0%) of hosts in Durness utilize Firm or Strict policies, indicating a market where hosts prioritize booking security.
Recommendations for Hosts
- Consider adopting a Strict policy to align with the 64% market standard in Durness.
- With 64% using Strict terms, this is a viable option in Durness, particularly for high-value properties or during peak demand periods.
- Regularly review your cancellation policy against competitors and market demand shifts in Durness.
Durness STR Booking Lead Time Analysis (2025)
Average Booking Lead Time by Month
Booking Lead Time Insights for Durness
- The overall average booking lead time for vacation rentals in Durness is 87 days.
- Guests book furthest in advance for stays during June (average 127 days), likely coinciding with peak travel demand or local events.
- The shortest booking windows occur for stays in February (average 30 days), indicating more last-minute travel plans during this time.
- Seasonally, Summer (106 days avg.) sees the longest lead times, while Winter (52 days avg.) has the shortest, reflecting typical travel planning cycles.
Recommendations for Hosts
- Use the overall average lead time (87 days) as a baseline for your pricing and availability strategy in Durness.
- For June stays, consider implementing length-of-stay discounts or slightly higher rates for bookings made less than 127 days out to capitalize on advance planning.
- Target marketing efforts for the Summer season well in advance (at least 106 days) to capture early planners.
- Monitor your own booking lead times against these Durness averages to identify opportunities for dynamic pricing adjustments.
Popular & Essential Airbnb Amenities in Durness (2025)
Amenity Prevalence
Amenity Insights for Durness
- Essential amenities in Durness that guests expect include: Essentials, Heating, Hot water. Lacking these (any) could significantly impact bookings.
- Popular amenities like Fire extinguisher, Hair dryer, Smoke alarm are common but not universal. Offering these can provide a competitive edge.
- Warning: Wifi is not universally provided but is considered essential globally. Ensure reliable Wifi is offered.
Recommendations for Hosts
- Ensure your listing includes all essential amenities for Durness: Essentials, Heating, Hot water.
- Consider adding popular differentiators like Fire extinguisher or Hair dryer to increase appeal.
- Highlight unique or less common amenities you offer (e.g., hot tub, dedicated workspace, EV charger) in your listing description and photos.
- Regularly check competitor amenities in Durness to stay competitive.
Durness Airbnb Guest Demographics & Profile Analysis (2025)
Guest Profile Summary for Durness
- The typical guest profile for Airbnb in Durness consists of a mix of domestic (51%) and international guests, often arriving from nearby England, typically belonging to the Post-2000s (Gen Z/Alpha) group (50%), primarily speaking English or French.
- Domestic travelers account for 50.9% of guests.
- Key international markets include United Kingdom (50.9%) and United States (8.9%).
- Top languages spoken are English (53.1%) followed by French (11.7%).
- A significant demographic segment is the Post-2000s (Gen Z/Alpha) group, representing 50% of guests.
Recommendations for Hosts
- Balance marketing efforts between domestic and international channels based on the guest mix.
- Tailor amenities and listing descriptions to appeal to the dominant Post-2000s (Gen Z/Alpha) demographic (e.g., highlight fast WiFi, smart home features, local guides).
- Highlight unique local experiences or amenities relevant to the primary guest profile.
- Consider seasonal promotions aligned with peak travel times for key origin markets.
Nearby Short-Term Rental Market Comparison
How does the Durness Airbnb market stack up against its neighbors? Compare key performance metrics like average monthly revenue, ADR, and occupancy rates in surrounding areas to understand the broader regional STR landscape.
| Market | Active Properties | Monthly Revenue | Daily Rate | Avg. Occupancy |
|---|---|---|---|---|
| Kirkhill | 10 | $5,719 | $700.26 | 44% |
| North Kessock | 10 | $5,421 | $380.62 | 58% |
| Foyers | 14 | $5,076 | $274.52 | 64% |
| Whitebridge | 10 | $4,907 | $417.35 | 42% |
| Camuscross | 11 | $4,649 | $300.59 | 61% |
| Insh | 14 | $4,473 | $289.96 | 63% |
| Teangue | 16 | $4,109 | $239.94 | 61% |
| Kyleakin | 18 | $3,902 | $298.12 | 49% |
| Glenelg | 17 | $3,880 | $232.54 | 58% |
| Nethy Bridge | 49 | $3,742 | $259.42 | 52% |