Dunfermline Airbnb Market Analysis 2025: Short Term Rental Data & Vacation Rental Statistics in Scotland, United Kingdom
Is Airbnb profitable in Dunfermline in 2025? Explore comprehensive Airbnb analytics for Dunfermline, Scotland, United Kingdom to uncover income potential. This 2025 STR market report for Dunfermline, based on AirROI data from April 2024 to March 2025, reveals key trends in the niche market of 88 active listings.
Whether you're considering an Airbnb investment in Dunfermline, optimizing your existing vacation rental, or exploring rental arbitrage opportunities, understanding the Dunfermline Airbnb data is crucial. Navigating the high regulation landscape is key to maximizing your short term rental income potential. Let's dive into the specifics.
Key Dunfermline Airbnb Performance Metrics Overview
Monthly Airbnb Revenue Variations & Income Potential in Dunfermline (2025)
Understanding the monthly revenue variations for Airbnb listings in Dunfermline is key to maximizing your short term rental income potential. Seasonality significantly impacts earnings. Our analysis, based on data from the past 12 months, shows that the peak revenue month for STRs in Dunfermline is typically August, while March often presents the lowest earnings, highlighting opportunities for strategic pricing adjustments during shoulder and low seasons. Explore the typical Airbnb income in Dunfermline across different performance tiers:
- Best-in-class properties (Top 10%) achieve $4,795+ monthly, often utilizing dynamic pricing and superior guest experiences.
- Strong performing properties (Top 25%) earn $3,280 or more, indicating effective management and desirable locations/amenities.
- Typical properties (Median) generate around $2,084 per month, representing the average market performance.
- Entry-level properties (Bottom 25%) see earnings around $1,278, often with potential for optimization.
Average Monthly Airbnb Earnings Trend in Dunfermline
Dunfermline Airbnb Occupancy Rate Trends (2025)
Maximize your bookings by understanding the Dunfermline STR occupancy trends. Seasonal demand shifts significantly influence how often properties are booked. Typically, Augustsees the highest demand (peak season occupancy), while March experiences the lowest (low season). Effective strategies, like adjusting minimum stays or offering promotions, can boost occupancy during slower periods. Here's how different property tiers perform in Dunfermline:
- Best-in-class properties (Top 10%) achieve 80%+ occupancy, indicating high desirability and potentially optimized availability.
- Strong performing properties (Top 25%) maintain 67% or higher occupancy, suggesting good market fit and guest satisfaction.
- Typical properties (Median) have an occupancy rate around 49%.
- Entry-level properties (Bottom 25%) average 30% occupancy, potentially facing higher vacancy.
Average Monthly Occupancy Rate Trend in Dunfermline
Average Daily Rate (ADR) Airbnb Trends in Dunfermline (2025)
Effective short term rental pricing strategy in Dunfermline involves understanding monthly ADR fluctuations. The Average Daily Rate (ADR) for Airbnb in Dunfermline typically peaks in December and dips lowest during April. Leveraging Airbnb dynamic pricing tools or strategies based on this seasonality can significantly boost revenue. Here's a look at the typical nightly rates achieved:
- Best-in-class properties (Top 10%) command rates of $244+ per night, often due to premium features or locations.
- Strong performing properties (Top 25%) achieve nightly rates of $174 or more.
- Typical properties (Median) charge around $129 per night.
- Entry-level properties (Bottom 25%) earn around $87 per night.
Average Daily Rate (ADR) Trend by Month in Dunfermline
Get Live Dunfermline Market Intelligence 👇

Explore Real-time Analytics
Airbnb Seasonality Analysis & Trends in Dunfermline (2025)
Peak Season (August, July, May)
- Revenue averages $3,993 per month
- Occupancy rates average 67.7%
- Daily rates average $162
Shoulder Season
- Revenue averages $2,732 per month
- Occupancy maintains around 50.3%
- Daily rates hold near $161
Low Season (January, February, March)
- Revenue drops to average $1,467 per month
- Occupancy decreases to average 29.0%
- Daily rates adjust to average $157
Seasonality Insights for Dunfermline
- The Airbnb seasonality in Dunfermline shows highly seasonal trends requiring careful strategy. While the sections above show seasonal averages, it's also insightful to look at the extremes:
- During the high season, the absolute peak month showcases Dunfermline's highest earning potential, with monthly revenues capable of climbing to $4,493, occupancy reaching a high of 75.2%, and ADRs peaking at $172.
- Conversely, the slowest single month of the year, typically falling within the low season, marks the market's lowest point. In this month, revenue might dip to $1,435, occupancy could drop to 27.7%, and ADRs may adjust down to $151.
- Understanding both the seasonal averages and these monthly peaks and troughs in revenue, occupancy, and ADR is crucial for maximizing your Airbnb profit potential in Dunfermline.
Seasonal Strategies for Maximizing Profit
- Peak Season: Maximize revenue through premium pricing and potentially longer minimum stays. Ensure high availability.
- Low Season: Offer competitive pricing, special promotions (e.g., extended stay discounts), and flexible cancellation policies. Target off-season travelers like remote workers or budget-conscious guests.
- Shoulder Seasons: Implement dynamic pricing that balances peak and low rates. Target weekend travelers or specific events. Offer slightly more flexible terms than peak season.
- Regularly analyze your own performance against these Dunfermline seasonality benchmarks and adjust your pricing and availability strategy accordingly.
Best Areas for Airbnb Investment in Dunfermline (2025)
Exploring the top neighborhoods for short-term rentals in Dunfermline? This section highlights key areas, outlining why they are attractive for hosts and guests, along with notable local attractions. Consider these locations based on your target guest profile and investment strategy.
| Neighborhood / Area | Why Host Here? (Target Guests & Appeal) | Key Attractions & Landmarks |
|---|---|---|
| City Centre | Dunfermline's City Centre offers a blend of historical sites and modern amenities, making it attractive to both tourists and business travelers. | Dunfermline Abbey, Pittencrieff Park, Andrew Carnegie Birthplace Museum, Dunfermline Museum, Cameron House |
| Pittencrieff Park | Known as the 'Glen' in the heart of Dunfermline, this area is popular for its picturesque landscapes and walking paths, drawing nature lovers and families. | Pittencrieff Park, Dunfermline Abbey, The Glorious Gardens, Playgrounds, Wildlife spotting |
| Dunfermline Abbey | An iconic historical site attracting visitors interested in Scottish heritage, ideal for stays that cater to history enthusiasts. | Dunfermline Abbey, Carnegie Library, The Abbey Church, Historic sculptures |
| East End | A vibrant area with a mix of residential and retail spaces. It's convenient for guests who want local amenities and easy transport links. | High Street shops, Local restaurants, Leisure facilities, Transport links, Community events |
| Benedictine Monastery | This tranquil area offers a unique stay experience with beautiful surroundings, ideal for spiritual retreats or quiet getaways. | Benedictine Monastery, Gardens, Nature walks, Local cafes, Quiet atmosphere |
| Townhill | Offering beautiful views of the surrounding area, Townhill is ideal for visitors looking for a peaceful retreat close to nature. | Townhill Country Park, Outdoor activities, Walking trails, Scenic views, Wildlife |
| Ferrytoll | An area with excellent transport links to Edinburgh and Fife, appealing to visitors who wish to explore surrounding cities easily. | Forth Road Bridge, Transport connections, Nearby attractions in Edinburgh, Park and ride services, Gateway to Fife |
| Dunfermline North | A residential area that provides a home-like atmosphere for visitors, suitable for families or longer stays. | Local parks, Community centers, Family-friendly amenities, Residential experience, Quiet neighborhoods |
Understanding Airbnb License Requirements & STR Laws in Dunfermline (2025)
Yes, Dunfermline, Scotland, United Kingdom enforces high STR regulations. Obtaining a license and ensuring compliance is almost certainly required according to current 2025 STR laws. Always verify the latest short term rental regulations and Airbnb license requirements directly with local government authorities for Dunfermline to ensure full compliance before hosting.
(Source: AirROI data, 2025, based on 32% licensed listings)
Top Performing Airbnb Properties in Dunfermline (2025)
Benchmark your potential! Explore examples of top-performing Airbnb properties in Dunfermlinebased on Trailing Twelve Month (TTM) revenue. Analyze their characteristics, revenue, occupancy rate, and ADR to understand what drives success in this market.
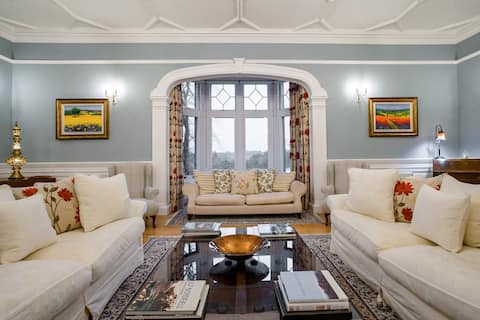
Re-Imagined Historical Country House Retreat
Entire Place • 10 bedrooms
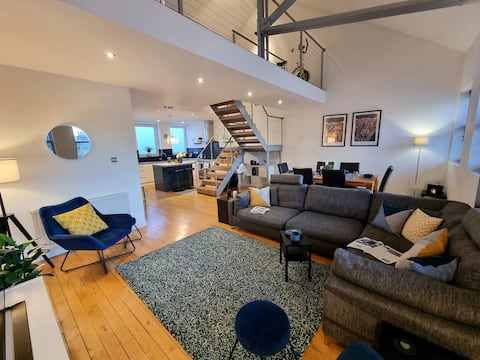
St Margaret's Loft Apartment
Entire Place • 4 bedrooms

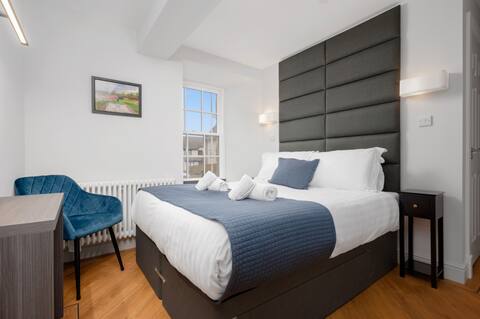
312 Reid's Corner - by StayDunfermline
Entire Place • 3 bedrooms
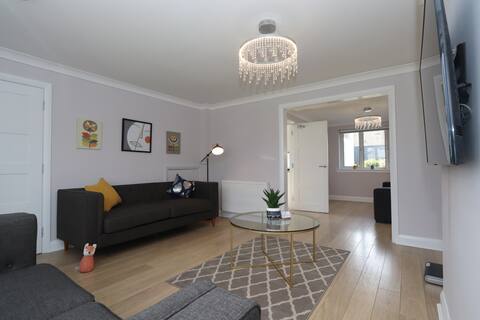
316 Reid's Corner - by StayDunfermline
Entire Place • 3 bedrooms
Dunfermline - Luxury 3 bedroom 2 bathroom house
Entire Place • 3 bedrooms

Sweet and simple
Entire Place • 2 bedrooms
Note: Performance varies based on location, size, amenities, seasonality, and management quality. Data reflects the past 12 months.
Top Performing Airbnb Hosts in Dunfermline (2025)
Learn from the best! This table showcases top-performing Airbnb hosts in Dunfermline based on the number of properties managed and estimated total revenue over the past year. Analyze their scale and performance metrics.
| Host Name | Properties | Grossing Revenue | Stay Reviews | Avg Rating |
|---|---|---|---|---|
| Franc | 1 | $264,776 | 17 | 5.00/5.0 |
| Stay Dunfermline | 5 | $224,341 | 93 | 4.86/5.0 |
| Saieda | 4 | $120,063 | 51 | 4.71/5.0 |
| Graham | 6 | $111,435 | 245 | 4.45/5.0 |
| Kashif | 4 | $97,667 | 191 | 4.93/5.0 |
| Hannah | 1 | $93,062 | 88 | 4.99/5.0 |
| Carla | 2 | $82,127 | 313 | 4.91/5.0 |
| Gem Serviced Apartments | 2 | $77,297 | 65 | 4.79/5.0 |
| Alistair | 3 | $74,819 | 120 | 4.90/5.0 |
| Katie | 2 | $52,163 | 108 | 5.00/5.0 |
Analyzing the strategies of top hosts, such as their property selection, pricing, and guest communication, can offer valuable lessons for optimizing your own Airbnb operations in Dunfermline.
Dive Deeper: Advanced Dunfermline STR Market Data (2025)
Ready to unlock more insights? AirROI provides access to advanced metrics and comprehensive Airbnb data for Dunfermline. Explore detailed analytics beyond this report to refine your investment strategy, optimize pricing, and maximize your vacation rental profits.
Explore Advanced MetricsDunfermline Short-Term Rental Market Composition (2025): Property & Room Types
Room Type Distribution
Property Type Distribution
Market Composition Insights for Dunfermline
- The Dunfermline Airbnb market composition is heavily skewed towards Entire Home/Apt listings, which make up 85.2% of the 88 active rentals. This indicates strong guest preference for privacy and space.
- Looking at the property type distribution in Dunfermline, Apartment/Condo properties are the most common (59.1%), reflecting the local real estate landscape.
- Houses represent a significant 29.5% portion, catering likely to families or larger groups.
- Smaller segments like hotel/boutique, outdoor/unique, others, unique stays (combined 11.4%) offer potential for unique stay experiences.
Dunfermline Airbnb Room Capacity Analysis (2025): Bedroom Distribution
Distribution of Listings by Number of Bedrooms
Room Capacity Insights for Dunfermline
- The dominant room capacity in Dunfermline is 2 bedrooms listings, making up 45.5% of the market. This suggests a strong demand for properties suitable for couples or solo travelers.
- Together, 2 bedrooms and 1 bedroom properties represent 69.4% of the active Airbnb listings in Dunfermline, indicating a high concentration in these sizes.
Dunfermline Vacation Rental Guest Capacity Trends (2025)
Distribution of Listings by Guest Capacity
Guest Capacity Insights for Dunfermline
- The most common guest capacity trend in Dunfermline vacation rentals is listings accommodating 4 guests (38.6%). This suggests the primary traveler segment is likely small families or groups.
- Properties designed for 4 guests and 6 guests dominate the Dunfermline STR market, accounting for 53.4% of listings.
- 20.5% of properties accommodate 6+ guests, serving the market segment for larger families or group travel in Dunfermline.
- On average, properties in Dunfermline are equipped to host 3.7 guests.
Dunfermline Airbnb Booking Patterns (2025): Available vs. Booked Days
Available Days Distribution
Booked Days Distribution
Booking Pattern Insights for Dunfermline
- The most common availability pattern in Dunfermline falls within the 181-270 days range, representing 37.5% of listings. This suggests many properties have significant open periods on their calendars.
- Approximately 58.0% of listings show high availability (181+ days open annually), indicating potential for increased bookings or specific owner usage patterns.
- For booked days, the 91-180 days range is most frequent in Dunfermline (38.6%), reflecting common guest stay durations or potential owner blocking patterns.
- A notable 42.1% of properties secure long booking periods (181+ days booked per year), highlighting successful long-term rental strategies or significant owner usage.
Dunfermline Airbnb Minimum Stay Requirements Analysis
Distribution of Listings by Minimum Night Requirement
1 Night
13 listings
15.3% of total
2 Nights
33 listings
38.8% of total
3 Nights
13 listings
15.3% of total
4-6 Nights
7 listings
8.2% of total
7-29 Nights
2 listings
2.4% of total
30+ Nights
17 listings
20% of total
Key Insights
- The most prevalent minimum stay requirement in Dunfermline is 2 Nights, adopted by 38.8% of listings. This highlights the market's preference for shorter, flexible bookings.
- A significant segment (20%) caters to monthly stays (30+ nights) in Dunfermline, pointing to opportunities in the extended-stay market.
Recommendations
- Align with the market by considering a 2 Nights minimum stay, as 38.8% of Dunfermline hosts use this setting.
- If feasible, allowing 1-night stays, especially midweek or during low season, could capture last-minute bookings, as only 15.3% currently do.
- A 2-night minimum appears standard (38.8%). Consider this for weekends or peak periods.
- Explore offering discounts for stays of 30+ nights to attract the 20% of the market seeking extended stays.
- Adjust minimum nights based on seasonality – potentially shorter during low season and longer during peak demand periods in Dunfermline.
Dunfermline Airbnb Cancellation Policy Trends Analysis (2025)
Refundable
1 listings
1.2% of total
Flexible
9 listings
10.6% of total
Moderate
23 listings
27.1% of total
Firm
27 listings
31.8% of total
Strict
25 listings
29.4% of total
Cancellation Policy Insights for Dunfermline
- The prevailing Airbnb cancellation policy trend in Dunfermline is Firm, used by 31.8% of listings.
- A majority (61.2%) of hosts in Dunfermline utilize Firm or Strict policies, indicating a market where hosts prioritize booking security.
Recommendations for Hosts
- Consider adopting a Firm policy to align with the 31.8% market standard in Dunfermline.
- Regularly review your cancellation policy against competitors and market demand shifts in Dunfermline.
Dunfermline STR Booking Lead Time Analysis (2025)
Average Booking Lead Time by Month
Booking Lead Time Insights for Dunfermline
- The overall average booking lead time for vacation rentals in Dunfermline is 63 days.
- Guests book furthest in advance for stays during June (average 124 days), likely coinciding with peak travel demand or local events.
- The shortest booking windows occur for stays in February (average 34 days), indicating more last-minute travel plans during this time.
- Seasonally, Summer (103 days avg.) sees the longest lead times, while Winter (53 days avg.) has the shortest, reflecting typical travel planning cycles.
Recommendations for Hosts
- Use the overall average lead time (63 days) as a baseline for your pricing and availability strategy in Dunfermline.
- For June stays, consider implementing length-of-stay discounts or slightly higher rates for bookings made less than 124 days out to capitalize on advance planning.
- Target marketing efforts for the Summer season well in advance (at least 103 days) to capture early planners.
- Monitor your own booking lead times against these Dunfermline averages to identify opportunities for dynamic pricing adjustments.
Popular & Essential Airbnb Amenities in Dunfermline (2025)
Amenity Prevalence
Amenity Insights for Dunfermline
- Essential amenities in Dunfermline that guests expect include: Smoke alarm, Heating, Essentials. Lacking these (any) could significantly impact bookings.
- Popular amenities like TV, Wifi, Hot water are common but not universal. Offering these can provide a competitive edge.
- Warning: Wifi is not universally provided but is considered essential globally. Ensure reliable Wifi is offered.
Recommendations for Hosts
- Ensure your listing includes all essential amenities for Dunfermline: Smoke alarm, Heating, Essentials.
- Prioritize adding missing essentials: Smoke alarm, Heating, Essentials.
- Consider adding popular differentiators like TV or Wifi to increase appeal.
- Highlight unique or less common amenities you offer (e.g., hot tub, dedicated workspace, EV charger) in your listing description and photos.
- Regularly check competitor amenities in Dunfermline to stay competitive.
Dunfermline Airbnb Guest Demographics & Profile Analysis (2025)
Guest Profile Summary for Dunfermline
- The typical guest profile for Airbnb in Dunfermline consists of a mix of domestic (48%) and international guests, with top international origins including United States, typically belonging to the Post-2000s (Gen Z/Alpha) group (50%), primarily speaking English or French.
- Domestic travelers account for 47.7% of guests.
- Key international markets include United Kingdom (47.7%) and United States (16.1%).
- Top languages spoken are English (56%) followed by French (8.5%).
- A significant demographic segment is the Post-2000s (Gen Z/Alpha) group, representing 50% of guests.
Recommendations for Hosts
- Balance marketing efforts between domestic and international channels based on the guest mix.
- Tailor amenities and listing descriptions to appeal to the dominant Post-2000s (Gen Z/Alpha) demographic (e.g., highlight fast WiFi, smart home features, local guides).
- Highlight unique local experiences or amenities relevant to the primary guest profile.
- Consider seasonal promotions aligned with peak travel times for key origin markets.
Nearby Short-Term Rental Market Comparison
How does the Dunfermline Airbnb market stack up against its neighbors? Compare key performance metrics like average monthly revenue, ADR, and occupancy rates in surrounding areas to understand the broader regional STR landscape.
| Market | Active Properties | Monthly Revenue | Daily Rate | Avg. Occupancy |
|---|---|---|---|---|
| Galston | 11 | $7,951 | $676.77 | 46% |
| Fearnan | 19 | $6,440 | $421.92 | 53% |
| Gorebridge | 12 | $6,209 | $493.62 | 54% |
| Bridge of Cally | 16 | $5,839 | $566.24 | 50% |
| Kirkhill | 10 | $5,719 | $700.26 | 44% |
| North Kessock | 10 | $5,421 | $380.62 | 58% |
| Foyers | 14 | $5,076 | $274.52 | 64% |
| Arrochar | 33 | $5,045 | $339.11 | 56% |
| Whitebridge | 10 | $4,907 | $417.35 | 42% |
| Acharn | 10 | $4,813 | $278.43 | 57% |